Diabetes mellitus, TB, and HIV multi-morbidities among adults in Uganda
J.E. Akumu, C. Sekaggya-Wiltshire, S. Babirye, J. Musaazi, P.E. Kukundakwe, C. Okiira, E. Mutebi, S. Nabadda, P. Namuwenge, H. Sendagire

TL;DR
This study found higher diabetes rates among people with HIV, TB, or both in Uganda, highlighting the need for combined health strategies.
Contribution
The study provides new insights into diabetes prevalence among HIV and TB patients, emphasizing the importance of integrated care.
Findings
Diabetes prevalence was highest in TB–HIV co-infected patients at 14.3%.
Older patients (≥36 years) had significantly higher diabetes rates across all groups.
Males with HIV had higher diabetes prevalence than females (6.8% vs. 3.0%).
Abstract
Antiretroviral therapy has extended HIV patient survival, increasing non-communicable disease prevalence like diabetes mellitus. Strong links exist between HIV, TB, and diabetes. This study examined diabetes prevalence among adults with TB and HIV, or co-infection in Uganda. Cross-sectional study conducted between August 2021 and January 2022 at three urban hospitals in Kampala, Uganda. Participants aged ≥18 years receiving HIV and/or TB treatment for at least 6 months were enrolled. Diabetes screening was performed using random blood glucose and haemoglobin A1C measurements according to American Diabetes Association guidelines. Among 924 participants, 832 (90.0%) had HIV only, 50 (5.4%) had TB only, and 42 (4.6%) had both conditions. Overall diabetes prevalence was 4.1% in HIV patients, 7.6% in TB patients, and 14.3% in TB–HIV co-infected patients. Diabetes was significantly more…
Genes, proteins, chemicals, diseases, species, mutations and cell lines named across the full text — each resolved to its canonical identifier and authoritative record.
Click any figure to enlarge with its caption.
 FIGURE
| Characteristic | Overall | HIV only | TB only | HIV and TB |
|---|---|---|---|---|
| N = 924 | N = 832 (90.0%) | N = 50 (5.4) | N = 42 (4.6) | |
| n (col %) | n (col %) | n (col %) | n (col%) | |
| Sex (male) | 269 (29.4) | 210 (25.5) | 35 (70.0) | 24 (58.5) |
| Median age (IQR) (years) | 36.0 (29.0, 44.0) | 37.0 (30.0, 44.0) | 29.0 (23.0, 38.0) | 35.5 (29.3, 45.0) |
| Age categories | ||||
| 18–24 years | 92 (10.0) | 74 (8.9) | 15 (30.0) | 3 (7.1) |
| 25–35 years | 355 (38.4) | 320 (38.5) | 17 (34.0) | 18 (42.9) |
| 36–50 years | 372 (40.3) | 343 (41.2) | 15 (30.0) | 14 (33.3) |
| ≥51 years | 105 (11.4) | 95 (11.4) | 3 (6.0) | 7 (16.7) |
| Median BMI (IQR) (kg/m2) | 23.8 (21.1, 27.7) | 24.2 (21.5, 28.2) | 20.0 (17.4, 20.9) | 21.2 (19.3, 23.9) |
| BMI categories (kg/m2) | ||||
| <18.5 | 65 (7.2) | 40 (4.9) | 16 (32.0) | 9 (21.4) |
| 18.5–24.9 | 459 (50.9) | 404 (49.9) | 31 (62.0) | 24 (57.1) |
| 25.0–29.9 | 239 (26.5) | 229 (28.3) | 1 (2.0) | 9 (21.4) |
| ≥30 | 139 (15.4) | 137 (16.9) | 2 (4.0) | 0 (0.0) |
| Median waist circumference (IQR) (cm) | 81.0 (74.0, 90.3) | 82.0 (74.1, 91.0) | 70.0 (68.0, 75.1) | 76.8 (72.1, 83.1) |
| Central obesity present | 410 (45.5) | 398 (48.7) | 4 (8.9) | 8 (20.5) |
| Education level (n = 899) | ||||
| None | 73 (8.1) | 69 (8.5) | 0 (0.0) | 4 (10.3) |
| Primary | 353 (39.3) | 327 (40.2) | 9 (19.6) | 17 (43.6) |
| Secondary | 380 (42.3) | 347 (42.6) | 21 (45.7) | 12 (30.8) |
| Tertiary | 93 (10.3) | 71 (8.7) | 16 (34.8) | 6 (14.4) |
| Currently pregnant | 13 (2.1) | 13 (2.2) | 0 (0.0) | 0 (0.0) |
| On ART, yes | 822 (98.0) | 788 (98.5) | NA | 34 (87.2) |
| DTG-based regimen, yes | 762 (93.4) | 735 (93.9) | NA | 27 (81.8) |
| Viral load copies/mL (n = 725) | ||||
| <1,000 | 720 (99.3) | 712 (99.4) | NA | 8 (88.9) |
| >1,000 | 5 (0.7) | 4 (0.6) | NA | 1 (11.1) |
| On TB treatment | 88 (96.7) | NA | 49 (100.0) | 39 (92.9) |
| Type of TB (n = 80) | ||||
| Bacteriologically confirmed | 66 (82.5) | NA | 39 (83.0) | 27 (81.8) |
| Clinically diagnosed | 14 (17.5) | NA | 8 (17.0) | 6 (18.2) |
| Site of TB (n = 45) | ||||
| Abdominal | 1 (2.2) | NA | 0 (0.0) | 1 (7.7) |
| Pulmonary | 43 (95.6) | NA | 31 (96.9) | 12 (92.3) |
| Testicular | 1 (2.2) | NA | 1 (3.1) | 0 (0.0) |
| History of TB treatment | 59 (6.9) | 47 (6.2) | 7 (14.0) | 5 (11.9) |
| Duration of TB treatment (in months) (n = 85), | 2.0 (1.0–5.0) | NA | 2.0 (1.0, 4.5) | 3.0 (1.0, 5.0) |
| Known diabetic | 13 (72.2) | 11 (73.3) | 1 (100.0) | 1 (50.0) |
| Systolic BP (N = 920) | ||||
| <140 | 712 (77.4) | 629 (76.0) | 46 (92.0) | 37 (88.1) |
| ≥140 | 208 (22.6) | 199 (24.0) | 4 (8.0) | 5 (11.9) |
| Diastolic BP (N = 920) | ||||
| <90 | 685 (74.5) | 607 (73.3) | 43 (86.0) | 35 (83.3) |
| ≥90 | 235 (25.5) | 221 (26.7) | 7 (14.0) | 7 (16.7) |
| Known hypertensive | 40 (4.5) | 37 (4.6) | 1 (2.2) | 2 (5.3) |
| Smoker, yes | 44 (4.8) | 28 (3.4) | 10 (20.4) | 6 (14.3) |
| Characteristic | Prevalence of DM | |||||
|---|---|---|---|---|---|---|
| Any HIV | Any TB | TB and HIV | ||||
| n (row %) | n (row %) | n (row %) | ||||
| Overall DM prevalence | 36 (4.1) | 7 (7.6) | 6 (14.3) | |||
| Gender | 0.011 | 1.000 | 0.373 | |||
| Male | 16 (6.8) | 5 (8.5) | 5 (20.8) | |||
| Female | 19 (3.0) | 2 (6.3) | 1 (5.9) | |||
| Age categories | <0.001 | 0.002 | 0.019 | |||
| 18–24 years | 0 (0.0) | 0 (0.0) | 0 (0.0) | |||
| 25–35 years | 3 (0.9) | 0 (0.0) | 0 (0.0) | |||
| 36–50 years | 18 (5.0) | 4 (13.8) | 3 (21.4) | |||
| ≥51 years | 15 (14.7) | 3 (30.0) | 3 (42.9) | |||
| BMI categories (kg/m2) | 0.124 | 0.424 | 0.836 | |||
| <18.5 | 2 (4.1) | 1 (4.0) | 1 (11.1) | |||
| 18.5–24.9 | 14 (3.3) | 4 (7.3) | 3 (12.5) | |||
| 25.0–29.9 | 9 (3.8) | 2 (20.0) | 2 (22.2) | |||
| ≥30 | 11 (8.0) | 0 (0.0) | 0 (0.0) | |||
| Waist circumference | 0.062 | 0.007 | 0.088 | |||
| Central obesity | 22 (5.4) | 4 (33.3) | 3 (37.5) | |||
| Normal | 13 (2.9) | 3 (4.2) | 3 (9.7) | |||
| Education level | 0.840 | 0.745 | 1.000 | |||
| None | 2 (2.7) | 0 (0.0) | 0 (0.0) | |||
| Primary | 13 (3.8) | 3 (11.5) | 3 (17.6) | |||
| Secondary | 16 (4.5) | 2 (6.1) | 2 (16.7) | |||
| Tertiary | 4 (5.2) | 1 (4.5) | 1 (16.7) | |||
| Characteristic | Prevalence of diabetes | |||||
|---|---|---|---|---|---|---|
| HIV | TB | Both TB and HIV | ||||
| n (row %) | n = 4 (row %) | n (row %) | ||||
| ART status | 1.000 | 0.574 | ||||
| On ART | 35 (4.3) | 6 (17.6) | 6 (17.6) | |||
| Current ART regimen | <0.001 | 1.000 | 1.000 | |||
| DTG-based regimen | 23 (3.0) | 5 (18.5) | 5 (18.5) | |||
| Viral load copies/mL | 1.000 | 1.000 | 1.000 | |||
| <1,000 | 30 (4.2) | 2 (25.0) | 2 (25.0) | |||
| >1,000 | 0 (0.0) | 0 (0.0) | 0 (0.0) | |||
| Current TB treatment | 0.019 | 0.216 | 0.378 | |||
| No | 31 (3.7) | 1 (33.3) | 1 (33.3) | |||
| Yes | 5 (12.8) | 6 (6.8) | 5 (12.8) | |||
| Duration of TB treatment (in months) for TB groups | 0.186 | |||||
| Median (IQR) | 1.5 (1.0–2.3) | 0.186 | 2.0 (1.0 – 3.0) | 0.787 | 1.5 (1.0 – 2.3) | |
| Type of TB | 1.000 | 1.000 | 1.000 | |||
| Bacteriologically confirmed | 5 (18.5) | 6 (9.1) | 5 (18.5) | |||
| Clinically diagnosed | 1 (16.7) | 1 (7.1) | 1 (16.7) | |||
| Site of TB | 1.000 | 1.000 | 1.000 | |||
| Abdominal | 0 (0.0) | 0 (0.0) | 0 (0.0) | |||
| Pulmonary | 4 (33.3) | 5 (11.6) | 4 (33.3) | |||
| Testicular | 0 (0.0) | 0 (0.0) | 0 (0.0) | |||
| History of prior TB treatment | 0.050 | 1.000 | 0.557 | |||
| No | 27 (3.6) | 6 (7.5) | 5 (13.5) | |||
| Yes | 5 (9.6) | 1 (8.3) | 1 (20.0) | |||
| Systolic BP | <0.001 | 0.138 | 0.141 | |||
| <140 | 18 (2.7) | 5 (6.0) | 4 (10.8) | |||
| ≥140 | 18 (8.8) | 2 (22.2) | 2 (40.0) | |||
| Diastolic BP | 0.011 | 0.288 | 0.257 | |||
| <90 | 20 (3.1) | 5 (6.4) | 4 (11.4) | |||
| ≥90 | 16 (7.0) | 2 (14.3) | 2 (28.6) | |||
| History of hypertension | 0.079 | 0.232 | 0.294 | |||
| Yes | 4 (10.3) | 1 (33.3) | 1 (50.0) | |||
| Smoking History | 0.127 | 1.000 | 1.000 | |||
| Yes | 3 (8.8) | 1 (6.3) | 1 (16.7) | |||
Peer Reviews
No public reviews on file for this paper yet. If you reviewed it on a platform where reviews are public (OpenReview, ICLR, NeurIPS, ICML), you can paste yours below so the community can read it here.
Videos
No videos yet. Explain this paper in a talk, walkthrough, or lecture? Add one.
Taxonomy
TopicsHIV-related health complications and treatments · HIV/AIDS Research and Interventions · Tuberculosis Research and Epidemiology
The broad access to effective antiretroviral therapy (ART) has dramatically lowered HIV-related morbidity and mortality worldwide, thereby extending the life expectancy of people living with HIV (PLHIV).^1,2^ However, the prevalence of non-communicable diseases (NCDs) in an increasingly older population of PLHIV is also escalating. NCDs currently cause up to 17 million deaths annually in individuals under 70 years old, with the majority of these deaths (77%) occurring in low- and middle-income countries (LMICs).^3^
In Uganda, NCDs are responsible for about one third of all deaths, leaving every Ugandan with a 22% risk of dying from cardiovascular diseases, cancers, chronic respiratory diseases, or diabetes.^4^ Amid Uganda’s ongoing struggles with TB and HIV,^5^ there is mounting concern over the rise of NCDs, such as diabetes. Studies indicate substantial links between HIV and diabetes mellitus (DM),^6^ as well as a bidirectional relationship between TB and diabetes.^7^ Individuals with DM are three times more likely to develop TB than those without,^8^ and about 30% of people infected with TB may be associated with diabetes.^9^ Furthermore, individuals living with HIV and on ART have a four-fold risk of developing diabetes.^10^ The global rise of diabetes among PLHIV presents an intricate medical challenge, with the WHO reporting that approximately 7% of PLHIV are also grappling with DM.^11^ In Uganda which has a high TB and TB/HIV co-infection burden, roughly 716,000 adults diagnosed with the condition.^12^ Such comorbidity elevates the complexity of patient care,^13^ demanding a shift towards integrated treatment strategies^14^ to navigate the multifaceted intricacies of DM, TB, and HIV.
The burgeoning health crisis in Uganda, where diabetes, TB, and HIV intersect, calls for in-depth research to unravel the prevalence of the intertwined relationships of these conditions. By delineating the risk factors and measuring the prevalence of DM among those impacted by TB, HIV, or their combination, this study seeks to inform robust patient care strategies and generate insights that will shape health policies.
METHODS
This was a cross-sectional study that was conducted between August 2021 and January 2022, within a collaboration between the Uganda National Health Laboratory Services, AIDS Control Program, and the Infectious Disease Institute. The study was conducted at three urban hospitals in Kampala, Uganda, including Kiruddu National Referral Hospital, Kawempe National Referral Hospital, and Kisenyi Health Centre IV. Study sites were selected based on their status as major referral centres, offering free health care services and attracting diverse patient populations from across Uganda.
Study population
The study included patients aged 18 years or above who were receiving HIV and or TB treatment at HIV or TB clinics of the participating health facilities over a period of at least 6 months. To ensure the integrity of the study, we excluded patients who were critically ill and those who needed intensive care.
Study procedures and study variables
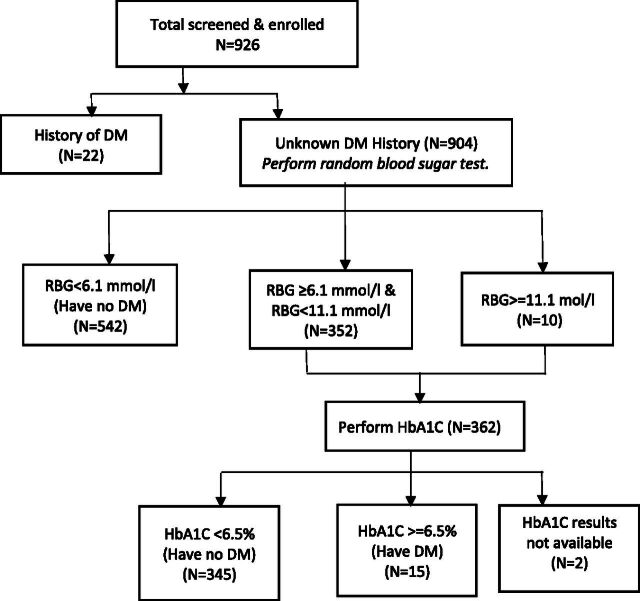
Eligible patients were screened and consented. Screening for diabetes was conducted according to the American Diabetes Association’s guidelines. The presence of diabetes was ascertained through random blood sugar (RBS) assessments via finger-prick tests with a calibrated glucometer, and haemoglobin A1C (HbA1C) levels measured from venous blood samples. Normoglycemic individuals presenting with an RBS of 110 mg/dL (6.1 mmol/L) or lower were not subjected to additional glucose testing. Patients with RBS ranging from 110 mg/dL (6.1 mmol/L) to <200 mg/dL (11.1 mmol/L) were classified as impaired glucose tolerance and underwent HbA1C testing to evaluate for diabetes. An RBS level of ≥200 mg/dL (11.1 mmol/L) also received a subsequent HbA1C. An HBA1C of ≥6.5% was classified as DM. Participants newly diagnosed with DM were subsequently referred for appropriate management. We collected demographic data, including age, sex, medical history such as prior diabetes diagnosis, HIV status, length of HIV infection, antiretroviral therapies administered currently and, in the past, viral load, as well as TB infection history and treatments given. Physical examination of blood pressure (BP), waist circumference categorised as normal or centrally obese using the International Diabetes Federation criteria (men: ≥90 cm; women: ≥80 cm), weight, and height were systematically documented.
Statistical analysis
Participants’ socio-demographic and clinical profiles were presented as frequencies and percentages for categorical variables, whereas median and interquartile ranges (IQRs) were used for continuous variables, stratified by HIV, TB, or HIV/TB co-infection. The prevalence of diabetes was calculated in various age categories and sub-groups including HIV, TB, or dual infections, and compared using Pearson χ² or Fisher’s exact test for categorical variables, and the Mann-Whitney U test was selected for continuous variables. Data was analysed using R version 4.3.2.
Ethical statement
This study received ethical clearance from the Uganda National Health Laboratory Services Institutional Review Board as well as the Uganda National Council for Science and Technology, under the research registration number HS1386ES. Written informed consent was obtained from all participants, and the study was conducted according to the principles of good clinical practice.
RESULTS
We enrolled 924 participants, and of these, 832 (90.0%) had HIV only, 50 (5.4%) had TB only, and 42 (4.6%) had both TB and HIV. The majority were female (645, 70.6%), with a median age of 36 years (IQR: 29, 44), a median body mass index of 23.8 kg/cm^2^ (IQR: 21.1, 27.7), and a median waist circumference of 81.0 cm (IQR: 74.0, 90.3).
Regarding clinical characteristics, the majority (822 [98%]) were on ART, and 720 (99.3%) were virologically suppressed. The median duration of TB treatment for those diagnosed with TB was 2 months (IQR: 1, 5). Of those with a prior diagnosis of diabetes, 13 (72.2%) were on oral hypoglycemics. We found 40 (4.5%) had a history of hypertensive, and 44 (4.8%) had a history of smoking (Table 1).
Diabetes was more prevalent among older patients (≥36 years) across all disease categories compared to younger patients (<36 years), and more among males with any HIV infection compared to females with HIV (6.8% vs. 3%, P = 0.011) in a comprehensive analysis of the prevalence of DM across a sample of patients with any HIV or any TB or both TB and HIV co-infection (Table 2). Furthermore, the prevalence of diabetes was also more in TB patients with an obese waist circumference (33.3% vs. 4.2%, P = 0.007).
For patients with HIV, diabetes was more prevalent among those on other ART-based regimens compared to the dolutegravir (DTG)-based regimens (3.0%, P < 0.001), those who were currently on TB treatment versus those who were not on treatment (12.8% vs. 3.7%, 0.019), those whose SBP ≥140 versus <140 mmHg (8.8% vs. 2.7%, P < 0.001), and those with a DBP ≥90 versus <90 (7.0% vs. 3.1%, P = 0.011) (Table 3).
DISCUSSION
This study represents the first investigation into the burden of diabetes among adult patients with TB, HIV, and TB–HIV co-infection in Uganda, using laboratory-based RBS and HbA1c measurements. Our findings reveal a notably higher prevalence of diabetes (Figure) in this population compared to previous studies in the region, with particularly elevated rates among those with TB–HIV co-infection. We observed that the burden of diabetes among patients with TB–HIV co-infection is 1.9 and 3.5 times higher than in those with TB and HIV alone, respectively. This heightened burden may reflect demographic differences compared to other studies, such as one from India, where a lower prevalence of diabetes among TB–HIV co-infected patients was reported, potentially due to a younger, predominantly male study population.^15^
Participants’ flow diagram. DM = diabetes mellitus; HbA1C = haemoglobin A1C; RBG = random blood glucose.
Age was a significant factor across all disease statuses, with older patients showing a higher prevalence of diabetes. This aligns with findings from other African studies, including a systematic review by Kibirige et al.,^16^ which highlighted that diabetes is more common among older TB patients.^17^ Gender differences were also significant, particularly among HIV-positive patients, where males had a higher prevalence of diabetes than females. These findings are consistent with studies conducted outside Africa^18^ but differ from some African studies^10,19,20^ that reported a higher prevalence of diabetes among females. This discrepancy might be due to the demographic composition of our study population, which had a higher proportion of females and a more balanced age distribution. Waist circumference was significantly associated with diabetes among TB patients, with those having central obesity exhibiting a higher prevalence of diabetes. This finding supports similar studies^18,21,22^ that link central obesity to diabetes in TB patients. However, some cross-sectional studies^23^ did not find significant differences in diabetes prevalence between those with normal and central obesity waist circumferences, possibly due to demographic variations, such as a higher proportion of males.
Current TB treatment was strongly associated with an increased prevalence of diabetes. Patients undergoing TB treatment had a higher prevalence of diabetes compared to those not on treatment. This could be attributed to the metabolic effects of anti-TB medications, or the physiological stress induced by active TB infection, as observed in other studies.^24,25^ The interplay between TB treatment and glucose metabolism is complex and warrants further investigation to better understand this association.
Systolic BP and diastolic BP were both significantly associated with the prevalence of diabetes among those with HIV. Patients with elevated BP were more likely to have diabetes, consistent with the established link between hypertension and diabetes.^26,27^ This association is particularly concerning in the context of TB–HIV co-infection, where managing multiple comorbidities adds complexity to patient care. Our findings emphasise the need for regular BP monitoring and management as part of comprehensive care for patients with TB, HIV, and diabetes.
Our study also found that patients on ART regimens other than DTG had a higher prevalence of diabetes compared to those on DTG-based regimens. This is consistent with previous studies linking older nucleoside reverse transcriptase inhibitors, such as stavudine, zidovudine, or didanosine, to an increased risk of diabetes.^28–31^ However, some studies have reported conflicting results, suggesting an association between DTG-based regimens and prevalent diabetes,^32,33^ indicating the need for further research to clarify these relationships and inform clinical decision-making.
Strengths of this study include that it was conducted in urban health facilities renowned for their well-established HIV clinics, which cater to a diverse population of over 20,000 PLHIV. The substantial patient base of these centres enabled the collection of rich data from a diverse group of patients who were actively engaged in ongoing HIV treatment and care programs. This setting provided a unique opportunity to assess the burden of diabetes in a well-defined cohort, enhancing the study’s relevance and applicability to similar urban HIV care settings.
One significant limitation was the modest sample size of the study, which limited the ability to model and assess factors associated with diabetes across different disease states with sufficient statistical power. Additionally, the cross-sectional design introduced constraints in establishing causality, particularly for risk factors not previously documented in the literature. Consequently, any interpretations of temporal relationships and causative conclusions must be approached with caution. Furthermore, the study was confined to outpatient clinics, excluding inpatients who may have had a higher prevalence of comorbid conditions. This exclusion may have introduced a selection bias, as patients with more severe comorbidities might have been referred to specialised care facilities, thereby affecting the generalisability of our findings to the broader population of individuals living with HIV.
CONCLUSION
We found a higher prevalence of diabetes among patients with TB, HIV, and TB–HIV co-infection, which underscores the need for integrated management strategies that address the complex interplay of these conditions. Regular screening for diabetes and careful management of hypertension and obesity are essential components of care for these patients. It is evident that individuals living with HIV are at a higher risk of developing diabetes and TB, and vice versa, due to shared risk factors and the immunosuppressive effects of these conditions. Therefore, a multidisciplinary approach is needed that addresses the social determinants of health, improves access to health care services, and promotes patient education. Further research is needed to explore the mechanisms underlying these associations and develop tailored interventions to improve patient outcomes. Collaboration between health care providers, policymakers, and community organisations is essential to develop and implement strategies for prevention, early detection, and management of these comorbidities in Ugandan adults.
The reference list from the paper itself. Each links out to its DOI / PubMed record.
- 1Hogg R, Life expectancy of individuals on combination antiretroviral therapy in high-income countries: a collaborative analysis of 14 cohort studies. Lancet. 2008;372(9635):293-299.18657708 10.1016/S 0140-6736(08)61113-7PMC 3130543 · doi ↗ · pubmed ↗
- 2Wada N, Cause-specific life expectancies after 35 years of age for human immunodeficiency syndrome-infected and human immunodeficiency syndrome-negative individuals followed simultaneously in long-term cohort studies, 1984-2008. Am J Epidemiol. 2013;177(2):116-125.23287403 10.1093/aje/kws 321PMC 3590031 · doi ↗ · pubmed ↗
- 3World Health Organization. Noncommunicable Diseases. Geneva: WHO, 2023.
- 4World Health Organization. UN supporting Uganda to Halt the rise of noncommunicable diseases. Geneva: WHO, 2019.
- 5Ario AR, Uganda Public Health Fellowship Program’s contributions to the National HIV and TB Programs, 2015-2020. Glob Health Sci Pract. 2022;10(2):e 2100574.35487554 10.9745/GHSP-D-21-00574 PMC 9053155 · doi ↗ · pubmed ↗
- 6Quin J. Diabetes and HIV. Clin Med (Lond). 2014;14(6):667-669.25468855 10.7861/clinmedicine.14-6-667PMC 4954142 · doi ↗ · pubmed ↗
- 7Yorke E, The bidirectional relationship between tuberculosis and diabetes. Tuberc Res Treat. 2017;2017:1702578.29270319 10.1155/2017/1702578 PMC 5705893 · doi ↗ · pubmed ↗
- 8Riza AL, Clinical management of concurrent diabetes and tuberculosis and the implications for patient services. Lancet Diabetes Endocrinol. 2014;2(9):740-753.25194887 10.1016/S 2213-8587(14)70110-XPMC 4852378 · doi ↗ · pubmed ↗