Impact of structural and interpersonal racism on oral health and dental services
Rafaela de Oliveira Cunha, Isabel Cristina Gonçalves Leite, Mário Círio Nogueira, Rafaela de Oliveira Cunha, Isabel Cristina Gonçalves Leite, Mário Círio Nogueira

TL;DR
This study shows that racism affects oral health and access to dental services through structural and interpersonal pathways, particularly impacting Black and brown individuals.
Contribution
The paper introduces a novel analysis of how structural and interpersonal racism specifically influence oral health outcomes and dental service access among racialized groups.
Findings
Black and brown individuals had higher prevalence of negative self-perception, tooth loss, and poor access to dental services.
Racial discrimination was strongly associated with lack of access and negative evaluations of dental care.
Living in neighborhoods with fewer social and physical problems reduced negative oral health outcomes and poor access to services.
Abstract
To analyze the role of racism in oral health and access to dental services, considering two impact pathways: structural racism and interpersonal racism. A cross-sectional study with 686 undergraduate students, which analyzed two categories of outcomes: those related to oral health (self-perception, oral health impairment, and tooth loss) and those related to access to/perception of the quality of dental services (access to services, recent use, and evaluation of care). Exposures were race/color, racial discrimination, and characterization of the neighborhood environment. Prevalence ratios were estimated using Poisson regression with robust variance, with adjustments guided by directed acyclic diagrams. Black and brown people had a higher prevalence of negative self-perception (black: PR = 1.56; 95%CI 1.14–2.13; brown: PR = 1.53; 95%CI 1.14–2.05), tooth loss (black: PR = 1.99; 95%CI…
Genes, proteins, chemicals, diseases, species, mutations and cell lines named across the full text — each resolved to its canonical identifier and authoritative record.
Click any figure to enlarge with its caption.
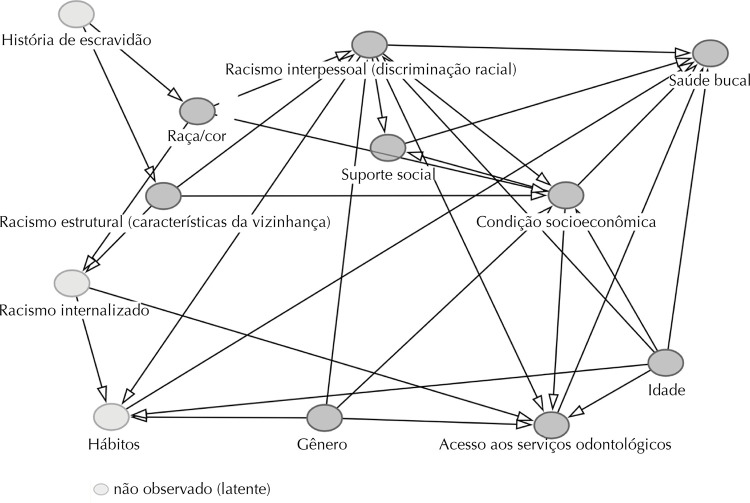 Figure 1
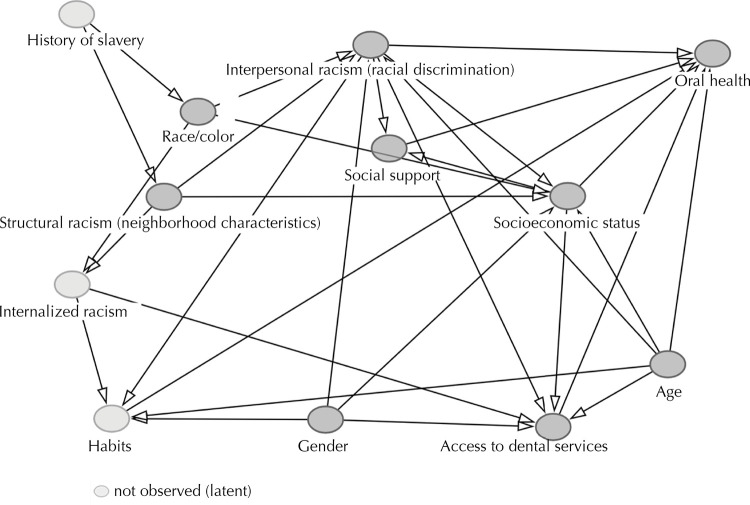 Figure 2
- —Universidade Federal de Juiz de Fora
Peer Reviews
No public reviews on file for this paper yet. If you reviewed it on a platform where reviews are public (OpenReview, ICLR, NeurIPS, ICML), you can paste yours below so the community can read it here.
Videos
No videos yet. Explain this paper in a talk, walkthrough, or lecture? Add one.
Taxonomy
TopicsCultural Competency in Health Care · Racial and Ethnic Identity Research · Dental Health and Care Utilization
INTRODUCTION
Racial inequities in oral health are widely documented, with evidence indicating that individuals from racialized groups face greater barriers to access and quality of dental care, as well as having a higher prevalence of conditions such as caries, periodontal disease, and tooth loss^ 1,2 ^. The literature has highlighted the importance of understanding race as a social construct and investigating racism as a fundamental cause of these inequities^ 3,4 ^.
Racism, as a complex social system, operates on multiple levels. At the structural level, it is expressed in the historical and institutional organization of society, through policies, norms, practices, and institutional arrangements that produce and reproduce racial hierarchies, conditioning unequal access to resources, opportunities, and rights. At the interpersonal level, it manifests itself in discriminatory attitudes and behaviors that directly affect racialized individuals, perpetuating experiences of exclusion and subordination^ 5 ^. This system impacts health through a number of ways, including: (I) economic injustice and social segregation, which generate precarious living conditions; (II) unequal exposure to adverse physical and social environments; and (III) psychosocial trauma resulting from interpersonal discrimination, with effects on mental, behavioral, and physical health^ 6 ^. Thus, place of residence and life experiences are closely linked to the state of health of individuals^ 3 ^.
Despite the consistent evidence on racial inequities in oral health, the role of racism in producing these inequities remains underexplored. Most studies adopt descriptive approaches based solely on self-identified race, which restricts understanding of the mechanisms by which racism influences oral health outcomes^ 3 ^. Research that goes beyond this perspective and examines the ways in which racism influences oral health and access to services is essential to guide public policies aimed at equity.
In this context, this study aimed to investigate the impact of racism on oral health and access to dental services, considering two dimensions of this system: interpersonal racism, measured by the experience of self-reported racial discrimination, and structural racism, represented by the characteristics of the neighborhood environment, which express residential segregation, socio-spatial inequality, and the historical concentration of disadvantages. Understanding these relationships helps to identify the mechanisms that produce racial inequalities in oral health and provide subsidies for more equitable public policies and intervention strategies.
METHODS
Design, Study Population, and Ethical Aspects
A cross-sectional study was carried out with undergraduate students enrolled in 2023 at the Universidade Federal de Juiz de Fora (UFJF), a public institution based in Juiz de Fora (MG) and an advanced campus in Governador Valadares (MG). All students aged 18 or over were eligible, and those who did not respond to the survey questionnaire after three attempts to contact them were considered to have lost the sample.
The choice of the university population is based on the racial, socioeconomic, and territorial diversity present in the academic environment, which favors the analysis of racial inequities in a plural institutional context. Although still marked by inequalities, the university space has become more heterogeneous with the implementation of affirmative actions. This scenario makes it possible to investigate the persistence of racial inequalities even in contexts of higher education, as well as highlighting the effects of racism on trajectories marked by different social exposures and opportunities.
In 2023, UFJF had 15,361 students enrolled in face-to-face undergraduate courses, 87.6% of them on the Juiz de Fora campus. Of these, 59.4% declared themselves white, 27.5% brown, 10.7% black, and 2.4% yellow, indigenous, or of another race/color. The sample size was calculated for finite populations, estimating a minimum of 347 participants, based on an expected prevalence of racial discrimination of 9%^ 7 ^, a 95% confidence interval and a sampling error of 5%.
The study was approved by the UFJF Human Research Ethics Committee (opinion no. 6.041.263).
Data Collection
Data was collected using an online questionnaire, prepared on the Google Forms platform and sent to the students by institutional e-mail. The instrument contained 54 questions, organized into four blocks: Block I - Demographic and socioeconomic data; Block II - Oral health; Block III - Neighborhood Perception Scale^ 8 ^; Block IV - Abbreviated Explicit Discrimination Scale (EDS)^ 9 ^.
The Neighborhood Perception Scale, validated in Brazil, evaluates the perception of the environment considering physical and social disorders, with a score from 0 to 32, with higher values indicating greater problems in the neighborhood^ 8 ^. The abbreviated EDS is a validated instrument that measures the experience of explicit discrimination in the Brazilian context. Its abbreviated version, considered suitable for undergraduate students^ 9 ^, measures experiences of discrimination in eight everyday situations, with scores ranging from 0 to 24, with higher values indicating greater perceived discrimination.
Variables
This study adopted an analytical strategy aimed at articulating different dimensions of racism. The characterization of the neighborhood environment was used as a proxy for structural racism, considering that territorial inequalities express the historical and institutional materialization of racial hierarchies in the urban space^ 6 ^. Self-reported discrimination was considered a measure of interpersonal racism, reflecting the direct experiences of differentiated treatment and prejudice experienced by individuals in everyday interactions^ 9 ^. This operationalization made it possible to simultaneously capture different levels of racism (structural and interpersonal) and analyze its effects on oral health outcomes and access to dental services.
Thus, the independent variables included: race/color, racial discrimination, and neighborhood characterization.
The race/color variable was obtained according to the participants’ self-declaration, based on the Instituto Brasileiro de Geografia e Estatística (IBGE — Brazilian Institute of Geography and Statistics) classification: white, black, brown, yellow, and indigenous. Racial discrimination was measured using the abbreviated version of the EDS, dichotomized as “yes” or “no”. Individuals who reported at least one episode of unequal treatment based on race/color and interpreted it as discriminatory were considered discriminated against. Neighborhood characterization was measured using the Neighborhood Perception Scale and dichotomized into “fewer physical and social problems” (lower tertile) and “more physical and social problems” (middle and upper tertiles)^ 10 ^. Considering that many students migrate from one city to another to attend university, the neighborhood where the participant had lived for most of their life or for at least five years was considered, to capture long-term experiences that influenced their life opportunities.
Two categories of outcomes were analyzed: outcomes related to oral health (self-perceived oral health, oral health impairment, and tooth loss) and outcomes related to access to and perceived quality of dental services (access to dental services, recent use of dental services, and evaluation of care).
Self-perception of oral health was classified as positive or negative, according to the respondent’s own assessment. Oral health impairment was identified by the presence of at least one of the following conditions: toothache, discomfort with oral appearance, or eating difficulties, with the answers “very often”, “often”, or “sometimes” being considered indicative of impairment^ 11 ^. Tooth loss was defined by the report of extraction of at least one permanent tooth, categorized as “yes” or “no”.
The variables related to access to and perception of the quality of dental services were based on the Projeto SB Brasil 2020 (2020 OH Brazil Project) questionnaire. Access was classified as “access” for the answers “sought and was scheduled” or “was attended to”; and “lack of access” for the answer “was not attended to”. Recent use of dental services was defined as having seen a dentist in the last year, while recent non-use included cases where the last visit was more than a year ago or when the individual had never been to the dentist. The evaluation of dental care was categorized as “positive” or “negative”.
The covariates included age, gender, marital status, family income, maternal schooling, paid work, type of high school, receipt of student aid, and subject area.
Statistical Analysis
The analyses were carried out using R software (version 4.2.1). Initially, a descriptive analysis was carried out. Poisson regression with robust variance was used to estimate prevalence ratios. This approach is recommended in cross-sectional studies with binary outcomes, as it provides more accurate estimates of prevalence ratios^ 12 ^. Confidence intervals of 95% (95%CI) were adopted.
The variables included in the adjusted models were selected based on directed acyclic diagrams (DAGs), built in the DAGitty program, according to theoretical assumptions and empirical evidence from the literature^ 4 ^. The DAGs were built from an adaptation of the model proposed by Howe et al.^ 4 ^, which originally addressed different health outcomes (health behaviors, body mass index – BMI, and physical conditions). For this study, conceptual and analytical adaptations were made for the context of oral health and access to dental services, allowing specific causal relationships to be represented for these outcomes. Latent variables were incorporated to capture unobservable factors with a possible causal influence. Contextual variables relating to the provision of services (which can influence access and oral health) were not included in the diagrams due to the unavailability of these data in the study population.
The fits of the Poisson regression models were assessed for the presence of overdispersion (when the variance is greater than the mean, identified by the dispersion statistic > 1.2), the presence of multicollinearity (by the VIF statistic > 5, “variance inflation factor”) and the distribution of Pearson and Deviance residuals without major deviations (within the range of -0.5 +0.5).
The Figure shows the DAG with the study’s exposures, outcomes and covariates.
FigureCausal diagram of the relationships between exposures, outcomes and study covariates.
RESULTS
The study included 686 undergraduate students. The yellow and indigenous categories were excluded from the analysis due to their low representativeness (one indigenous and no yellow). The age distribution was 17.9% between 18 and 20 years old, 51.9% between 21 and 24 years old, and 30.2% aged 25 or over. The majority were female (67.9%) and had a monthly family income of up to three minimum wages (47.7%). As for race/color, 58.2% declared themselves white, 23.2% brown and 18.6% black.
Table 1 shows the characteristics of the study population, stratified by race/color. There was a higher proportion of black and brown individuals in the lower family income categories compared to white (p < 0.001). The frequency of enrollment in public high schools was also significantly higher among black and brown people (p < 0.001). Black and brown individuals reported a higher frequency of living in neighborhoods with more physical and social problems, compared to white (p < 0.001). And the prevalence of reported racial discrimination was also higher among black individuals (p < 0.001).
Table 1. Characteristics of the study population: total distribution and by race/color, in absolute values and percentages (n = 686).VariableTotalRace/colorp valueWhiteBrownBlackn%n%n%n%Gender 0.283Cisgender female46667.926156.011624.98919.1 Cisgender male18927.611862.43518.53619.0 Transgender, agender, or non-binary314.52064.5825.839.7 Age 0.097Less than 20 years old12317.97258.53226.01915.4 Between 20 and 24 years old35651.922162.17119.96418.0 Over 25 years old20730.210651.25627.14521.7 Marital status 0.073With spouse7611.13647.42532.91519.7 No spouse61088.936359.513422.011318.5 Monthly family income < 0.001From 0 to 3 minimum wages32747.714243.48826.99729.7 Between 3 and 5 minimum wages15823.010868.43522.2159.5 5 minimum wages or more20129.314974.13617.9168.0 Maternal schooling < 0.001Up to complete elementary school16924.67544.45532.53923.1 Incomplete or complete high school22332.512053.84922.05424.2 Incomplete higher education or more29442.920469.45518.73511.9 Work 0.246No50173.030160.111122.28917.8 Yes18527.09853.04825.93921.1 Type of secondary school < 0.001Private28241.121576.24014.2279.6 Public40458.918445.511929.510125.0 Admission to UFJF by racial quotas < 0.001No53277.639975.08916.7448.3 Yes15422.4007045.58454.5 Student aid < 0.001No55480.834361.912622.78515.3 Yes13219.25642.43325.04332.6 Area of knowledge of the course 0.556Health and Biological Sciences24135.114158.55522.84518.7 Exact Sciences and Engineering9113.36065.91718.71415.4 Humanities and Social Sciences35451.619855.98724.66919.5 Experience of racial discrimination No43663.635681.77216.581.8< 0.001Yes25036.44317.28734.812048.0 Neighborhood characterization < 0.001More problems30945.015349.58527.57123.0 Fewer problems37755.024665.37419.65715.1 UFJF: Universidade Federal de Juiz de Fora.
Among the students who reported interpersonal discrimination, 92.3% attributed the unequal treatment to multiple reasons, the most cited being the way they dressed, socioeconomic status and race/color. Specifically regarding racial discrimination, 36.4% reported this experience. The most frequent occurrences included: inferior treatment in commercial establishments (21.0%), being mistaken for an employee (17.1%) and verbal insults (18.1%). Discrimination was also reported in educational institutions (12.1%), in emotional relationships (10.9%), in the neighborhood (7.4%), in public offices (6.7%), and in the family (6.9%).
Table 2 shows the oral health outcomes and access to dental services. Oral health was compromised in 57.3% of the participants; 25.7% reported negative self-perception and 16.5% tooth loss. As for access, 3.9% reported a lack of access; 69.0% had used dental services in the last year, and 17.3% gave a negative assessment of the care they received.
Table 2. Prevalence of oral health outcomes and access to dental services: total distribution and by race/color (n = 686).OutcomeTotalRace/ColorWhiteBrownBlackn% (95%CI)n% (95%CI)n% (95%CI)n% (95%CI)Oral health Negative self-perception of oral health17625.7 (22.4–29.0)8120.3 (16.4–24.2)5232.7 (25.4–40.0)4333.6 (25.4–41.8)Compromised oral health39357.3 (53.6–61.0)22556.4 (51.5–61.3)9257.9 (50.3–65.5)7659.4 (51.0–67.8)Tooth loss11316.5 (13.8–19.2)5012.5 (9.2–15.8)3018.9 (12.8–25.0)3325.8 (18.2–33.4)Access to dental services Lack of access to dental services273.9 (2.5–5.3)71.8 (0.4–3.2)127.5 (3.4–11.6)86.3 (2.2–10.4)No recent use of dental services21331.0 (27.5–34.5)11428.6 (24.1–33.1)5232.7 (25.4–40.0)4736.7 (28.3–45.1)Negative evaluation of dental care11917.3 (14.6–20.0)5213.0 (9.7–16.3)3723.3 (16.6–30.0)3023.4 (16.1–30.7)95%CI: 95% confidence interval.
Table 3 shows the prevalence ratios (PR) between exposure variables and oral health-related outcomes. After adjusting for confounders indicated by the DAG, race/color remained associated (p < 0.05) with negative self-perception of oral health (PR = 1.56; 95%CI 1.14–2.13 for black and PR = 1.53; 95%CI 1.14–2.05 for brown individuals) and tooth loss (PR = 1.99; 95%CI 1.33–2.97 for black individuals). Experiencing racial discrimination was associated with worse oral health outcomes only in the crude analysis, with an association with negative self-perception of oral health (PR = 1.49; 95%CI 1.16–1.91) and tooth loss (PR = 1.78; 95%CI 1.27–2.48). Finally, living in areas with fewer physical and social problems was a protective factor for negative self-perception (PR = 0.70; 95%CI 0.54–0.90) and oral health impairment (PR = 0.87; 95%CI 0.76–0.99), even after adjusting for confounding factors (p < 0.05).
Table 3. Prevalence ratios of oral health-related outcomes by race/color, experience of racial discrimination and neighborhood characterization (n = 686).VariableNegative self-perception of oral healthCompromised oral healthTooth lossCrude PR (95%CI)Adjusted PR (95%CI)Crude PR (95%CI)Adjusted PR (95%CI)Crude PR (95%CI)Adjusted PR (95%CI)Race/color White111111Brown1.61 (1.20–2.17)1.53 (1.14–2.05)1.03 (0.88–1.20)1 (0.86–1.18)1.51 (1.00–2.28)1.46 (0.96–2.23)Black1.65 (1.21–2.26)1.56 (1.14–2.13)1.05 (0.89–1.24)1.03 (0.87–1.22)2.06 (1.39–3.04)1.99 (1.33–2.97)Racial discrimination^b^ No111111Yes1.49 (1.16–1.91)1.07 (0.77–1.47)1.08 (0.94–1.23)1.05 (0.87–1.25)1.78 (1.27–2.48)1.18 (0.78–1.79)Neighborhood characterization^c^ More problems111111Fewer problems0.65 (0.50–0.84)0.70 (0.54–0.90)0.87 (0.76–0.99)0.87 (0.76–0.99)0.75 (0.54–1.05)0.82 (0.58–1.16)PR: prevalence ratio; 95%CI: 95% confidence interval; DAG: directed acyclic diagrams. ^a^Prevalence ratio adjusted for race by neighborhood characterization, according to DAG. ^b^Prevalence ratio adjusted for racial discrimination by gender, age, neighborhood characterization, and race/color, according to DAG. ^c^Prevalence ratio adjusted for neighborhood characterization by race/color, according to DAG.Note: the Poisson regression model adjustments were assessed for the presence of overdispersion (dispersion statistic > 1.2), multicollinearity (VIF > 5) and the distribution of Pearson and Deviance residuals, which remained close to zero, indicating a good model fit.
Table 4 shows the associations with the outcomes of access and perceived quality of dental services. In the adjusted analysis, race/color remained associated (p < 0.05) with lack of access and negative evaluation of care. Black (PR = 3.08; 95%CI 1.06–8.95) and brown (PR = 3.78; 95%CI 1.49–9.59) individuals had a higher prevalence of lack of access and negative evaluation of the care received (black: PR = 1.63; 95%CI 1.08–2.45; brown: PR = 1.64; 95%CI 1.12–2.39). The experience of racial discrimination was associated with lack of access (PR = 4.34; 95%CI 1.45–12.95), lack of recent use of services (PR = 1.74; 95%CI 1.31–2.31), and negative evaluation of care (PR = 1.51; 95%CI 1.01–2.25) (p < 0.05). And living in neighborhoods with fewer problems was a protective factor for both lack of access (PR = 0.42; 95%CI 0.18–0.98) and negative evaluation of care (PR = 0.56; 95%CI 0.40–0.79) (p < 0.05). It should be noted that some of the associations observed, especially between lack of access to dental services, race/color, and racial discrimination, although statistically significant, had wide confidence intervals, indicating less precision in the estimates. This imprecision is mainly due to the low prevalence of the outcome in the population studied, which reduces the number of events and increases the uncertainty of the effect measures. Even so, the consistency of the direction of the associations reinforces the presence of racial inequalities in access to services, even in the face of sampling and statistical limitations.
Table 4. Prevalence ratios of outcomes related to access to dental services by race/color, experience of racial discrimination and neighborhood characterization (n = 686).VariableLack of access to dental servicesLack of recent use of dental servicesNegative evaluation of dental careCrude PR (95% CI)Adjusted PR (95%CI)Crude PR (95%CI)Adjusted PR (95%CI)Crude PR (95%CI)Adjusted PR (95%CI)Race/color White111111Brown4.30 (1.72–10.7)3.78 (1.49–9.59)1.14 (0.87–1.50)1.14 (0.87–1.50)1.79 (1.22–2.61)1.64 (1.12–2.39)Black3.56 (1.32–9.63)3.08 (1.06–8.95)1.29 (0.98–1.69)1.28 (0.97–1.69)1.80 (1.20–2.69)1.63 (1.08–2.45)Racial discrimination^b^ No111111Yes6.1 (2.50–14.92)4.34 (1.45–12.95)1.54 (1.24–1.92)1.74 (1.31–2.31)1.96 (1.42–2.71)1.51 (1.01–2.25)Neighborhood characterization^c^ More problems111111Fewer problems0.35 (0.15–0.78)0.42 (0.18–0.98)0.96 (0.77–1.2)0.99 (0.79–1.24)0.52 (0.37–0.72)0.56 (0.40–0.79)PR: prevalence ratio; 95%CI: 95% confidence interval; DAG: directed acyclic diagrams. ^a^Prevalence ratio adjusted for race by neighborhood characterization, according to DAG. ^b^Prevalence ratio adjusted for racial discrimination by gender, age, neighborhood characterization, and race/color, according to DAG. ^c^Prevalence ratio adjusted for neighborhood characterization by race/color, according to DAG.Note: the fits of the Poisson regression models were assessed for the presence of overdispersion (dispersion statistic > 1.2), multicollinearity (VIF > 5) and the distribution of Pearson and Deviance residuals, which remained close to zero, indicating a good fit of the model.
DISCUSSION
The findings of this study confirm significant racial inequalities in oral health and access to dental services, with racism operating interpersonally and structurally in its production. It was observed that individuals who declared themselves black had a higher prevalence of negative self-perception of oral health, tooth loss, lack of access to dental services, and negative evaluation of care, compared to whites. Among brown individuals, there was a higher prevalence of negative self-perception of oral health, lack of access to dental services, and negative evaluation of care, also compared to whites.
Being a part of historically marginalized racial groups exposes individuals to higher levels of interpersonal discrimination and adverse social contexts, both of which have an impact on health^ 4 ^. In this study, racial discrimination was associated with oral outcomes only in the crude analysis, losing significance after adjustment, a result that is in line with the heterogeneity observed in the literature. While studies such as those by Celeste et al.^ 13 ^ and Finlayson et al.^ 14 ^ found no significant associations, other studies, such as those by McGlumphy et al.^ 15 ^, Cozier et al.^ 16 ^ and Raskin et al.^ 17 ^, identified a positive relationship between experiences of racial discrimination and worse oral health outcomes, such as negative self-perception and tooth loss. These effects can be mediated by psychological suffering and the adoption of unhealthy behaviors, such as smoking, alcohol abuse, and excessive sugar intake, as well as restrictions on access to educational, employment and housing opportunities, which increase exposure to environmental risks and limit the use of dental services^ 18 ^.
This study also contributes to understanding the effects of racial discrimination on access to dental services. There was an association between experiences of discrimination, less use of services, and negative evaluations of care, in line with previous studies^ 17,19 ^. Discrimination can affect users’ perceptions of the health system, impair interactions with professionals and compromise both access to and quality of care. Discriminatory situations in clinical settings tend to generate feelings of alienation, reinforce paternalistic or coercive practices, and impose cultural and communication barriers, which fuels distrust in the system, reduces adherence to treatment, and contributes to dissatisfaction and the persistence of unmet needs^ 19 ^.
It is important to note that such attitudes do not occur in isolation but reflect social structures that sustain racism. Beyond individual behaviors, racism is rooted in the political and economic organization of society, operating as a social norm reproduced by historically established power structures^ 3 ^. The literature recognizes structural racism as the central determinant of racial inequities in health^ 6 ^. In this sense, understanding these inequities requires attention to the historical and contextual conditions that sustain them, among which residential segregation stands out as a fundamental mechanism of structural racism^ 20 ^.
In Brazil, although residential segregation is not instituted by formal racial segregation policies, it is widely manifested through the exclusion of black populations from the central and more developed areas of cities^ 20 ^. Thus, racialized populations, often in situations of socioeconomic vulnerability, tend to live in areas marked by a lack of resources, such as healthy food, quality education, and employment opportunities, and face greater obstacles in accessing adequate health services^ 21 ^.
Thus, the neighborhood environment is a relevant marker for understanding the effects of structural racism on health. Individuals living in the same neighborhood share physical, social, and institutional conditions that affect their health, in addition to their individual characteristics^ 22 ^. In the study of structural racism, the spatial concentration of health behaviors and outcomes in hyperlocal areas reflects the context of the neighborhood, which is strongly influenced by racial segregation and the institutional practices that have historically organized urban space along racial lines^ 23 ^. Mohottige et al.^ 24 ^ showed that indicators of structural racism at the neighborhood level, such as racial segregation and socioeconomic deprivation, were associated with a higher prevalence of chronic diseases, including diabetes, hypertension, and chronic kidney disease, reinforcing the role of the neighborhood as a concrete expression of structural racism.
The findings of this study confirm that living in areas with better physical and social conditions acts as a protective factor for negative oral health outcomes, such as negative self-perception and oral health impairment, as well as for barriers to accessing dental services, including lack of access and negative evaluation of care, even after adjusting for race/color. The literature argues that living in disadvantaged areas is often associated with an imbalance between protective and risk factors for health. These areas tend to have less available dental services, poor infrastructure, and an overload of risk factors for oral diseases, creating a scenario of vulnerability that compromises the quality of life of their residents^ 25,26 ^. The shortage of professionals and care units, coupled with financial, institutional, and cultural barriers, hinders access to quality preventive and curative care. Furthermore, the lack of effective public policies aimed at the equitable distribution of health services exacerbates these inequities, reinforcing racial and socioeconomic inequities in access to dental care^ 25,27 ^. These impacts are intensified by exposure to environmental and behavioral risk factors, such as diets rich in sugars, limited health education, and the prevalence of harmful habits such as smoking and excessive alcohol consumption, which also contribute to an increased risk of oral diseases^ 26 ^.
Therefore, the neighborhood must be understood not only as a living context, but as a concrete expression of historically reproduced structural inequalities that shape opportunities, resources and health conditions^ 22 ^. By reflecting racial segregation and the unequal organization of urban space, the neighborhood environment acts as a fundamental mediator of inequities in oral health and access to dental services between different racial groups.
Furthermore, it must also be recognized that racism does not act in isolation but intertwines with other forms of oppression to shape oral health and access to dental services^ 3 ^. The intersectional perspective allows us to understand these complex interactions, highlighting how multiple axes of oppression combine to impact historically marginalized groups^ 11 ^. Studies emphasize that racism, sexism, classism, and other systems of marginalization are interconnected, co-constituting each other and being central to racial and non-racial inequities in health^ 11,28 ^. Thus, individuals marginalized in multiple axes of oppression often have less power, less control over their environments, reduced ability to avoid oppressive contexts and fewer resources to deal with oppression, factors that together may explain the negative health effects observed in some groups^ 11 ^. This understanding reinforces the urgency of public policies and interventions that understand and tackle the multiple forms of oppression, promoting oral health equity.
Some limitations of this study should be considered. As it is based on self-reported outcomes, there is a risk of response and memory bias, which could compromise the accuracy of the information reported. The use of a non-probabilistic sample limits the generalization of the findings to the university population as a whole. And the cross-sectional design prevents the inference of direct causal relationships. Despite this, the study makes relevant contributions by highlighting the effects of interpersonal and structural racism on oral health and access to dental services. By considering two important impact pathways of racism, the study broadens the understanding of the determinants that sustain racial inequities in this field.
The findings show that structural and interpersonal racism hinder access to quality dental care for marginalized racial groups and contribute to worsening oral health conditions. Overcoming these inequities requires a comprehensive approach aimed at transforming the social and economic conditions that perpetuate them. This includes formulating and implementing public policies that combat discriminatory practices, tackle spatial segregation, promote healthy neighborhood environments, and guarantee an equitable supply of quality dental services, with special attention to historically excluded populations. Only through structural changes will it be possible to mitigate racial inequalities in oral health and move towards a fairer and more equitable society.
The reference list from the paper itself. Each links out to its DOI / PubMed record.
- 1Herkrath FJ Vettore MV Werneck GL Contextual and individual factors associated with dental services utilisation by Brazilian adults: A multilevel analysis P Lo S One 2018132 e 019277110.1371/journal.pone.019277129420660 PMC 5805334 · doi ↗ · pubmed ↗
- 2Reis LAO Miranda SS Fonseca BR Pereira M Natividade MS Aragão E et al Associação entre iniquidades raciais e condição de saúde bucal: revisão sistemática Cien Saude Colet 2024293 e 0488202310.1590/1413-81232024293.0488202338451644 · doi ↗ · pubmed ↗
- 3Bastos JL Constante HM Celeste RK Haag DG Jamieson LM Advancing racial equity in oral health (research): more of the same is not enough Eur J Oral Sci 2020128645946610.1111/eos.1273732969112 · doi ↗ · pubmed ↗
- 4Howe CJ Bailey ZD Raifman JR Jackson JW Recommendations for using causal diagrams to study racial health disparities Am J Epidemiol 2022191121981198910.1093/aje/kwac 14035916384 PMC 10144617 · doi ↗ · pubmed ↗
- 5Alston PSA Fontenot FY Moran RC Stronger together. Diverse dentists weigh in on racism and its impact on oral health in our communities J Public Health Dent 202282 Suppl 1121510.1111/jphd.1250035170755 PMC 9544433 · doi ↗ · pubmed ↗
- 6Bailey ZD Krieger N Agénor M Graves J Linos N Bassett M Structural racism and health inequities in the USA: evidence and interventions Lancet 2017389100771453146310.1016/S 0140-6736(17)30569-X 28402827 · doi ↗ · pubmed ↗
- 7Bastos JL Celeste RK Silva DAS Priest N Paradies YC Assessing mediators between discrimination, health behaviours and physical health outcomes: a representative cross-sectional study Soc Psychiatry Psychiatr Epidemiol 201550111731174210.1007/s 00127-015-1108-026264154 · doi ↗ · pubmed ↗
- 8Höfelmann DA Diez-Roux AV Antunes JL Peres MA Perceived neighborhood problems: multilevel analysis to evaluate psychometric properties in a Southern adult Brazilian population BMC Public Health 201313108511010.1186/1471-2458-13-108524256619 PMC 4225501 · doi ↗ · pubmed ↗