Surveillance for Ixodes scapularis and Ixodes pacificus ticks and their associated pathogens in Canada, 2021
Safa Ahmad, Gamal Wafy, Christy Wilson, Heather Coatsworth, Camille Guillot, Jade Savage, Patrick Leighton, Priya Goundar, Muhammad Morshed, Peter Buck, Annie-Claude Bourgeois, Salima Gasmi

TL;DR
This paper reports on tick surveillance in Canada in 2021, tracking Ixodes ticks and the pathogens they carry to support public health efforts.
Contribution
The study provides updated data on tick populations and infection rates of tick-borne pathogens across Canada in 2021.
Findings
Most ticks collected were adult females, primarily from human hosts in spring or fall.
Borrelia burgdorferi was the most common pathogen detected in ticks.
Active surveillance revealed infections with multiple tick-borne pathogens, including Babesia and Anaplasma.
Abstract
Ixodes scapularis and Ixodes pacificus ticks pose risk of infection with tick-borne diseases in Eastern and Pacific Western Canada, respectively. In 2021, passive and active tick surveillance programs collected ticks and associated data elements, including location, infection and other characteristics, to monitor their populations and inform public health prevention and mitigation activities. Surveillance data for ticks were compiled from the National Microbiology Laboratory (Public Health Agency of Canada), provincial public health, Canadian Lyme Disease Research Network and eTick (an image-based online platform). A descriptive analysis of tick records and infection prevalence of tick-borne pathogens is presented. Seasonal trends are described. During 2021, 6,892 I. scapularis ticks were identified across all ten provinces via passive surveillance with 777 I. pacificus ticks…
Genes, proteins, chemicals, diseases, species, mutations and cell lines named across the full text — each resolved to its canonical identifier and authoritative record.
Click any figure to enlarge with its caption.
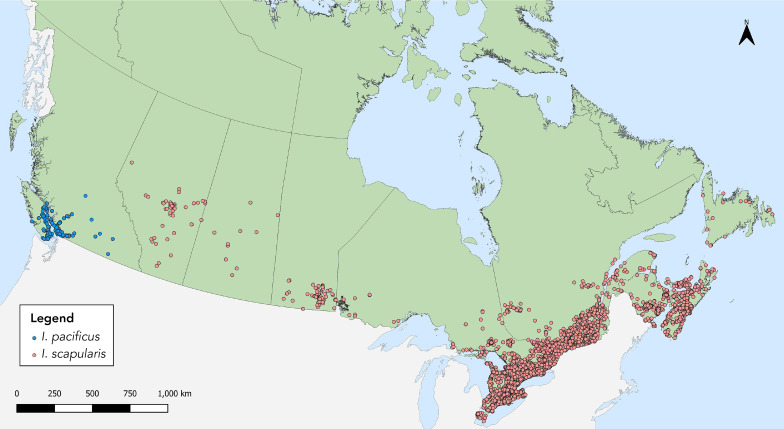 Figure 1
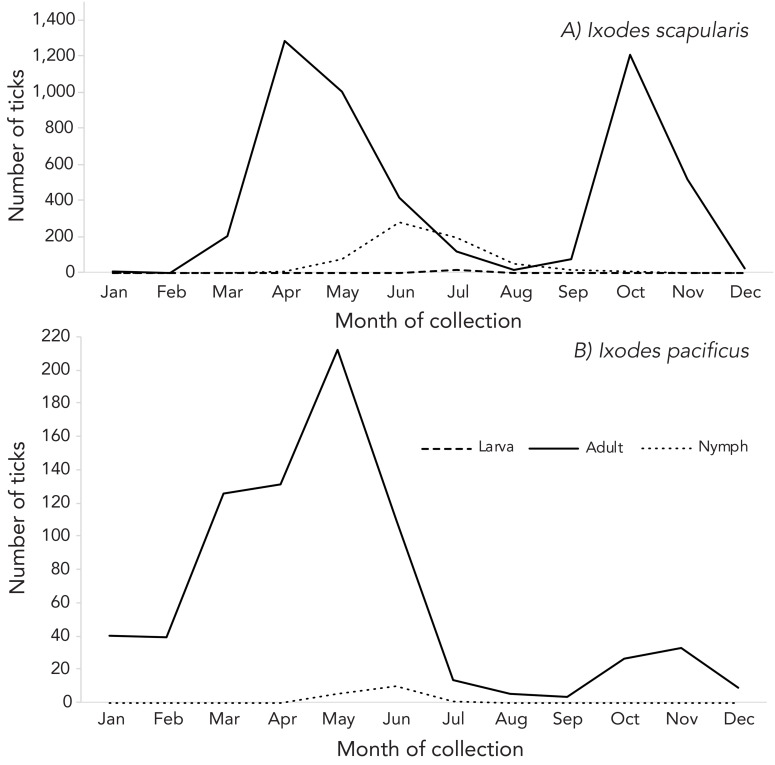 Figure 2
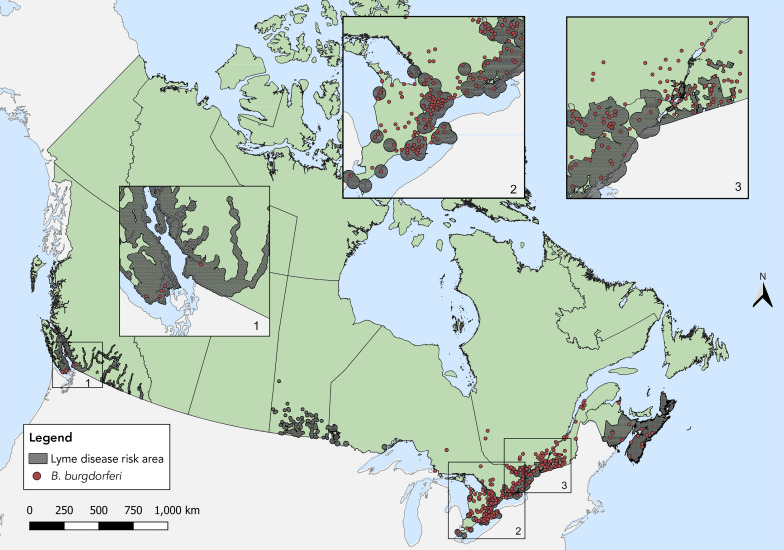 Figure 3
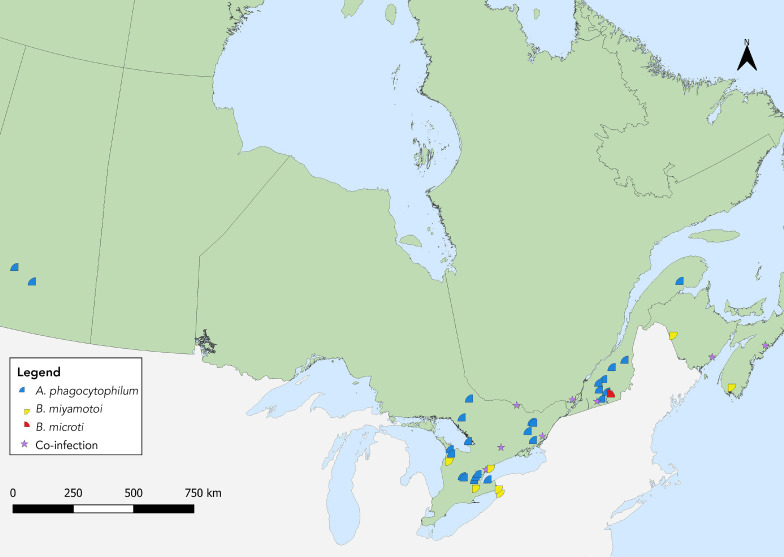 Figure 4
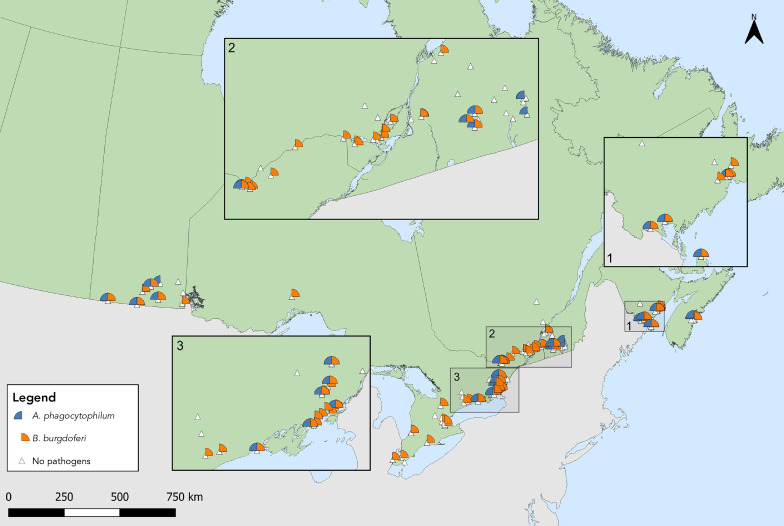 Figure 5
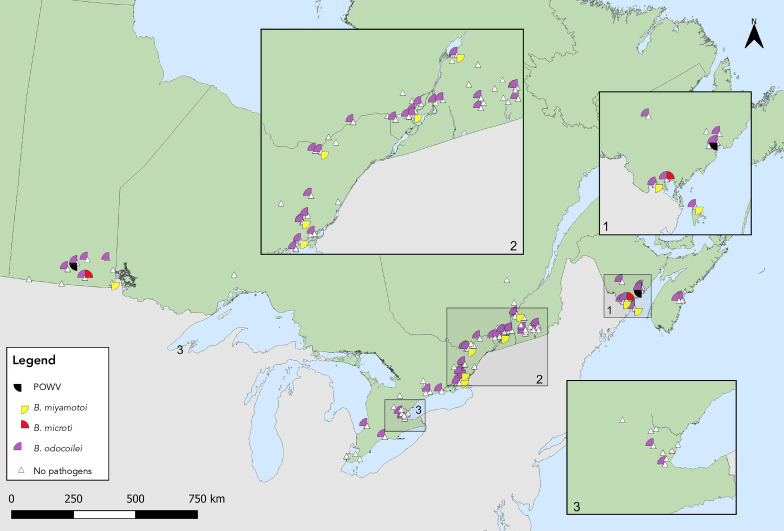 Figure 6
| Province | Tick species | Type of surveillance | Type of submissionb | ||||
|---|---|---|---|---|---|---|---|
|
|
| Total | Sample-based | Image-basedc | Single submissions | Multiple submissions | |
| British Columbiad | 777 | 2 | 779 | 696 | 83 | 743 | 12 |
| Alberta | 0 | 78 | 78 | 16 | 62 | 63 | 1 |
| Saskatchewan | 0 | 15 | 15 | 9 | 6 | 13 | 1 |
| Manitobad | 0 | 90 | 90 | 5 | 85 | 90 | 0 |
| Ontarioe | 0 | 4,415 | 4,415 | 1,973 | 2,442 | 4,365 | 23 |
| Québece | 0 | 1,377 | 1,377 | 659 | 718 | 1,356 | 9 |
| Newfoundland and Labrador | 0 | 18 | 18 | 0 | 18 | 18 | 0 |
| New Brunswick | 0 | 214 | 214 | 69 | 145 | 214 | 0 |
| Nova Scotiae | 0 | 610 | 610 | 32 | 578 | 602 | 4 |
| Prince Edward Island | 0 | 73 | 73 | 0 | 73 | 73 | 0 |
| Total | 777 | 6,892 | 7,669 | 3,459 | 4,210 | 7,537 | 50 |
| Characteristics | Tick species | |||
|---|---|---|---|---|
|
|
| |||
| n | % | n | % | |
|
| ||||
| Larva | 0 | 0 | 24 | 0.46 |
| Nymph | 16 | 2.09 | 284 | 5.48 |
| Adult female | 735 | 96.20 | 4,501 | 86.84 |
| Adult male | 13 | 1.70 | 374 | 7.22 |
| Total | 764 | 100 | 5,183 | 100 |
|
| ||||
| Engorged | 77 | 11.10 | 1,144 | 41.80 |
| Unfed | 617 | 88.90 | 1,593 | 58.20 |
| Total | 694 | 100 | 2,737 | 100 |
|
| ||||
| Human | 711 | 91.50 | 4,809 | 69.81 |
| Dog | 49 | 6.31 | 1,670 | 24.24 |
| Cat | 1 | 0.13 | 271 | 3.93 |
| Otherc | 16 | 2.06 | 139 | 2.02 |
| Total | 777 | 100 | 6,889 | 100 |
| Pathogen | Infection prevalence | ||
|---|---|---|---|
|
|
| ||
|
|
| ||
|
| 1.13 | 0.78–1.57 | |
|
| 0.04 | 0.00–0.18 | |
|
| 18.60 | 17.18–20.09 | |
|
| 0.36 | 0.19–0.65 | |
| Total single agent | 19.79 | 18.33–21.31 | |
|
|
| ||
|
|
| ||
| 0 | 0/2,655 | ||
| 0.30 | 8/2,664 | ||
| 0.04 | 1/2,655 | ||
| 0 | 0/2,655 | ||
| 0 | 0/2,655 | ||
| 0.08 | 3/2,655 | ||
| Total co-infectedc | 0.38 | 10/2,664 | |
| Province | Infection prevalence | |||||||
|---|---|---|---|---|---|---|---|---|
|
|
|
|
| |||||
| % | 95% CI | % | 95% CI | % | 95% CI | % | 95% CI | |
|
| ||||||||
| British Columbia | N/A | N/A | N/A | N/A | 0.73 | 0.31–1.70 | N/A | N/A |
|
| ||||||||
| Alberta | 0 | 0–19.36 | 0 | 0–19.36 | 0 | 0–19.36 | 0 | 0–19.36 |
| Saskatchewan | 22.22 | 6.32–54.74 | N/A | N/A | 0.00 | 0.00–29.91 | N/A | N/A |
| Ontario | 0.86 | 0.52–1.35 | 0 | 0–0.19 | 19.20 | 17.50–20.99 | 0.30 | 0.12–0.63 |
| Québec | 1.67 | 0.88–2.88 | 0.15 | 0.01–0.73 | 17.72 | 14.94–20.80 | 0.30 | 0.05–0.99 |
| New Brunswick | 1.45 | 0.26–7.76 | 0 | 0–5.27 | 11.59 | 5.99–21.25 | 1.45 | 0.26–7.76 |
| Nova Scotia | 6.23 | 1.14–18.77 | 0 | 0–10.72 | 28.55 | 15.14–45.71 | 3.16 | 0.18–14.45 |
| Total | 1.13 | 0.78–1.57 | 0.04 | 0–0.18 | 18.60 | 17.18–20.09 | 0.36 | 0.19–0.65 |
| Province | Infection prevalence | ||||||||||||
|---|---|---|---|---|---|---|---|---|---|---|---|---|---|
|
|
|
|
|
| Powassan virus | ||||||||
| Proportion of positive ticksc | % | Proportion of positive ticksc | % | Proportion of positive ticksc | % | Proportion of positive ticksc | % | Proportion of positive ticksc | % | Proportion of positive ticksc | % | ||
| Manitoba | 6/119 | 5.04 | 1/119 | 0.84 | 6/119 | 5.04 | 36/119 | 30.25 | 1/119 | 0 | 1/119 | 0.84 | |
| Ontario | 36/834 | 4.32 | 0/641 | 0.00 | 60/641 | 9.36 | 247/843 | 29.30 | 4/648 | 0.62 | 0/641 | 0.00 | |
| Québec | 7/391 | 1.79 | 0/391 | 0.00 | 57/391 | 14.58 | 62/391 | 15.86 | 2/391 | 0.51 | 0/391 | 0.00 | |
| New Brunswick | 29/475 | 6.11 | 1/475 | 0.21 | 64/475 | 13.47 | 68/475 | 14.32 | 5/475 | 1.05 | 1/475 | 0.21 | |
| Nova Scotia | 5/98 | 5.10 | 0/98 | 0.00 | 16/98 | 16.33 | 17/98 | 17.35 | 0/98 | 0 | 0/98 | 0.00 | |
| Total | 83/1917 | 4.33 | 2/1724 | 0.12 | 203/1724 | 11.7 | 430/1926 | 22.33 | 12/1733 | 0.69 | 2/1724 | 0.12 | |
Peer Reviews
No public reviews on file for this paper yet. If you reviewed it on a platform where reviews are public (OpenReview, ICLR, NeurIPS, ICML), you can paste yours below so the community can read it here.
Videos
No videos yet. Explain this paper in a talk, walkthrough, or lecture? Add one.
Taxonomy
TopicsVector-borne infectious diseases · Vector-Borne Animal Diseases · Zoonotic diseases and public health
Introduction
Ixodes scapularis and Ixodes pacificus ticks are known to transmit several bacterial, viral and protozoan pathogens to humans in Eastern/Central and Western Canada, respectively. They are doing so in increasing population numbers and across a broader geographical range due to climate and environmental changes ((1–5)). The resulting increase in potential for tick-borne diseases in the country, especially in Southern Central and Eastern Canada, has been emphasized in previous reports and in research literature and requires ongoing surveillance so prevention efforts can be successful ((1,6–8)). Case numbers of Lyme disease reported in Canada in 2022 have increased more than sevenfold since 2012 ((9)). Additional tick-borne diseases transmitted by I. scapularis or I. pacificus, namely, anaplasmosis, babesiosis and Powassan virus disease, are nationally notifiable diseases in Canada as of early 2024 ((10–13)).
Although tick surveillance has been conducted in Canada since the 1990s, data started to be summarized annually at the national-level by the Centre for Food-borne, Environmental and Zoonotic Infectious Diseases, Public Health Agency of Canada (PHAC) in 2019, and provide a baseline for tick-borne disease risk that, over time, will help to identify trends ((14)).
The objective of this annual surveillance report is to update the summary of characteristics of the main Lyme disease vectors in Canada, I. scapularis and I. pacificus, collected through passive and active surveillance during 2021. This article also summarizes the prevalence and spatial distribution of their associated pathogens.
Methods
Data sources
This report uses two types of surveillance data from more than 20 different providers. Passive surveillance datasets were provided by the National Microbiology Laboratory (NML) branch of PHAC, British Columbia Centre for Disease Control, Saskatchewan Ministry of Health and eTick. Active surveillance datasets were provided by the Canadian Lyme Disease Research Network, 12 Ontario health units, Laboratoire de santé publique du Québec, University of Manitoba, Manitoba Health, Seniors and Long-Term Care Department, New Brunswick Department of Health, University of New Brunswick and University of Ottawa.
Passive tick surveillance: As in 2020, this analysis was limited to I. scapularis and I. pacificus collected in Canada in the pertinent year ((6)). Provinces with five or fewer ticks of a given species submitted for species identification and laboratory testing were excluded to avoid misinterpretation of results. Ticks with a location of acquisition outside of the province of submission were not geocoded.
Additional regional passive tick surveillance programs have been discontinued since the publication of the previous report due to laboratory capacity constraints and as I. scapularis populations have become established. As before, ticks (or their images) acquired in these jurisdictions could be submitted by the public directly to NML or eTick.
eTick is a web-based, community-science project inviting the public to help with population tick monitoring and is used as a passive surveillance system for ticks in Canada ((15)). Individuals submit images of ticks they encounter online or via the mobile application, which are then examined by trained personnel to identify the species. Only one tick can be submitted in a single image-based submission.
Ticks collected and submitted from Alberta, Manitoba, Ontario, Québec, New Brunswick and Nova Scotia and tested for Anaplasma phagocytophilum, Borrelia burgdorferi, Borrelia miyamotoi and Babesia microti at the NML using methods previously described were included in this report ((16,17)). Among ticks tested by the British Columbia Centre for Disease Control, only results for B. burgdorferi were included in this report. Additional details regarding methodology are available in the previously published annual report ((6)).
Active tick surveillance: In active surveillance, ticks are collected from the environment using drag sampling or capturing host mammals that are then examined for ticks. This analysis used data from efforts to collect ticks from 10 sites in British Columbia, six in Alberta, at least eight in Saskatchewan, nine sites in Manitoba, more than 60 in Ontario, 36 in Québec, 14 sites in New Brunswick and 10 in Nova Scotia. Drag sampling took place in late spring/summer (May–July) and fall (September–November). Ticks were tested for some or all of the following pathogens: A. phagocytophilum; B. microti; B. odocoilei; B. burgdorferi; B. miyamotoi and Powassan virus.
Analysis
Tick characteristics: For passive surveillance, descriptive statistics were calculated for submission type (sample-based or image-based), tick species, province of acquisition, stage (larva, nymph, adult female or adult male), level of engorgement (unfed or engorged), host (human, dog, cat or other) and month of collection. For active surveillance, descriptive statistics were calculated for province of collection and stage (larva, nymph, adult female or adult male). All data were cleaned and analysed in R (version 4.0.2).
Ticks submitted through passive surveillance that were acquired in Canada and not associated with a travel history to other provinces or countries were mapped using QGIS software (version 3.34.7) based on their location of acquisition. Ticks submitted with a record of history of travel in the previous 14 days within the same province as the locality of acquisition were geocoded to the submitter-provided location of exposure during travel. In active surveillance, the site location of tick dragging was geocoded from data obtained from the NML and mapped for all data.
Infection prevalence: To account for pooled testing of ticks collected by passive surveillance from some jurisdictions, maximum likelihood estimates of prevalence were calculated with 95% confidence intervals (CI) using the PooledInfRate R package (version 1.6) ((18,19)). This estimates the probability of infection for an individual tick in the population using the results of testing of the pooled samples (i.e., a group of one or more ticks submitted and tested together). The package was developed by the United States’ Centers for Disease Control and Prevention ((19)). Co-infection prevalence was calculated among single submissions only to ascertain true co-infections, that is, two or more pathogens in a single tick. Where ticks were not tested in pools, prevalence was the number of positive ticks divided by the number of ticks tested.
Results
Passive surveillance tick characteristics
In 2021, 7,669 I. scapularis (n=6,892) and I. pacificus (n=777) ticks were submitted by provinces across Canada, with at least 14 submissions per province (Table 1, Figure 1). Image-based submissions comprised 54.9% of ticks submitted (n=4,210) and the remainder were sample-based submissions (n=3,459). Ticks from Ontario, Québec and Nova Scotia comprised 83.5% of all ticks submitted. The majority (98.3%) of ticks were from single submissions.
Ixodes pacificus and Ixodes scapularis ticks submitted through passive tick surveillance, Canada, 2021aa Each dot represents a probable location of acquisition for a single or multiple submission of I. scapularis (n=6,832 submissions) or I. pacificus (n=755 submissions) made via passive surveillance programs
Tick stage, level of engorgement and host were available for 98.2%, 89.3% and 100% of I. pacificus records and for 80.3%, 40.0% and 99.9% of I. scapularis records, respectively (data not shown in table). Ticks submitted only via eTick did not include information about engorgement. The majority of ticks submitted in sample-based submissions were adult female ticks (I. pacificus: 96.2%; I. scapularis: 86.8%) (Table 2).
A larger proportion of I. scapularis were engorged upon submission than I. pacificus (41.8% vs 11.1%, respectively) (Table 2). Most I. pacificus submissions were obtained from human hosts (91.4%) while a majority of I. scapularis were obtained from human and dog hosts (69.8% and 24.2%, respectively).
Records including both month of acquisition and tick stage made up 98.2% of I. pacificus and 80.2% of I. scapularis submissions (Figure 2). All submissions missing tick stage information were image-based submissions, comprising 32.6% of those submissions (n=1,374/4,210).
Number of Ixodes pacificus and Ixodes scapularis ticks submitted through passive surveillance, by month and tick stage, Canada, 2021a,ba Data are presented for I. pacificus (n=764) and I. scapularis (n=5,529) ticks submitted through passive surveillanceb No ticks were reported from the Yukon, Northwest Territories or Nunavut for I. scapularis or I. pacificus. Passive tick surveillance has been discontinued in the entire province of Nova Scotia and some regions of Ontario and Québec; however, individuals could submit ticks directly to the National Microbiology Laboratory or through eTick from these jurisdictions
Adult I. scapularis submissions, comprising 80.2% of total I. scapularis submitted through passive surveillance, peaked in April and again in October and nymph submissions, comprising 11.4%, peaked in June. For adult I. pacificus, submissions peaked in May with a subsequent marginal peak in November.
Infection prevalence in passive surveillance
Data on laboratory testing was available for 98.6% of I. pacificus and 99.4%–99.8% of I. scapularis from sample-based submissions, depending on pathogen. Nearly one in five I. scapularis ticks in Canada is estimated to be infected with at least one tick-borne pathogen (A. phagocytophilum, B. burgdorferi, B. miyamotoi or B. microti) (95% CI: 18.3%–21.3%). The most prevalent pathogen was B. burgdorferi, detected in 18.6% of I. scapularis (95% CI: 17.2%–20.1%). Anaplasma phagocytophilum was detected in 1.1% of I. scapularis (95% CI: 0.8%–1.6%). Other tick-borne pathogens were estimated to have a prevalence of fewer than 1% each (0.04% positive for B. microti (95% CI: 0.00%–0.18%) and 0.4% positive for B. miyamotoi (95% CI: 0.2%–0.7%) (Table 3).
Among 684 I. pacificus ticks, 0.9% indicated presence of B. burgdorferi (95% CI: 0.4%–1.8%) (Table 4). Co-infections in I. scapularis ticks were also estimated to have a prevalence of fewer than 1.0% each (Table 3).
Ticks infected with tick-borne pathogens were primarily found in Southern and Eastern Ontario, Southern Québec, New Brunswick and in Nova Scotia (Figure 3, Figure 4). Of the seven provinces where sample-based submissions were included in our analysis, B. burgdorferi-infected tick specimens were found in five: British Columbia, Ontario, Québec, New Brunswick and Nova Scotia (Table 4).
Ixodes scapularis and Ixodes pacificus ticks submitted through passive surveillance infected with Borrelia burgdorferi, Canada, 2021a,ba Each dot represents the probable location of acquisition of at least one I. scapularis (n=510) or I. pacificus (n=5) submitted through passive surveillance that was infected with B. burgdorferi. The inlays zoom in on regions in British Columbia (Inlay 1) and parts of Ontario (Inlay 2) and Ontario and Québec (Inlay 3) where these ticks were foundb Lyme disease risk areas are identified by the provinces as of 2021 using the methods described in the 2016 national Lyme disease case definition ((20)). On the map, risk areas are identified as hatched grey areas
Ixodes scapularis ticks with associated pathogens (Anaplasma phagocytophilum, Borrelia miyamotoi, Babesia microti) and co-infections collected through passive surveillance, Canada, 2021aa Each symbol represents the probable location of acquisition of an I. scapularis single or multiple tick submission submitted through passive surveillance that tested positive for A. phagocytophilum (n=33), B. microti (n=1), B. miyamotoi (n=11) or a coinfection. Coinfections were limited to only single submissions of ticks and include A. phagocytophilum + B. burgdorferi (n=7), B. burgdorferi + B. miyamotoi (n=2) and one triple coinfection including all three pathogens, all in I. scapularis
Anaplasma phagocytophilum was found in I. scapularis in all provinces where ticks were tested except Alberta; B. burgdorferi in all except Alberta and Saskatchewan (infection prevalence of 1.1% and 18.6%, respectively) (Figure 3, Figure 4, Table 4). Borrelia miyamotoi was found in Ontario, Québec, New Brunswick and Nova Scotia, while a single Babesia microti-infected tick was found in Québec.
Active surveillance tick characteristics
In 2021, I. scapularis (n=1,935) were collected and tested from five provinces: New Brunswick (n=475), Ontario (n=850), Québec (n=393), Manitoba (n=119) and Nova Scotia (n=98). Of these, the majority of specimens were adults and nymphs followed by larvae (14; 0.7%). In addition, 18 I. pacificus were collected in British Columbia.
Infection prevalence in active surveillance
Laboratory testing results for at least one pathogen were available for 99.5% of I. scapularis. The most prevalent pathogen was B. burgdorferi, present in all five provinces where I. scapularis were collected through active surveillance: Manitoba, Ontario, Québec, New Brunswick and Nova Scotia (Table 5). Borrelia burgdorferi was detected in 22.3% of ticks tested, compared to 29.3% in 2020 ((6)).
Babesia odocoilei- and A. phagocytophilum-infected I. scapularis ticks were found in the same five provinces, with overall prevalences of 11.8% and 4.3%, respectively (Table 5, Figure 5, Figure 6). The overall infection prevalence of the remaining pathogens was less than 1.0% in I. scapularis: Twelve B. miyamotoi-positive ticks were collected from Manitoba (n=1), Ontario (n=4), Québec (n=2) and New Brunswick (n=5) (Table 5, Figure 6). Babesia microti-positive ticks (n=2) and Powassan virus positive ticks (n=2) were found in Manitoba and New Brunswick (Table 5, Figure 6). Among 18 I. pacificus ticks collected from six sites in British Columbia, no pathogens were detected.
Ixodes scapularis ticks with associated pathogens (Anaplasma phagocytophilum and Borrelia burgdorferi) collected through active surveillance, Canada, 2021a,ba Each symbol represents an active surveillance site where A. phagocytophilum (n=83) or B. burgdorferi (n=430) were found in I. scapularis ticks. Sites were mapped based on best available information and do not represent precise locations of tick acquisition. The inlays zoom in on regions in New Brunswick (Inlay 1), Québec and Ontario (Inlay 2) and Ontario (Inlay 3) where these ticks were found close togetherb No pathogens were found among 18 I. pacificus ticks tested from six sites in British Columbia. Map has been zoomed-in for better visibility of tick-borne pathogen distribution
Ixodes scapularis ticks with associated pathogens (Powassan virus, Borrelia miyamotoi, Babesia microti and Babesia odocoilei) collected through active surveillance, Canada, 2021a,bAbbreviation: POWV, Powassan virusa Each symbol represents an active surveillance site where POWV (n=2), B. miyamotoi (n=12), B. microti (n=2) or B. odocoilei (n=203) were found in I. scapularis ticks. Sites were mapped based on best available information and do not represent precise locations of tick acquisition. The inlays zoom in on regions in New Brunswick (Inlay 1), Québec and Ontario (Inlay 2) and Ontario (Inlay 3) where these ticks were found close togetherb No pathogen was found among 18 I. pacificus ticks tested from six sites in British Columbia. Map has been zoomed-in for better visibility of tick-borne pathogen distribution
Discussion
This report provides an update on the national epidemiology of I. scapularis and I. pacificus ticks, previously published in 2019 and in 2020 ((6,16)). In 2021, there were 6,892 I. scapularis and 777 I. pacificus submitted in passive surveillance from ten provinces.
In active surveillance, 1,929 I. scapularis and 18 I. pacificus were collected in six provinces: British Columbia; Manitoba; Ontario; Québec; New Brunswick; and Nova Scotia. Testing identified the presence of A. phagocytophilum, B. burgdorferi, B. miyamotoi, B. microti, B. odocoilei and Powassan virus in I. scapularis.
Through passive surveillance, 3,459 ticks were sample-based submissions, 41% fewer than the 5,899 ticks submitted as samples in 2020 ((6)). This is likely a result of the discontinuation of passive surveillance programs. As noted in the 2020 tick surveillance report, this could also be due to the continuing effects of COVID-19 pandemic restrictions on traditional passive surveillance, as health units, medical and veterinary clinics could accept fewer physical tick specimens. During 2021, 54% of all passive surveillance data were from eTick, compared to 29% in the previous year ((6)). Active surveillance was also affected by pandemic restrictions, as in-person activities such as field surveillance were limited in Prince Edward Island and Newfoundland and Labrador.
Ticks submitted through passive surveillance followed distinct species-specific temporal patterns ((6)). The bimodal peaks for I. scapularis adults observed between May and November were consistent with those seen historically in Central and Eastern Canada ((21–23)) and for I. pacificus as observed in the past in British Columbia ((16)) and the Western United States ((24)).
However, tick stage development appears to be occurring earlier in the tick season than observed in previous years. There also seems to be a prolongation of the tick season, with individuals reporting tick exposure throughout the year in passive surveillance data. Thus, the overall risk of tick-borne diseases is increasing due to the temporal and spatial expansion of tick activity, though this will also depend on tick infection prevalence in a given area and individual use of preventative measures. These trends should be monitored in the coming years to determine if the shift in tick submissions is due to weather or other factors, or if it reflects selection bias from current surveillance methods.
The proportion of ticks submitted from dogs or cats continued to increase, almost doubling from 15.1% in 2020 to 26.0% in 2021 ((6)). Like 2020, this is in part due to the inclusion of data from eTick, which does not have any host-based restrictions. The inclusion of eTick data may also have contributed to a shift in the distribution of the life stage of ticks collected; for example, nearly three times the number of nymphs were collected in passive surveillance during 2021 compared with 2020 ((6)).
The national estimates for prevalence for each pathogen through passive surveillance, except B. miyamotoi in I. scapularis, were slightly higher than the results for 2020 ((6)). Borrelia burgdorferi was detected in 18.6% of I. scapularis compared to 17.2% in 2020, A. phagocytophilum in 1.1% compared to 0.9%, B. microti in 0.04% compared to 0.02% and B. miyamotoi in 0.4% compared to 0.5% in 2020 ((6)). Among I. pacificus ticks, 0.9% were positive for B. burgdorferi compared to none in 2020.
For active surveillance, infection prevalence results were similar to those obtained in 2020 for all pathogens except B. burgdorferi, which was less prevalent in 2021 in Ontario, Québec and New Brunswick ((6)). This may be partially explained by the larger total tick numbers collected during 2021; 3.5 times for Québec and 6.5 times for Ontario in 2021 versus 2020 ((6)). Other factors that influence infection prevalence estimates from year-to-year or between provinces include variation in sites selected and their ecological and host-related characteristics ((25)).
Our results also include the infection prevalence of B. odocoilei, indicating a prevalence close to 15% in samples tested from each of Québec, New Brunswick and Nova Scotia. It was also present in other provinces where it was tested for, namely, Manitoba and Ontario.
Strengths and limitations
While several traditional passive surveillance programs have been phased out, incorporating data from eTick allows us to continue monitoring the geographic presence of these vectors across the country. Combining passive and active surveillance information allows the strengths and weaknesses of the systems to complement each other. While active surveillance is limited in geographic and temporal scope, passive surveillance programs are not limited to specific site locations so data can be gathered from large areas throughout the year.
As noted in 2020, COVID-19 pandemic restrictions affected public health surveillance efforts in 2021. Second, tick specimens collected from eTick, though useful for consistent geographic surveillance, are not routinely requested for tick-borne pathogen testing ((15)). Recall bias in reporting travel history and other variables in passive surveillance might create uncertainty. For active surveillance, it is likely that other programs were conducted in 2021 that did not submit ticks for pathogen testing at NML and were not included in this summary.
Conclusion
Despite data limitations and resource constraints, efforts in tick surveillance over time have permitted the identification of increasing prevalence and emergence of tick-borne disease pathogens in Canada. Healthcare professionals and the public should be reminded that there is a risk of exposure to infected ticks outside of Lyme disease at-risk areas, even if the risk is low in those areas. Tick surveillance data are an important source of information for public health authorities as they endeavour to identify risk areas, target prevention and education efforts.
The reference list from the paper itself. Each links out to its DOI / PubMed record.
- 1Bouchard C, Dibernardo A, Koffi J, Wood H, Leighton PA, Lindsay LR. N Increased risk of tick-borne diseases with climate and environmental changes. Can Commun Dis Rep 2019;45(4):83–9. 10.14745/ccdr.v 45i 04a 0231285697 PMC 6587693 · doi ↗ · pubmed ↗
- 2Robinson EL, Jardine CM, Koffi JK, Russell C, Lindsay LR, Dibernardo A, Clow KM. Range expansion of Ixodes scapularis and Borrelia burgdorferi in Ontario, Canada, from 2017 to 2019. Vector Borne Zoonotic Dis 2022;22(7):361–9. 10.1089/vbz.2022.001535727121 · doi ↗ · pubmed ↗
- 3Ogden NH, Koffi JK, Pelcat Y, Lindsay LR. Environmental risk from Lyme disease in central and eastern Canada: a summary of recent surveillance information. Can Commun Dis Rep 2014;40(5):74–82. 10.14745/ccdr.v 40i 05a 0129769885 PMC 5864485 · doi ↗ · pubmed ↗
- 4Ogden NH, Mechai S, Margos G. Changing geographic ranges of ticks and tick-borne pathogens: drivers, mechanisms and consequences for pathogen diversity. Front Cell Infect Microbiol 2013;3:46. 10.3389/fcimb.2013.0004624010124 PMC 3756306 · doi ↗ · pubmed ↗
- 5Ogden NH, Radojević M, Wu X, Duvvuri VR, Leighton PA, Wu J. Estimated effects of projected climate change on the basic reproductive number of the Lyme disease vector Ixodes scapularis. Environ Health Perspect 2014;122(6):631–8. 10.1289/ehp.130779924627295 PMC 4050516 · doi ↗ · pubmed ↗
- 6Wilson C, Gasmi S, Bourgeois AC, Badcock J, Carr J, Chahil N, Coatsworth H, Dibernardo A, Goundar P, Leighton P, Lee MK, Morshed M, Ripoche M, Savage J, Smadi H, Smolarchuk C, Thivierge K, Koffi JK; e Tick, Hanan Smadi 3, Christa Smolarchuk 12, Karine Thivierge 13,14, Jules Koffi 2. Surveillance for Ixodes scapularis and Ixodes pacificus ticks and their associated pathogens in Canada, 2020. Can Commun Dis Rep 2023;49(6):288–98. 10.14745/ccdr.v 49i 06a 0638444700 PMC 10914093 · doi ↗ · pubmed ↗
- 7Ogden NH, Ben Beard C, Ginsberg HS, Tsao JI. Possible effects of climate change on Ixodid ticks and the pathogens they transmit: predictions and observations. J Med Entomol 2021;58(4):1536–45. 10.1093/jme/tjaa 22033112403 PMC 9620468 · doi ↗ · pubmed ↗
- 8Gasmi S, Ogden NH, Leighton PA, Adam-Poupart A, Milord F, Lindsay LR, Barkati S, Thivierge K. Practices of Lyme disease diagnosis and treatment by general practitioners in Quebec, 2008-2015. BMC Fam Pract 2017;18(1):65. 10.1186/s 12875-017-0636-y 28532428 PMC 5441092 · doi ↗ · pubmed ↗