Association between trajectories of sleep quality and postpartum depression: a group-based trajectory model and computer-simulated network analysis
Xiaoxiao Mei, Jinzhou Yu, Qianru Liu, Yan Li, Shuhan Li, Qianwen Chen, Hongman Li, Ying Xiong, Ranran Mei, Zengjie Ye

TL;DR
This study shows how different patterns of sleep quality during pregnancy and after childbirth are linked to postpartum depression, with specific symptoms varying between groups.
Contribution
The study introduces a novel combination of trajectory modeling and network analysis to identify distinct sleep quality patterns and their associated depressive symptoms.
Findings
Two sleep quality trajectories were identified: 'increasingly poor' and 'stably good', with the former linked to higher postpartum depression rates.
Specific depressive symptoms were found to be core or alleviating within each sleep quality trajectory.
Tailored mental health interventions are needed due to the heterogeneous associations between sleep quality and postpartum depression.
Abstract
Sleep quality during pregnancy and the postpartum period is increasingly acknowledged as a critical influencing factor of postpartum. However, the complexities of this relationship, particularly the core depressive symptoms across varying sleep quality trajectories, remain poorly understood. This study included 372 participants from the “Be Resilient to Postpartum Depression” cohort, with data collected at four intervals spanning early pregnancy to 42 days after childbirth. Validated instruments were used to evaluate both sleep quality and postpartum depression. Data analysis employed group-based trajectory modeling and computer-simulated network analysis. Two distinct trajectories of sleep quality were identified: “increasingly poor” trajectory (41.4%), which exhibited a markedly higher rate of postpartum depression (OR = 2.75, P < 0.001), and “stably good” trajectory (58.6%). Within…
Genes, proteins, chemicals, diseases, species, mutations and cell lines named across the full text — each resolved to its canonical identifier and authoritative record.
Click any figure to enlarge with its caption.
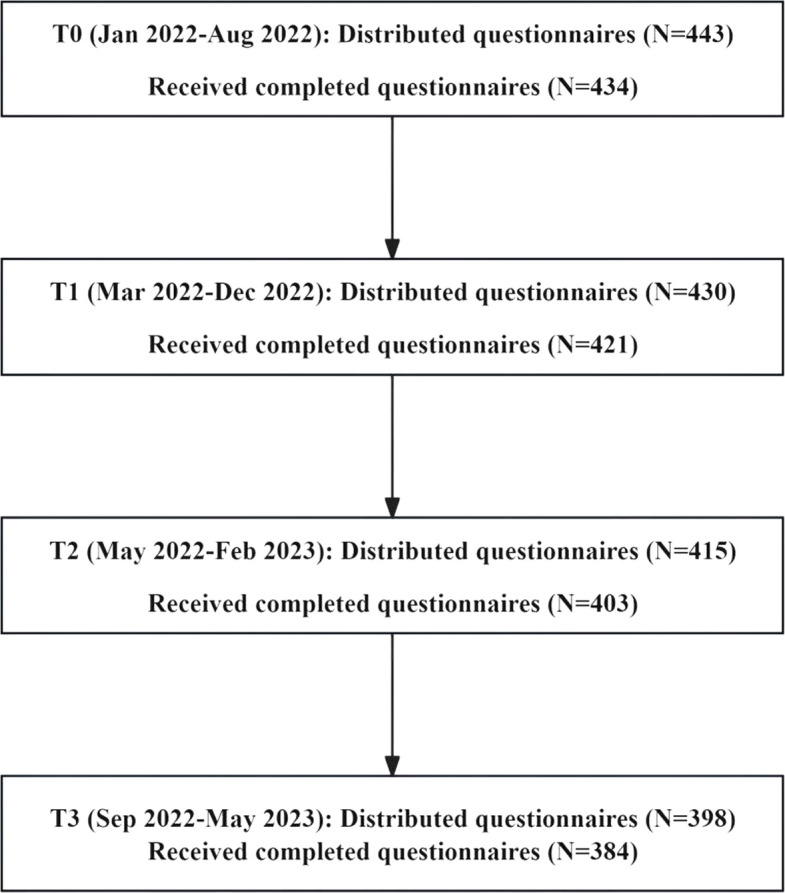 Figure 1
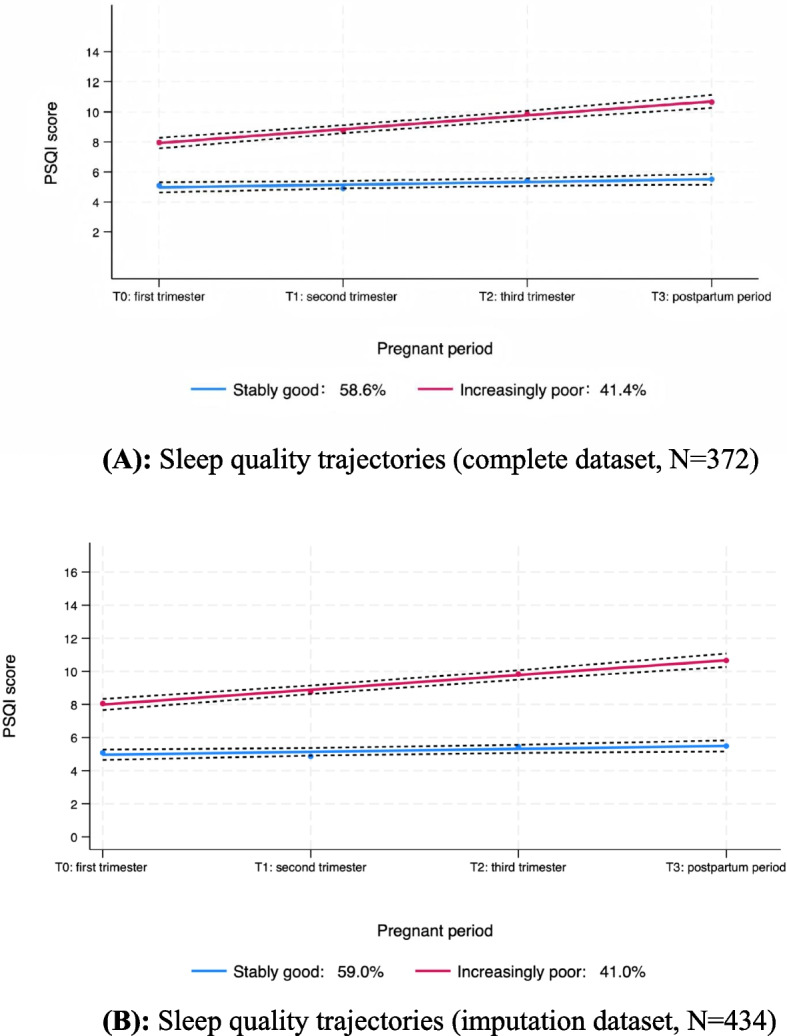 Figure 2
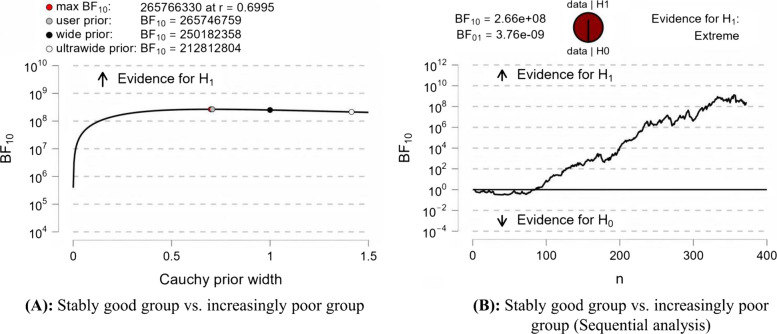 Figure 3
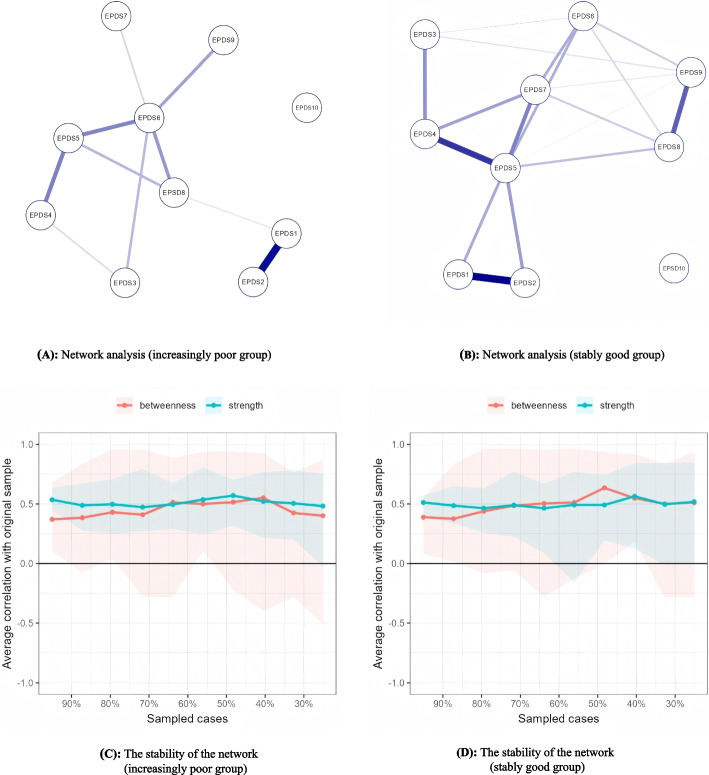 Figure 4
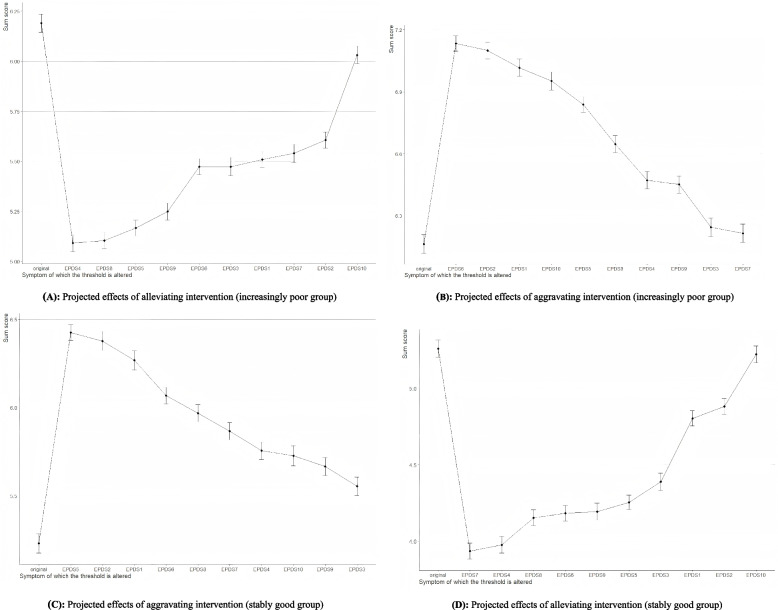 Figure 5
- —Young Elite Scientists Sponsorship Program by CACM
- —Science and Technology Projects in Guangzhou
Peer Reviews
No public reviews on file for this paper yet. If you reviewed it on a platform where reviews are public (OpenReview, ICLR, NeurIPS, ICML), you can paste yours below so the community can read it here.
Videos
No videos yet. Explain this paper in a talk, walkthrough, or lecture? Add one.
Taxonomy
TopicsSleep and related disorders · Maternal Mental Health During Pregnancy and Postpartum · Mental Health Research Topics
Background
Postpartum depression (PPD) represents an important public health problem, with a global prevalence estimated at approximately 17.2% [1]. In China, this figure is even higher, at 20.2% [2]. PPD can result in adverse outcomes for both mothers and infants [3, 4], emphasizing the importance of identifying protective factors against PPD. Recent research has focused increasingly on the factors influencing PPD, with sleep quality emerging as a critical element [5].
Sleep quality undergoes considerable fluctuations throughout the pregnancy and postpartum phase [6, 7]. A recent systematic review highlighted substantial heterogeneity in sleep quality, with 12 studies identifying 2 to 4 distinct trajectories [8]. Notably, 11 of these studies concentrated on either the interval covering the third trimester to postpartum or solely on the pregnancy phase [8]. While one study examined sleep quality trajectories from early pregnancy through 42 days postpartum, it was limited by a small sample size of only 101 participants [9]. These aspects underscore the need for further investigation with larger sample sizes to elucidate these dynamics more comprehensively.
Previous research has investigated the link between sleep quality trajectories and PPD. For instance, research has shown that women in the “increasingly poor” and “stably poor” groups are at greater risk for elevated postpartum depressive symptoms compared to those in the “stably good” group, with odds ratios of 12.42 and 21.04, respectively [10]. Another study reported that individuals within the clinical insomnia trajectory exhibited elevated levels of PPD than those in the subclinical or no insomnia trajectory (all P < 0.05) [9]. However, these studies mainly employed logistic regression or one-way ANOVA to assess differences in PPD risk across identified sleep quality trajectories, without further exploring how depression manifests in different sleep patterns [9, 10].
Traditionally, research has relied on composite scores from standardized depression measurement questionnaires. While these scores facilitate the identification of overall depression severity, they may mask the complex interplay and variability among individual symptoms [11]. This underscores the importance of adopting innovative analytical methods that can capture the specific PPD symptoms across different sleep quality trajectories. Network analysis provides a promising approach, enabling the visualization of symptom interconnections and the identification of central symptoms within distinct subgroups [12, 13]. However, this approach has not been widely used within the context of PPD relative to varying sleep patterns.
Additionally, although existing literature indicates that specific depressive symptoms may significantly influence overall depression scores [14], their functional dynamics within the postpartum context remain unexplored. The use of computational simulations to evaluate the impacts of specific symptoms on overall depression scores constitutes an innovative advancement [15]. This approach can aid in identifying critical targets for intervention, thereby facilitating more personalized and impactful mental health strategies for postpartum women [15, 16].
Overall, existing studies have established a connection between sleep quality trajectories and PPD, yet notable gaps remain. The current study seeks to fill these gaps by (1) applying a group-based trajectory model to identify potential sleep quality patterns from the first trimester to 42 days postpartum, (2) utilizing network analysis to pinpoint distinct core symptoms across different sleep quality trajectories, and (3) applying computational simulations to target specific postpartum depressive symptoms for intervention.
Methods
Study design and participants
This prospective study was conducted within the Be Resilient to Postpartum Depression program (registration number: ChiCTR2100048465), with detailed study design information available in prior reports [17–19]. Four assessments were conducted following relevant clinical guidelines [20–23]: T0 (the first trimester), T1 (second trimester), T2 (third trimester), and T3 (postpartum period). Eligibility requirements included the following: (1) aged 18 years or older, (2) confirmation of pregnancy by ultrasound, and (3) proficiency in Mandarin for communication. Exclusion criteria comprised the following: (1) a diagnosed mental disorder and (2) termination of pregnancy.
Self-administered questionnaires were completed by participants at the hospital, and researchers were on hand to answer questions if needed. Those lost to follow-up were not included in the final analysis. At T0, 434 of 443 distributed questionnaires were returned (98.0%). At T1, 421 of 430 issued questionnaires were received (97.9%). At T2, 403 of 415 distributed questionnaires were returned (97.1%). Finally, at T3, 384 of 398 provided questionnaires were returned (96.5%). Ultimately, 372 participants completed data across all four time points (see Fig. 1).Fig. 1. Data collection flowchart
According to Nagin (2005) and Jones and Nagin (2007) [24, 25], a total sample size of approximately 300–500 is generally adequate for obtaining stable and reliable estimates when modeling 2 to 4 trajectory groups. Therefore, our sample size of 372 participants falls within this recommended range.
Measurements
Demographic characteristics and pregnancy-related variables
According to previous research [26, 27], we collected the following demographic characteristics: age, level of education, work status, birthplace, marital status, monthly household income, and pregnancy-related variables: nulliparity (yes or no), pregnancy intention (planned or unplanned), and mode of delivery (vaginal or cesarean).
Sleep quality
The Pittsburgh Sleep Quality Index (PSQI) was used to assess sleep quality at T0, T1, T2, and T3 [28]. This self-reported tool assesses seven components, yielding an overall score ranging from 0 to 21 [28]. The Chinese adaptation has shown adequate reliability and has been utilized in our prior research [17, 29]. The Cronbach’s alpha values in this study ranged from 0.64 to 0.71.
Postpartum depression
Postpartum depression at T3 was evaluated using the Edinburgh Postnatal Depression Scale [30]. This scale includes 10 items scored on a 4-point Likert scale, producing total scores ranging from 0 to 30. A score of 13 or above suggests significant depressive symptoms [31]. The Chinese adaptation has exhibited strong reliability and has been used in our previous study [32, 33]. In this study, the Cronbach’s alpha was 0.90.
Statistical analysis
First, the distribution of categorical variables was presented as frequencies and percentages, while means and standard deviations (SD) were used for continuous variables.
Next, distinct sleep quality trajectories were distinguished through group-based trajectory modeling (GBTM) [34], a restrictive form that fixes within-class variance to zero and assumes homogeneity within each latent class. This approach focuses on identifying distinct subpopulations that share similar developmental trajectories rather than modeling within-class variability in growth parameters. We fitted models with two to four trajectory groups, sequentially assessing the significance of the intercept, linear, quadratic, and cubic terms of time. The optimal model was selected based on lower Bayesian information criterion (BIC), Akaike information criterion (AIC), log-likelihood (LL), higher entropy, and a minimum group size of 5% per group [34]. Model adequacy was assessed according to three criteria: (1) an average posterior probability of group membership exceeding 0.7, (2) less than 5% the difference between the estimated group probabilities and the observed proportion of group assignments determined by the maximum probability rule, and (3) the odds of correct classification of 5 or greater for all groups [35]. To further validate the accuracy of the trajectory, a sensitivity analysis was conducted that included pregnant women who had at least completed the baseline measurements (N = 434). The full information maximum likelihood estimation method, which incorporates all available data without listwise deletion, was used to address missing data.
Following this, differences in EPDS scores between the identified two trajectories were evaluated using a Bayesian independent samples t-test, while logistic regression was utilized to explore the odds ratios (OR) of identified trajectories for postpartum depression. As EPDS contains an item (item 7) that assesses sleep difficulty caused by emotion, which may inflate the association between the identified sleep trajectories and depressive symptoms, we conducted an additional linear regression using the total EPDS score with and without item 7 to validate the results. The differences in regression coefficients were assessed using a z-test [36].
Finally, high centrality indices calculated by Ising network analysis were used to explore the core symptoms for both groups at 42 days postpartum [37]. Network stability was evaluated using the centrality stability coefficient. A coefficient greater than 0.25 indicates that the stability is within the acceptable range, while a coefficient exceeding 0.5 signifies good stability [38]. The NodeIdentifyR algorithm was applied in a computer-simulated analysis to identify effective intervention targets. In the Ising model, EPDS items were coded as 0 for absence (score of 0) and 1 for presence (scores between 1 and 3) [39]. This algorithm simulates data changes to evaluate the impact of symptom-specific interventions [16].
Statistical analyses were performed using Stata MP 18.0, JASP 0.18.3.0, and R 4.5.0, with significance defined as a two-tailed P-value below 0.05.
Results
Sample characteristics
The average age of the 372 participants was 29.7 years (SD = 4.10), with an average EPDS score of 9.11 (SD = 4.38). Among the participants, 70.0% had at least an associate degree, and 72.9% were employed. Additionally, 59.7% were born in rural areas, and half were nulliparous. Most pregnancies (89.3%) were planned, and 61.2% of the deliveries were vaginal. Further details are provided in Table 1. Table 1. Baseline characteristics of participantsN (%)/mean ± SDEPDS, mean ± SDAge, year29.7 ± 4.109.11 ± 4.38Level of education Secondary or below112 (30.1)9.38 ± 4.82 Associate degree139 (37.4)9.27 ± 4.31 Bachelor or high121 (32.5)8.69 ± 4.03Work status Employed271 (72.9)9.01 ± 4.10 Unemployed101 (27.2)9.38 ± 5.09Marital status Married351 (94.4)9.26 ± 4.40 Unmarried21 (5.7)6.67 ± 3.38Monthly household income, CNY ≤ 400092 (24.7)9.22 ± 4.63 > 4000280 (75.3)9.08 ± 4.31Birthplace Urban150 (40.3)9.07 ± 3.93 Rural222 (59.7)9.14 ± 4.68Nulliparity Yes186 (50.0)8.96 ± 4.18 No186 (50.0)9.27 ± 4.59Pregnancy intent Planned332 (89.3)9.11 ± 4.42 Unplanned40 (10.8)9.18 ± 4.11Delivery mode Vaginal227 (61.2)8.89 ± 4.46 Cesarean145 (39.0)9.46 ± 4.26Identified trajectories Stably good218 (58.6)7.88 ± 4.17 Increasingly poor154 (41.4)10.86 ± 4.08
Model selection and sleep quality trajectories
The four-group model (polynomial order: 1113) had the lowest absolute BIC value (closest to zero), but its entropy was the lowest compared with the two-group (0.803) and three-group (0.856) models. Neither the four-group nor the three-group model met the minimum group size criterion of 5% per trajectory. Thus, the two-group model (polynomial order: 11) was selected for further analysis, supported by an average group posterior probability of 0.92 or higher for each group, a close match between the estimated group probabilities and the actual group assignments, and odds of correct classification of 10.93 or higher. Details about model comparison and the accuracy of the selected model are presented in Tables 2 and 3, respectively. Figure 2A illustrates two distinct trajectories: “stably good” (58.6%), representing participants with consistently good sleep quality, and “increasingly poor” (41.4%), indicating those whose sleep quality declined from a moderate baseline. Figure 2B shows that the sensitivity analysis using pregnant women who had at least completed the baseline measurements was consistent with the primary trajectory results. Table 2. Model selection resultsNumber of trajectories234Polynomial order^a^111131113BIC (N = 1488)^b^− 3596.65− 3556.79− 3542.58BIC (N = 372)^c^− 3592.49− 3549.17− 3532.87AIC^d^− 3580.73− 3527.61− 3505.44LL^e^− 3574.73− 3516.61− 3491.44Entropy0.8030.8560.750Trajectory proportion (%)Trajectory 1: 58.60Trajectory 1: 53.23Trajectory 1: 39.25Trajectory 2: 41.40Trajectory 2: 41.94Trajectory 2: 33.06Trajectory 3: 4.84Trajectory 3: 23.39Trajectory 4: 4.30^a^Trajectory shapes: 1, linear; 3, cubic. ^b^BIC Bayesian information criterion (for the total number of observations). ^c^BIC Bayesian information criterion (for the total number of participants). ^d^AIC Akaike information criterion. ^e^LL log-likelihoodTable 3Model diagnostics^a^TrajectoriesAvePP^b^OCC^c^|EP-P|^d^Stably good0.9623.540.01Increasingly poor0.9210.930.01^a^Model polynomial order: 11. ^b^Average group posterior probability. An AvePP greater than 0.7 for all groups is recommended. ^c^Odds of correct classification. An OCC of five or more is recommended for all groups. ^d^EP estimated group probabilities; P proportion assigned to the group using the maximum probability ruleFig. 2Sleep quality trajectories identified by group-based trajectory modeling. A Sleep quality trajectories (complete dataset, N = 372). B Sleep quality trajectories (imputation dataset, N = 434). Note: The scores for the increasingly poor group consistently exceeded 5, suggesting that PSQI scores above 5 are indicative of poor sleepers
The association of sleep quality trajectories with postpartum depression
A notable difference in EPDS scores was found between the stably good and increasingly poor groups (BF10 = 2.66e + 08, Fig. 3). As shown in Table 4, the postpartum depression rate was significantly elevated in the increasingly poor trajectory compared to the stably good trajectory (OR = 2.60, 95% CI [1.58, 4.28], P < 0.001). This link remained significant after adjusting for age, level of education, work status, birthplace, marital status, monthly household income, nulliparity, pregnancy intention, and mode of delivery (adjusted OR = 2.75, 95% CI [1.62, 4.66], P < 0.001). Results of the linear regression (Table 5) show that the crude and adjusted coefficients did not differ statistically, whether the total EPDS score included item 7 or not. Fig. 3. Bayesian independent sample t-test analysisTable 4Associations of sleep quality trajectories with postpartum depressionCrude OR (95% CI)PAdjusted OR^a^ (95% CI)PStably good1 (reference)1 (reference)Increasingly worse2.60 (1.58, 4.28) < 0.0012.75 (1.62, 4.66)< 0.001Abbreviations: CI confidence interval, OR odds ratio. ^a^Age, level of education, work status, birthplace, marital status, monthly household income, nulliparity, pregnancy intention, and mode of delivery were adjustedTable 5Comparison of regression coefficients with and without inclusion of EPDS item 7Crude modelAdjusted model^a^B (all items)2.993.05B (without item 7)2.502.54SE (all items)0.440.45SE (without item 7)0.390.40z-value for difference^b^0.830.86P for difference0.400.39B unstandardized coefficients, SE standard error. ***P < 0.001. ^a^Adjusted model was adjusted for age, education, employment status, monthly household income, place of birth, nulliparity, pregnancy intent, and delivery mode. The reference group was set as stably good trajectory. ^b^ \documentclass[12pt]{minimal} \usepackage{amsmath} \usepackage{wasysym} \usepackage{amsfonts} \usepackage{amssymb} \usepackage{amsbsy} \usepackage{mathrsfs} \usepackage{upgreek} \setlength{\oddsidemargin}{-69pt} \begin{document}$${\mathrm{z}}=\frac{{\textrm{B1}}-{\textrm{B2}}}{\sqrt{{\textrm{SE1}}^{2} +{\textrm{SE2}}^{2}}}$$\end{document} , where B represents the regression coefficients and SE represents the standard errors
Network characteristics
The network visualizations are shown in Fig. 4. In the increasingly poor trajectory (Fig. 4A), the core symptom was EPDS6 (strength = 1.839), while in the stably good trajectory (Fig. 4B), EPDS5 (strength = 2.055) was identified as the core symptom. The stability test reveals that the centrality stability coefficient is close to 0.5, indicating that the network stability is relatively good (see Fig. 4C & D). Comparison between the stably good and increasingly poor groups revealed statistically significant differences (P = 0.039, see Additional file 1: Fig. S1).Fig. 4. Ising network analysis. A Network analysis (increasingly poor group). B Network analysis (stably good group). C The stability of the network (increasingly poor group). D The stability of the network (stably good group)
Computer-simulated intervention
As depicted in Fig. 5, the impact of individual symptoms on network dynamics varied between the two trajectories. In the increasingly poor group, EPDS4 was associated with a decline in the predictive symptom total score from 6.15 to 5.10 (Fig. 5A). Conversely, EPDS6, identified as the core symptom, exhibited the strongest predictive effect, raising the sum score from 6.15 to 7.13 (Fig. 5B). In the stably good group, EPDS5, identified as the core symptom, produced the greatest predictive increase in the sum score from 6.15 to 7.13 (Fig. 5C). Then, EPDS7 contributed to a decrease in the predicted sum score, lowering it from 5.26 to 3.94 (Fig. 5D).Fig. 5. The effect of computer-simulated interventions on postpartum depressive symptoms
Discussion
This study examined the longitudinal trajectories of sleep quality across pregnancy and the early postpartum period, examining their association with PPD. Two distinct trajectories were identified, each exhibiting unique pathways in the manifestation of postpartum depressive symptoms. These findings may guide the creation of targeted interventions tailored to the specific needs.
Consistent with prior studies [8], the identification of two distinct sleep quality trajectories suggests heterogeneous sleep patterns during pregnancy and the postpartum period. However, unlike previous research that identified four sleep patterns, namely, stably poor, mild increasingly poor, high increasingly poor, and stably good [10], our study revealed only “stably good” and “increasingly poor” groups. Notably, the proportion of women in the “stably good” group (58.6%) was higher than that reported in the studies by Sedov et al. and Tomfohr et al. [9, 10]. This discrepancy may be due to variations in sample characteristics, measurement intervals, or the instruments used for assessment. Both prior studies were conducted in developed countries. While Sedov et al. employed measurement intervals similar to ours, they used the Insomnia Severity Index with a substantially smaller sample size of 142 participants [9]. In contrast, Tomfohr et al. used the same PSQI but assessed participants at two prenatal points, followed by at 3 and 6 months postpartum [10].
Our findings reinforce the established link between declining sleep quality and an elevated risk of PPD [40]. Specifically, women with worsening sleep quality are over twice as likely to develop PPD, highlighting the urgent need for ongoing monitoring of sleep quality and the development of targeted interventions to maintain healthy sleep patterns during this critical period.
We also gained novel insights into the symptom structure of PPD across different trajectories. The “increasingly poor” group exhibited distinct core symptoms (EPDS6) characterized by feelings of overwhelm and an inability to cope. This pattern is consistent with previous findings that chronic poor sleep quality is related to reduced coping capacity to manage daily demands, leading to a pervasive feeling of being overwhelmed [41, 42]. Additionally, poor sleep quality is commonly acknowledged as a risk factor for heightened stress perception, which may exacerbate the effects of other perinatal stressors [43]. Conversely, the “stably good” group displayed prominent panic or acute fear. This may suggest that even in the absence of chronic sleep problems, some women experience heightened anxiety or panic symptoms during the postpartum period. Such symptoms could reflect individual differences in stress reactivity or preexisting vulnerabilities to anxiety, which may be triggered or intensified by perinatal physiological stressors [44]. In this context, panic becomes the primary expression of PPD, distinguishing it from the cognitive overwhelm seen in the “increasingly poor” group.
Furthermore, the differential effectiveness of interventions targeting specific symptoms underscores the context-dependent characteristics of PPD networks. The prominent alleviation associated with EPDS4 (“generalized anxiety”) in the “increasingly poor” group underscores its central role in this phenotype. Chronic poor sleep quality may impair the ability to disengage attention from negative stimuli, potentially transforming “unfounded” anxiety into a central hub of distress symptoms [45]. Additionally, ongoing anxiety and stress have also been linked to greater difficulties in mood regulation, which may exacerbate depressive symptoms [46]. In contrast, the alleviating effect of EPDS7 (mood-related sleep difficulties) in the “stably good” group highlights the reciprocal relationship between sleep and depression [47]. In this context, sleep issues may be more situational and directly linked to negative emotions, rather than being chronic. Acute sleep disturbances triggered by emotional distress may initiate a reflex-like physiological stress response, leading to exaggerated emotional reactivity and heightened negative mood in the moment [48]. This creates a feedback loop where unhappiness and sleep issues reinforce each other, ultimately increasing the overall depressive burden [49].
Strengths and limitations
The longitudinal design and implementation of network analysis represent key strengths of this research. Nevertheless, certain limitations warrant consideration. First, the study was conducted in a single geographic region, and the sample predominantly consisted of middle-class participants, which may limit generalizability. Second, our study relied on the PSQI to measure sleep quality, which lacks more objective indicators and may reduce the accuracy of sleep monitoring. Third, the binary categorization may not adequately reflect the intensity of symptoms, highlighting the necessity for more advanced models to encompass a wider spectrum of symptoms. Lastly, we did not include other variables that may affect sleep quality and PPD, such as the levels of social support and depression during pregnancy.
Implications
The findings have important implications. Future research should integrate objective sleep measurements, like wearable technology, in conjunction with self-report instruments to minimize bias and enhance accuracy [50]. It is also crucial to account for factors like prenatal complications, social support levels, and depression to fully understand their effects on PPD. Clinically, routine monitoring of sleep quality could help identify women at risk for depression, enabling early intervention. Tailored interventions based on sleep trajectory subgroups may enhance treatment efficacy. For the “stably good” group, strategies should prioritize emotional regulation and expression, as evidence from a randomized controlled trial indicates that affect regulation training can significantly reduce depressive symptoms [51]. Conversely, for the “increasingly poor” group, integrating sleep management and problem-solving is crucial, as cognitive behavioral therapy for insomnia has proven effective in alleviating both insomnia and depression [52].
Conclusions
In summary, we identified distinct trajectories of sleep quality during pregnancy and the postpartum period and revealed unique pathways of postpartum depressive symptoms between the “stably good” and “increasingly poor” groups. These findings may empower clinicians to devise more effective, symptom-specific strategies customized to meet the specific needs of postpartum women.
Supplementary Information
Additional file 1: Fig. S1. Result of network comparison test.
The reference list from the paper itself. Each links out to its DOI / PubMed record.
- 1Wang M, Qian J, Cho Y, Guo Z, Yu X, Li J. Trajectories of sleep health during the perinatal period: a systematic review and meta-analysis. Sleep. 2025. 10.1093/sleep/zsaf 095.10.1093/sleep/zsaf 095PMC 1224637240289611 · doi ↗ · pubmed ↗
- 2Pan X, Chen Y, Chen C, Chen J, Wang J, Chen Y, et al. Dual trajectory of insomnia and depressive symptoms in women from early pregnancy to 6 months postpartum: a prospective cohort study. BMC Pregnancy Childb. 2025;25(1):582.10.1186/s 12884-025-07649-2PMC 1208581940382558 · doi ↗ · pubmed ↗
- 3Olfati M, Samea F, Faghihroohi S, Balajoo SM, Genon S, Patil K, et al. Prediction of depressive symptoms based on sleep quality, anxiety, and brain structure. med Rxiv. 2023:2023.08.09.23293887.10.1016/j.ebiom.2024.105313 PMC 1141457539255547 · doi ↗ · pubmed ↗
- 4Lima NC, Kirov R, de Almondes KM. Impairment of executive functions due to sleep alterations: an integrative review on the use of P 300. Front Neurosci. 2022;16:2022.10.3389/fnins.2022.906492 PMC 935547235937880 · doi ↗ · pubmed ↗