Deletion of hepatic growth hormone receptor contributes to the pathogenesis of lean MAFLD by elevating CD36
Dong Yu, Xiao Yang, Xiaonan Zhang, Xiaoxin Wang, Zicheng Pu, Ai Mi, Liyuan Ran, Fang Zhang, Bin Liang, Yingjie Wu

TL;DR
Deleting the growth hormone receptor in the liver causes fatty liver disease in non-obese mice by increasing CD36, a protein linked to fat accumulation.
Contribution
This study identifies hepatic GHR deficiency as a novel driver of lean MAFLD through CD36 upregulation and metabolic dysregulation.
Findings
LGHRKO mice developed non-obese MAFLD with hepatomegaly and elevated liver enzymes.
CD36 upregulation and impaired lipolysis contribute to hepatic lipid accumulation in LGHRKO mice.
Human genetic analyses confirm a causal link between impaired GH–IGF signaling and MAFLD risk.
Abstract
Metabolic dysfunction-associated fatty liver disease (MAFLD) has become the most prevalent chronic liver disease worldwide, affecting both obese and non-obese individuals. While the reduced levels of circulating growth hormone (GH) and insulin-like growth factor 1 (IGF-1) have been consistently observed in patients with hepatic steatosis, the molecular role of hepatic growth hormone receptor (GHR) in MAFLD pathogenesis remains unclear. In this study, we established a liver-specific Ghr knockout (LGHRKO) mouse model that faithfully recapitulates non-obese MAFLD, characterized by hepatomegaly, elevated serum lipids and transaminases, and pronounced hepatic lipid accumulation, all occurring in the absence of obesity or increased adiposity. Mechanistically, LGHRKO livers displayed enhanced lipogenesis, impaired lipolysis, and upregulated cluster of differentiation 36 (CD36) expression,…
Genes, proteins, chemicals, diseases, species, mutations and cell lines named across the full text — each resolved to its canonical identifier and authoritative record.
Click any figure to enlarge with its caption.
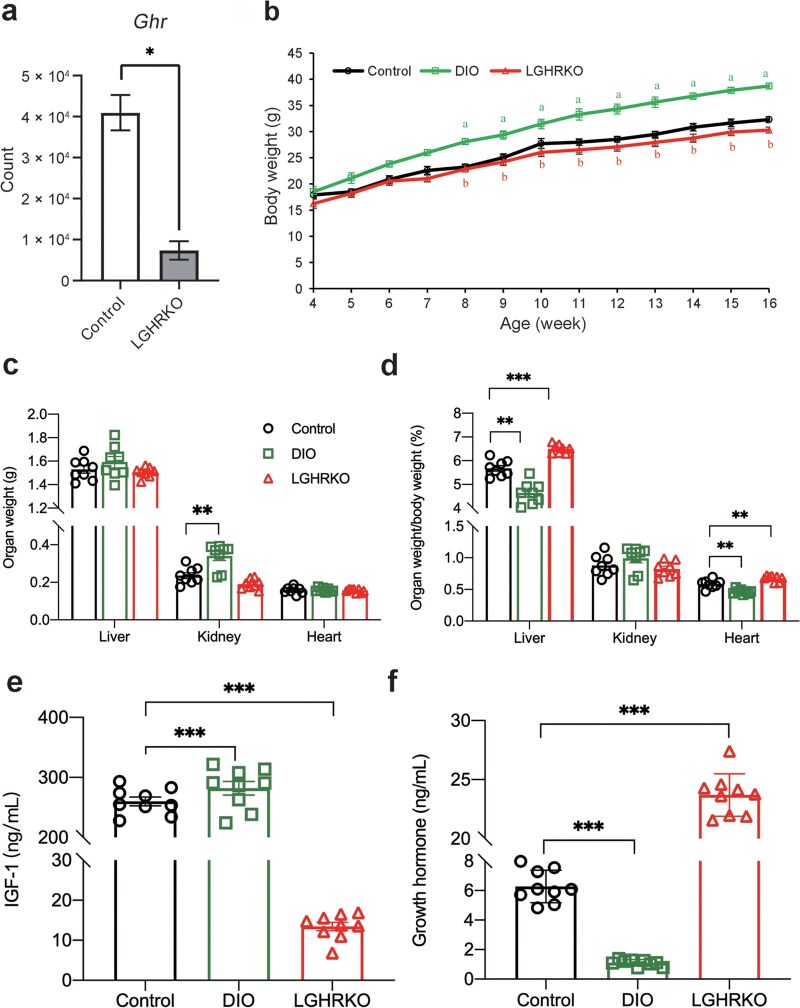 Figure 1
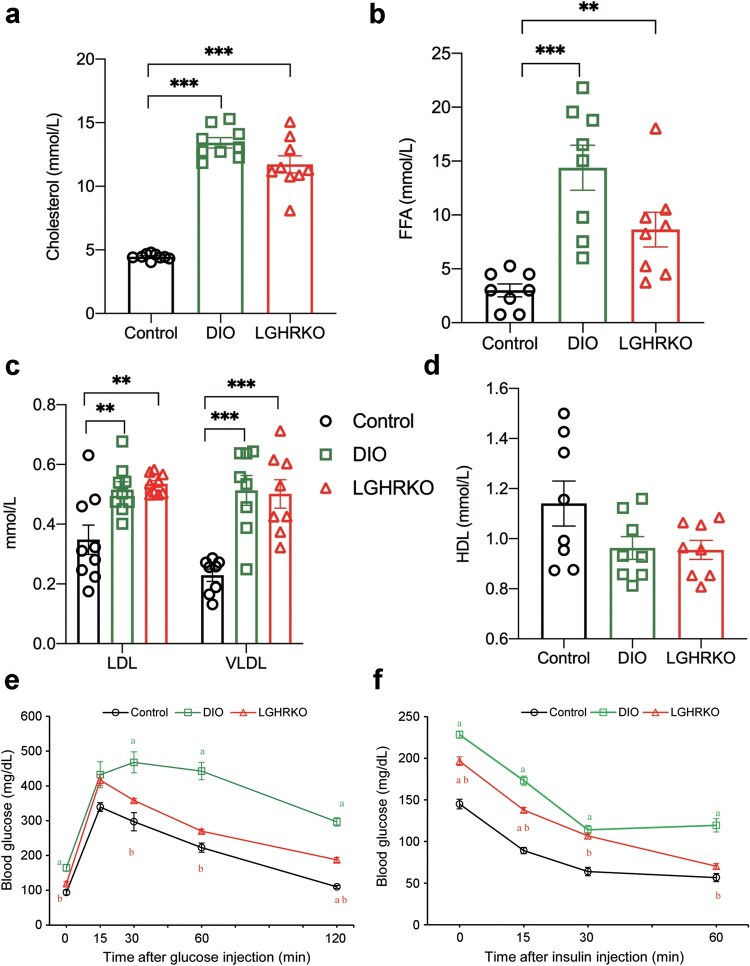 Figure 2
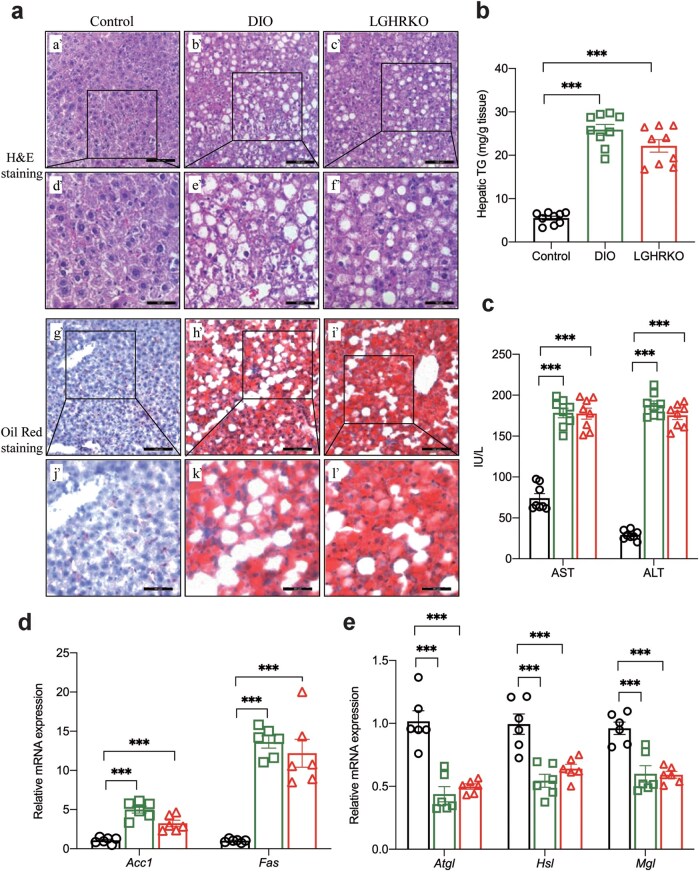 Figure 3
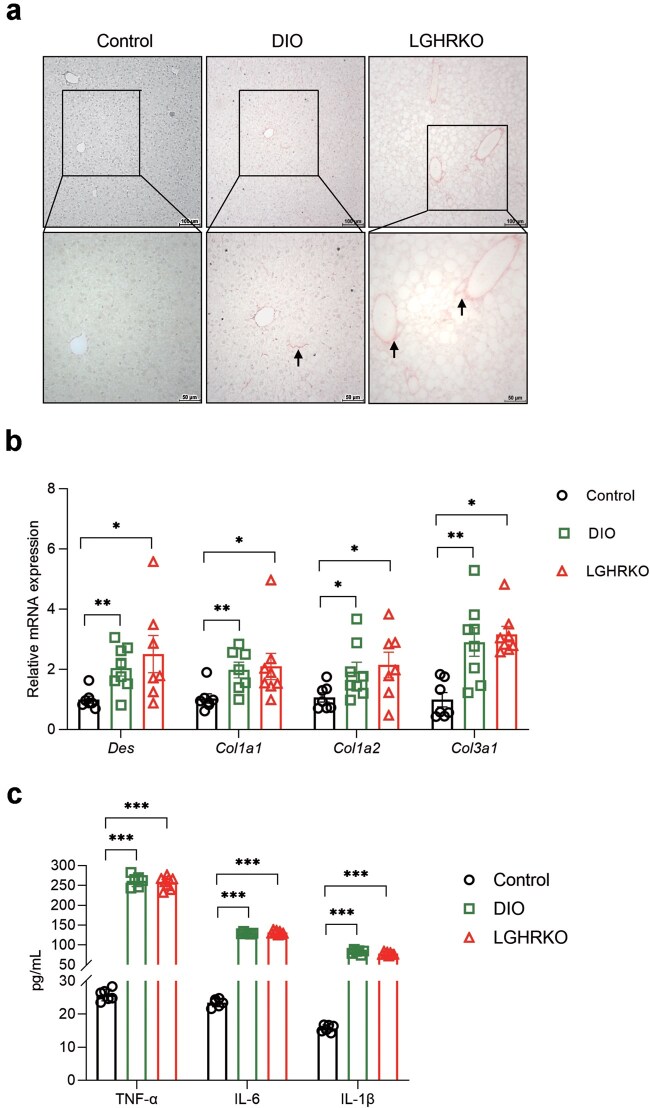 Figure 4
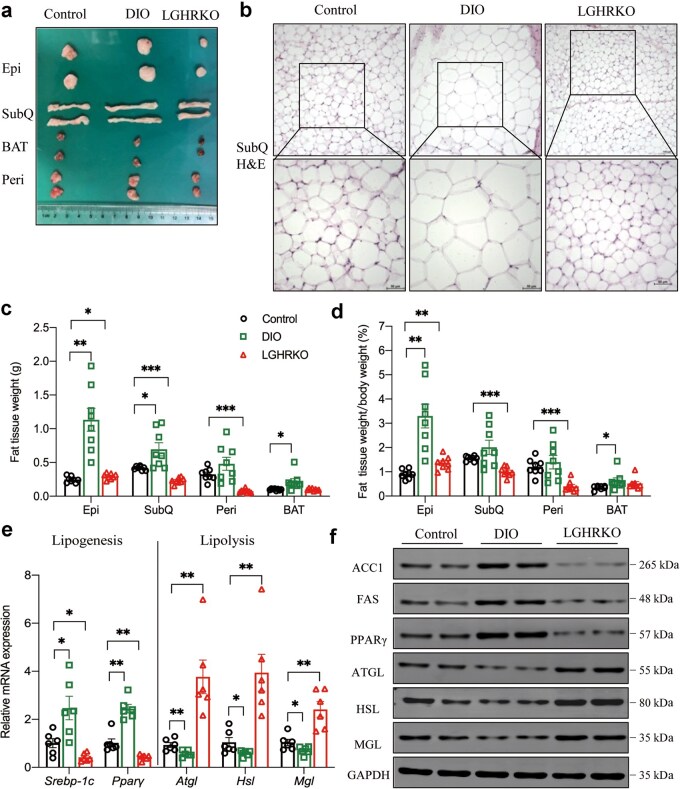 Figure 5
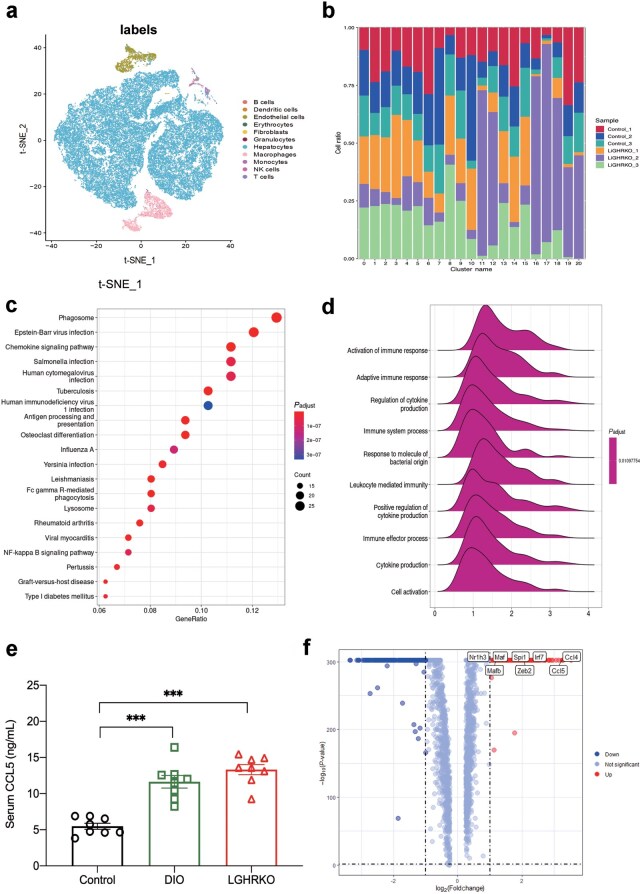 Figure 6
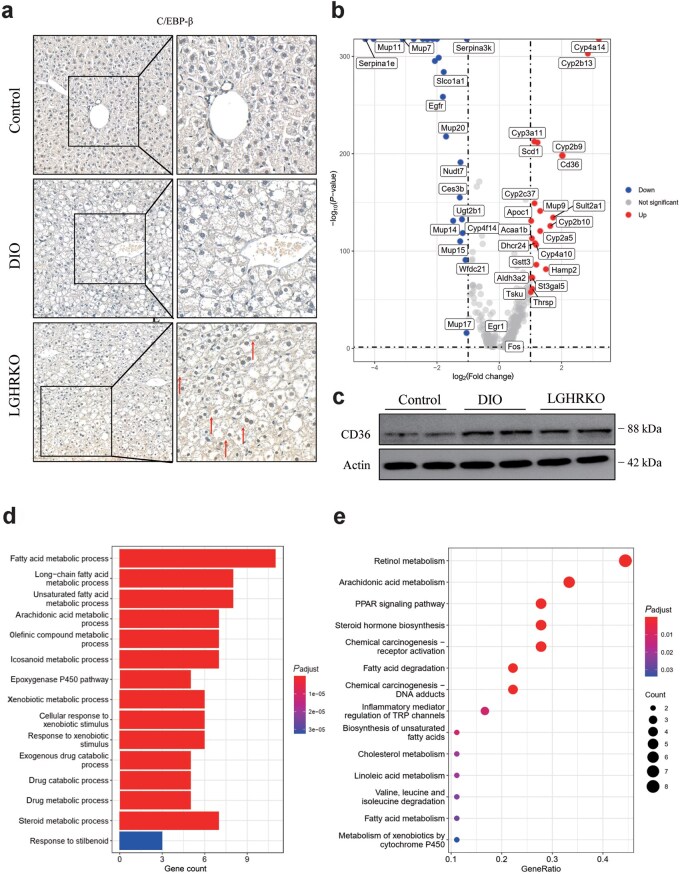 Figure 7
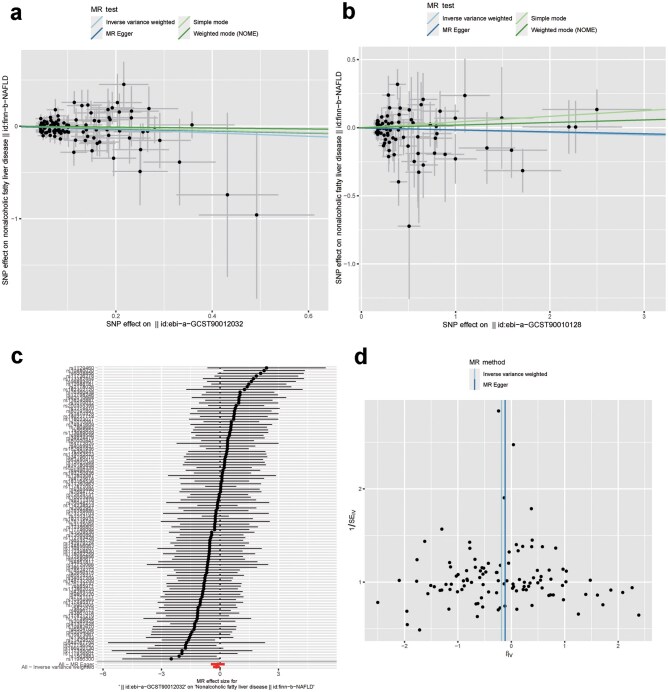 Figure 8
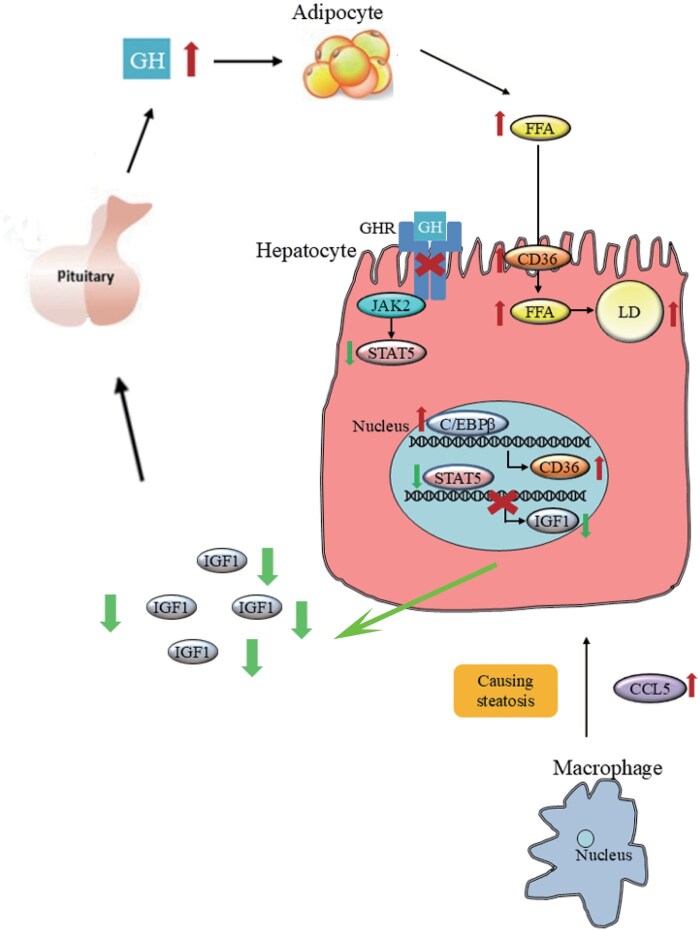 Figure 9
| Cell type Cluster | 0 | 1 | 2 | 3 | 4 | 5 | 6 | 7 | 8 | 9 | 10 | 11 | 12 | 13 | 14 | 15 | 16 | 17 | 18 | 19 | 20 |
|---|---|---|---|---|---|---|---|---|---|---|---|---|---|---|---|---|---|---|---|---|---|
| B cells | 0 | 0 | 0 | 0 | 0 | 0 | 0 | 0 | 0 | 0 | 0 | 71 | 1 | 0 | 0 | 0 | 0 | 0 | 0 | 2 | 0 |
| Dendritic cells | 0 | 0 | 0 | 0 | 0 | 0 | 0 | 0 | 0 | 0 | 0 | 2 | 0 | 0 | 0 | 0 | 0 | 1 | 0 | 3 | 0 |
| Endothelial cells | 0 | 0 | 0 | 0 | 0 | 0 | 0 | 0 | 0 | 0 | 0 | 0 | 1815 | 0 | 0 | 0 | 5 | 9 | 0 | 2 | 30 |
| Erythrocytes | 0 | 0 | 0 | 0 | 0 | 0 | 0 | 0 | 0 | 0 | 0 | 0 | 0 | 0 | 0 | 0 | 0 | 3 | 0 | 0 | 0 |
| Fibroblasts | 0 | 0 | 0 | 0 | 0 | 0 | 0 | 0 | 0 | 0 | 0 | 0 | 1 | 0 | 0 | 0 | 0 | 2 | 0 | 0 | 26 |
| Granulocytes | 0 | 0 | 0 | 0 | 0 | 0 | 0 | 0 | 0 | 0 | 0 | 19 | 0 | 0 | 0 | 0 | 0 | 0 | 0 | 0 | 0 |
| Hepatocytes | 6781 | 5526 | 4985 | 4864 | 4829 | 4191 | 3999 | 3322 | 3019 | 2991 | 2549 | 72 | 353 | 1075 | 820 | 754 | 10 | 332 | 358 | 19 | 17 |
| Macrophages | 0 | 0 | 5 | 0 | 0 | 0 | 0 | 0 | 0 | 0 | 1 | 2151 | 3 | 0 | 0 | 0 | 732 | 85 | 0 | 3 | 3 |
| Monocytes | 0 | 0 | 0 | 0 | 0 | 0 | 0 | 0 | 0 | 0 | 0 | 203 | 3 | 0 | 0 | 0 | 3 | 172 | 0 | 28 | 0 |
| NK cells | 0 | 0 | 0 | 0 | 0 | 0 | 0 | 0 | 0 | 0 | 0 | 5 | 0 | 0 | 0 | 0 | 0 | 0 | 0 | 28 | 0 |
| T cells | 0 | 0 | 0 | 0 | 0 | 0 | 0 | 0 | 0 | 0 | 0 | 11 | 0 | 0 | 0 | 0 | 0 | 0 | 0 | 65 | 0 |
| id.exposure | id.outcome | Outcome | Exposure | Method | SNP number | β | se |
| Correct causal direction |
|---|---|---|---|---|---|---|---|---|---|
| prot-a-1211 | finn-b-NAFLD | Nonalcoholic fatty liver disease | Growth hormone receptor | Inverse variance weighted | 90 | −0.01237 | 0.044637 | 0.781736 | FALSE |
| prot-a-1211 | finn-b-NAFLD | Nonalcoholic fatty liver disease | Growth hormone receptor | MR Egger | 90 | 0.089389 | 0.098035 | 0.364364 | FALSE |
| prot-a-1211 | finn-b-NAFLD | Nonalcoholic fatty liver disease | Growth hormone receptor | Simple mode | 90 | −0.09305 | 0.158898 | 0.559628 | FALSE |
| prot-a-1211 | finn-b-NAFLD | Nonalcoholic fatty liver disease | Growth hormone receptor | Weighted mode (NOME) | 90 | −0.00277 | 0.144454 | 0.984771 | FALSE |
| prot-c-2948_58_2 | finn-b-NAFLD | Nonalcoholic fatty liver disease | Growth hormone receptor | Inverse variance weighted | 18 | −0.07138 | 0.080756 | 0.376766 | FALSE |
| prot-c-2948_58_2 | finn-b-NAFLD | Nonalcoholic fatty liver disease | Growth hormone receptor | MR Egger | 18 | −0.46893 | 0.337132 | 0.183286 | FALSE |
| prot-c-2948_58_2 | finn-b-NAFLD | Nonalcoholic fatty liver disease | Growth hormone receptor | Simple mode | 18 | −0.20037 | 0.189939 | 0.306217 | FALSE |
| prot-c-2948_58_2 | finn-b-NAFLD | Nonalcoholic fatty liver disease | Growth hormone receptor | Weighted mode (NOME) | 18 | −0.22314 | 0.200124 | 0.280369 | FALSE |
| ebi-a-GCST90010128 | finn-b-NAFLD | Nonalcoholic fatty liver disease | Growth hormone levels | Inverse variance weighted | 82 | −0.01777 | 0.023451 | 0.448479 | FALSE |
| ebi-a-GCST90010128 | finn-b-NAFLD | Nonalcoholic fatty liver disease | Growth hormone levels | MR Egger | 82 | −0.01421 | 0.033875 | 0.676012 | FALSE |
| ebi-a-GCST90010128 | finn-b-NAFLD | Nonalcoholic fatty liver disease | Growth hormone levels | Simple mode | 82 | 0.041695 | 0.068249 | 0.542959 | FALSE |
| ebi-a-GCST90010128 | finn-b-NAFLD | Nonalcoholic fatty liver disease | Growth hormone levels | Weighted mode (NOME) | 82 | 0.01901 | 0.039829 | 0.634445 | FALSE |
| ebi-a-GCST90012032 | finn-b-NAFLD | Nonalcoholic fatty liver disease | Growth hormone levels | Inverse variance weighted | 109 | −0.18143 | 0.087322 | 0.037736 | TRUE |
| ebi-a-GCST90012032 | finn-b-NAFLD | Nonalcoholic fatty liver disease | Growth hormone levels | MR Egger | 109 | −0.1141 | 0.178538 | 0.524122 | FALSE |
| ebi-a-GCST90012032 | finn-b-NAFLD | Nonalcoholic fatty liver disease | Growth hormone levels | Simple mode | 109 | −0.11682 | 0.28772 | 0.685536 | FALSE |
| ebi-a-GCST90012032 | finn-b-NAFLD | Nonalcoholic fatty liver disease | Growth hormone levels | Weighted mode (NOME) | 109 | −0.04999 | 0.229221 | 0.827771 | FALSE |
| prot-b-30 | finn-b-NAFLD | Nonalcoholic fatty liver disease | growth hormone 1 | Inverse variance weighted | 26 | −0.03787 | 0.063838 | 0.552999 | FALSE |
| prot-b-30 | finn-b-NAFLD | Nonalcoholic fatty liver disease | growth hormone 1 | MR Egger | 26 | 0.140115 | 0.150942 | 0.36251 | FALSE |
| prot-b-30 | finn-b-NAFLD | Nonalcoholic fatty liver disease | growth hormone 1 | Simple mode | 26 | 0.051061 | 0.159758 | 0.751917 | FALSE |
| prot-b-30 | finn-b-NAFLD | Nonalcoholic fatty liver disease | growth hormone 1 | Weighted mode (NOME) | 26 | 0.058395 | 0.137087 | 0.673775 | FALSE |
| finn-b-NAFLD | prot-a-1211 | Growth hormone receptor | Nonalcoholic fatty liver disease | Inverse variance weighted | 82 | 0.005483 | 0.011376 | 0.629833 | FALSE |
| finn-b-NAFLD | prot-a-1211 | Growth hormone receptor | Nonalcoholic fatty liver disease | MR Egger | 82 | −0.0169 | 0.020763 | 0.418108 | FALSE |
| finn-b-NAFLD | prot-a-1211 | Growth hormone receptor | Nonalcoholic fatty liver disease | Simple mode | 82 | −0.04843 | 0.038553 | 0.212643 | FALSE |
| finn-b-NAFLD | prot-a-1211 | Growth hormone receptor | Nonalcoholic fatty liver disease | Weighted mode (NOME) | 82 | −0.0171 | 0.024365 | 0.484722 | FALSE |
| finn-b-NAFLD | prot-c-2948_58_2 | Growth hormone receptor | Nonalcoholic fatty liver disease | Inverse variance weighted | 15 | 0.055118 | 0.060844 | 0.364999 | FALSE |
| finn-b-NAFLD | prot-c-2948_58_2 | Growth hormone receptor | Nonalcoholic fatty liver disease | MR Egger | 15 | 0.084381 | 0.2639 | 0.754241 | FALSE |
| finn-b-NAFLD | prot-c-2948_58_2 | Growth hormone receptor | Nonalcoholic fatty liver disease | Simple mode | 15 | −0.0882 | 0.107682 | 0.426489 | FALSE |
| finn-b-NAFLD | prot-c-2948_58_2 | Growth hormone receptor | Nonalcoholic fatty liver disease | Weighted mode (NOME) | 15 | −0.08314 | 0.102507 | 0.430919 | FALSE |
| finn-b-NAFLD | ebi-a-GCST90010128 | Growth hormone levels | Nonalcoholic fatty liver disease | Inverse variance weighted | 76 | −0.01112 | 0.015503 | 0.473267 | FALSE |
| finn-b-NAFLD | ebi-a-GCST90010128 | Growth hormone levels | Nonalcoholic fatty liver disease | MR Egger | 76 | −0.00716 | 0.02286 | 0.754993 | FALSE |
| finn-b-NAFLD | ebi-a-GCST90010128 | Growth hormone levels | Nonalcoholic fatty liver disease | Simple mode | 76 | −0.01316 | 0.051473 | 0.798979 | FALSE |
| finn-b-NAFLD | ebi-a-GCST90010128 | Growth hormone levels | Nonalcoholic fatty liver disease | Weighted mode (NOME) | 76 | 0.000258 | 0.022752 | 0.990986 | FALSE |
| finn-b-NAFLD | ebi-a-GCST90012032 | Growth hormone levels | Nonalcoholic fatty liver disease | Inverse variance weighted | 84 | 0.009965 | 0.005287 | 0.05947 | FALSE |
| finn-b-NAFLD | ebi-a-GCST90012032 | Growth hormone levels | Nonalcoholic fatty liver disease | MR Egger | 84 | 0.001995 | 0.00869 | 0.818994 | FALSE |
| finn-b-NAFLD | ebi-a-GCST90012032 | Growth hormone levels | Nonalcoholic fatty liver disease | Simple mode | 84 | 0.005358 | 0.018861 | 0.777054 | FALSE |
| finn-b-NAFLD | ebi-a-GCST90012032 | Growth hormone levels | Nonalcoholic fatty liver disease | Weighted mode (NOME) | 84 | 0.004679 | 0.011325 | 0.680583 | FALSE |
| finn-b-NAFLD | prot-b-30 | growth hormone 1 | Nonalcoholic fatty liver disease | Inverse variance weighted | 33 | 0.026652 | 0.026981 | 0.323252 | FALSE |
| finn-b-NAFLD | prot-b-30 | growth hormone 1 | Nonalcoholic fatty liver disease | MR Egger | 33 | 0.11151 | 0.075343 | 0.148959 | FALSE |
| finn-b-NAFLD | prot-b-30 | growth hormone 1 | Nonalcoholic fatty liver disease | Simple mode | 33 | 0.050423 | 0.072441 | 0.491416 | FALSE |
| finn-b-NAFLD | prot-b-30 | growth hormone 1 | Nonalcoholic fatty liver disease | Weighted mode (NOME) | 33 | 0.088601 | 0.048242 | 0.07557 | FALSE |
| Target | Forward | Reverse |
|---|---|---|
|
| 5′-TTGTGCAGTGCCAGCCTCGTC-3′ | 5′-GCGCCCAATACGGCCAAATCC-3′ |
|
| 5′-AACCTGCACTTCCACAACCC-3′ | 5′-GACATGAACATTGGAGCCTCCGAA-3′ |
|
| 5′-TGCCACCACCTTATCACTATGTA-3′ | 5′-CCTGCCTGTCTCCATCCA-3′ |
|
| 5′-CCATCGACTACATCCGCTTC-3′ | 5′-GCCCTCCATAGACACATCTG-3′ |
|
| 5′-TGTGTCAGTGCCTATTCAG-3′ | 5′-GAACAGCGAAGTGTCTCT-3′ |
|
| 5′-GCTGTGGAATGAGGACATAGGA-3′ | 5′-GCATAGTGAGTGGCTGGTGAA-3′ |
|
| 5′-ACCATGCTGTGATGCTCTCTG-3′ | 5′-CAAACGCCTCGGGGATAACC-3′ |
|
| 5′-TCGCTGATGCACTGCCTATG-3′ | 5′-GAGAGGTCCACAGAGCTGATT-3′ |
- —National Key R&D Program of China10.13039/501100012166
- —the Ministry of Science and Technology of China
- —National Natural Science Foundation of China10.13039/501100001809
- —Science and technology plan
Peer Reviews
No public reviews on file for this paper yet. If you reviewed it on a platform where reviews are public (OpenReview, ICLR, NeurIPS, ICML), you can paste yours below so the community can read it here.
Videos
No videos yet. Explain this paper in a talk, walkthrough, or lecture? Add one.
Taxonomy
TopicsGrowth Hormone and Insulin-like Growth Factors · Liver Disease Diagnosis and Treatment · Liver physiology and pathology
Introduction
Parallel to the global epidemic of metabolic disorders, metabolic dysfunction-associated fatty liver disease (MAFLD) has emerged as the most common chronic liver disease worldwide and is expected to become the leading cause of end-stage liver diseases in the near future [1, 2]. MAFLD encompasses a spectrum of progressive conditions, ranging from simple liver steatosis (nonalcoholic fatty liver [NAFL], characterized by lipid accumulation) to more severe stages such as metabolic dysfunction-associated steatohepatitis (MASH, which involves persistent inflammatory infiltrates or fibrosis), ultimately progressing to cirrhosis and hepatocellular carcinoma (HCC) [3]. The global prevalence of MAFLD is currently estimated at 25%, showing an alarming upward trend [4]. Among those affected, 20% progress to MASH, which has become one of the leading indications for liver transplantation.
Though MAFLD is often diagnosed in obese or at least overweight individuals, it also occurs in lean or normal-weight patients, referred to as lean MAFLD. These individuals are sometimes called metabolically obese normal weight (MONW). The global prevalence of lean MAFLD is estimated to range from 12% to 20% [5]. Unlike the traditional understanding of MAFLD, lean MAFLD shows a higher prevalence in Asia compared to European populations [6]. Compared to obese MAFLD patients, lean MAFLD patients exhibit less insulin resistance but have similar levels of dyslipidemia and a comparable risk of progressing to MASH [7]. Additionally, lean MAFLD patients are at a higher risk for cardiovascular mortality and severe liver disease than their obese counterparts [5, 8]. Studies have suggested that genetic variants in patatin-like phospholipase domain-containing 3 (PNPLA3) or transmembrane 6 superfamily member 2 (TM6SF2) are associated with lean MAFLD [9]. Nevertheless, the molecular mechanisms underlying lean MAFLD are still unclear.
Growth hormone (GH) regulates somatotropic growth and a variety of physiological processes, such as lipolysis in the liver and adipose tissues [10–12]. The circulating insulin-like growth factor 1 (IGF-1) is primarily secreted by hepatocytes in response to GH stimulation. The prevalence of MAFLD is higher in patients with GH deficiency, and GH supplementation therapy has been shown to improve the histology of MAFLD [13–15]. Patients with dysfunctional growth hormone receptor (GHR), such as those with Laron syndrome [16], are also prone to developing MAFLD [17, 18]. Mice with hepatic GHR deletion or downstream signaling deficiencies exhibit hepatic steatosis, with body weight similar to or lower than that of control mice. Surprisingly, few studies have linked this phenomenon to lean MAFLD [19–21].
In this study, we demonstrated that liver-specific knockout of Ghr (LGHRKO) mice showed a phenotype comparable to diet-induced obese (DIO) mice in terms of blood lipid profiles, insulin resistance, and hepatic lipid content. However, these mice exhibited similar body weight and adipose tissue weight as control mice, suggesting that LGHRKO mice could serve as a model to simulate lean MAFLD patients. We observed that the CCAAT/enhancer binding protein (C/EBP) beta (C/EBPβ)-cluster of differentiation 36 (CD36) axis was activated in LGHRKO hepatocytes, promoting hepatic lipid accumulation. Furthermore, we explored the causal relationship between GH levels and nonalcoholic fatty liver disease (NAFLD) by applying two-sample Mendelian randomization (MR) analysis using genome-wide association study (GWAS) catalog summary data. Our findings provide novel evidence that liver-specific GHR ablation accelerates lipid intake and de novo lipogenesis while enhancing lipolysis in adipose tissue, leading to the development of lean MAFLD.
Results
LGHRKO mice display normal body weight
Liver-specific GHR deletion in LGHRKO mice was created by crossing GHR LL mice, which contain two LoxP sites flanking exon 4 of the Ghr gene, with the Alb-Cre mice, where the Cre gene was driven by the albumin promoter. Removal of exon 4 of the Ghr gene by the Cre enzyme in LGHRKO mice is depicted in Supplementary Fig. S1a. Reduced expression of Ghr in the livers of LGHRKO mice was validated by quantifying single-cell sequencing reads (Fig. 1a). Additionally, the expression of Igf1, a downstream target of the GHR signaling pathway, was significantly decreased as a result of GHR loss in LGHRKO livers (Supplementary Fig. S1b). As shown in Fig. 1b, LGHRKO mice exhibited similar body weight to control mice from 4 to 16 weeks of age. The body weight of LGHRKO mice was significantly lower than that of DIO mice starting at 8 weeks, with the weight gap between the two groups widening as the mice aged (Fig. 1b). In terms of major organs, the weights of the liver and heart showed no difference between LGHRKO, DIO, and control mice. Only kidney weight was significantly increased in DIO mice (Fig. 1c). Upon calculating the relative organ weight, we found that LGHRKO mice had the highest relative liver weight. The relative heart weight in control mice was also significantly higher than that in DIO mice, with no difference observed in the relative kidney weight among the three groups (Fig. 1d). Given that body growth is primarily regulated by GH and IGF-1, and the modifications to LGHRKO mice might affect the levels of these hormones, we examined the serum levels of GH and IGF-1 across the three groups of mice. The IGF-1 levels in LGHRKO mice were significantly lower than those in control and DIO mice (Fig. 1e; Supplementary Fig. S1b). However, the GH levels in LGHRKO mice were significantly higher than those in control mice, and the GH levels were further decreased in DIO mice (Fig. 1f). Taken together, these results indicate that LGHRKO mice have increased relative liver weight, normal body weight, decreased serum IGF-1 content, and increased serum GH content.
LGHRKO mice display higher liver index and leaner body than DIO mice. (a) The expression level of Ghr in the livers of LGHRKO mice. (b) Body weight of control, DIO, and LGHRKO mice followed to 16 weeks. (c) Weights of liver, kidney, and heart in control, DIO and LGHRKO mice. (d) Relative organ weights of liver, kidney, and heart for control, DIO, and LGHRKO mice (organ weight/body weight). (e) Circulating IGF-1 levels in control, DIO, and LGHRKO mice. (f) Circulating GH levels in control, DIO, and LGHRKO mice. n ≥ 8 mice in each group. Data are presented as mean ± SEM.
LGHRKO mice exhibit hyperlipidemia similar to the state of DIO mice
Both lean MAFLD and obese MAFLD are characterized by hyperlipidemia [7]. Additionally, a key factor in determining whether LGHRKO mice can serve as a lean MAFLD animal model is whether their blood lipid content is comparable to that of DIO mice. The liver plays a crucial role in lipid homeostasis, and hepatic GHR deficiency has previously been shown to increase the levels of plasma very low-density lipoprotein (VLDL), low-density lipoprotein (LDL), and cholesterol [22]. Elevated serum cholesterol levels are statistically associated with fatty liver disease [23]. We found that serum cholesterol content was significantly elevated in both LGHRKO and DIO mice [24–26] (Fig. 2a).
Clinically, high serum free fatty acids (FFAs) are associated with steatosis [27], as shown in both obese MAFLD [28] and lean MAFLD [29]. The FFA content in LGHRKO mice was significantly higher than that in control mice, although it was lower than that in DIO mice (Fig. 2b). Additionally, circulating LDL are considered indicators of fatty liver [30], and MAFLD is often associated with increased blood levels of VLDL [31]. In our study, serum LDL and VLDL levels were significantly increased in both LGHRKO and DIO mice, with no apparent difference observed between the two groups (Fig. 2c). High-density lipoprotein (HDL) is another biomarker for steatosis [32], and it is also reduced in patients with lean MAFLD [6]. Both LGHRKO and DIO mice exhibited lower HDL levels, although this difference was not statistically significant (Fig. 2d). Taken together, these data suggest that LGHRKO mice display hyperlipidemia similar to that observed in DIO mice, despite having relatively lean body weight. This further supports the notion that LGHRKO mice may serve as a model for studying lean MAFLD.
LGHRKO mice display similar serum lipid profiles and glucose metabolism as DIO mice. (a) Serum cholesterol levels in control, DIO, and LGHRKO mice. (b) Serum FFA levels in control, DIO, and LGHRKO mice. (c) Serum LDL and VLDL levels in control, DIO, and LGHRKO mice. (d) Serum HDL levels in control, DIO, and LGHRKO mice. (e) GTTs of control, DIO, and LGHRKO mice. (f) ITTs of control, DIO, and LGHRKO mice. n = 6–9 mice in each group. Data are presented as mean ± SEM.
LGHRKO mice exhibit imbalanced glucose tolerance and insulin resistance
Insulin resistance is a crucial factor in the initiation and progression of MAFLD. Clinical studies have also shown that lean MAFLD patients exhibit impaired glucose tolerance when compared to lean individuals without MAFLD [5, 33]. To assess these features in LGHRKO mice, we ran a glucose tolerance test (GTT). The blood glucose levels of LGHRKO mice were higher than those of control mice during the test, but lower than those of DIO mice from 30 min to 120 min after glucose injection (Fig. 2e). When we calculated the area under the curve (AUC), the GTT AUC of LGHRKO mice was significantly higher than that of control mice but still lower than that of DIO mice (Supplementary Fig. S2a). This result indicates that LGHRKO mice have impaired glucose tolerance, despite not being obese.
Insulin resistance is closely linked to MAFLD, with the most severe insulin resistance observed in obese MAFLD patients, followed by lean MAFLD, obese individuals without MAFLD, and lean individuals without MAFLD [33]. In this study, we evaluated insulin resistance, which was measured by an insulin tolerance test (ITT). The blood glucose levels of LGHRKO mice were significantly higher than those of control mice but lower than those of DIO mice at most time points during the ITT (Fig. 2f). The AUC calculation of ITT further confirmed that LGHRKO mice had higher insulin resistance than control mice, though it was still less than that observed in DIO mice (Supplementary Fig. S2b). These findings highlight that LGHRKO mice exhibit impaired glucose tolerance and insulin resistance, characteristics that are commonly observed in lean MAFLD patients, despite the absence of obesity.
To test whether insulin sensitivity was impaired in the livers of GHR KO mice, we first performed gene set enrichment analysis (GSEA) using a curated list of insulin signaling pathway genes, including insulin receptor substrate 1 (Irs1), Irs2, phosphatidylinositol-4,5-bisphosphate 3-kinase catalytic subunit alpha (Pik3ca), Pik3cb, Pik3cd, Pik3cg, AKT serine/threonine kinase 1 (Akt1), Akt2, Akt3, mitogen-activated protein kinase 1 (Mapk1), Mapk3, glycogen synthase kinase 3 beta (Gsk3b), Forkhead box O1 (Foxo1), sterol regulatory element binding transcription factor 1 (Srebf1), glucokinase (Gck), solute carrier family 2 member 4 (Slc2a4), hexokinase 2 (Hk2), phosphofructokinase muscle-type (Pfkm), protein kinase AMP-activated catalytic subunit α 1 (Prkaa1), Prkaa2, mechanistic target of rapamycin (Mtor), kinase ribosomal protein S6 kinase beta-1 (Rps6kb1), and eukaryotic translation initiation factor 4E binding protein 1 (Eif4ebp1). No significantly changes in these gene sets were observed at the transcriptomic level (Supplementary Fig. S2c). However, since the insulin signaling pathway is primarily regulated through post-translational modifications, particularly protein phosphorylation, transcriptomic data alone may not fully reflect functional alterations. Therefore, we next assessed the phosphorylation level of key signaling proteins, including protein kinase B (Akt), phosphoinositide 3-kinase (PI3K), and mTOR, as well as the expression of sterol regulatory element-binding protein-1c (Srebp-1c) at the protein level. The results showed that total protein levels of Akt, PI3K, and mTOR were not significantly affected by liver-specific GHR deletion (Supplementary Fig. S2d). In contrast, the phosphorylation levels of PI3K, Akt, and mTOR were markedly reduced in GHR KO liver cells, indicating impaired insulin signaling. These findings were further supported by immunohistochemistry analysis of liver tissues, which confirmed decreased levels of p-AKT, p-PI3K, and p-mTOR in GHR KO mice (Supplementary Fig. S2e).
LGHRKO mice show hepatic steatosis and liver dysfunction
A meta-analysis has reported that lean MAFLD tends to show less severe hepatic histology compared to obese MAFLD [34]. In this study, histological staining showed hepatocyte ballooning in both DIO and LGHRKO mice (Fig. 3a a’−f’). Although the number of ballooning cells was slightly lower in LGHRKO mice than that in DIO mice, it was significantly higher than that in control mice. Oil Red O staining, which highlights lipid droplets in red, demonstrated abundant red staining in both LGHRKO and DIO mouse livers, indicating substantial lipid accumulation (Fig. 3a g’−l’). The hepatic triglyceride (TG) content in LGHRKO mice was significantly elevated, reaching levels similar to those observed in DIO mice (Fig. 3b). Increased levels of liver enzymes, such as aspartate aminotransferase (AST) and alanine aminotransferase (ALT), are commonly observed in lean MAFLD patients [35]. We found the same pattern in LGHRKO mice. Both AST and ALT levels were significantly elevated in LGHRKO and DIO mice (Fig. 3c). The excessive lipid accumulation in the livers of LGHRKO mice can be attributed to increased expression of lipogenesis genes, such as acetyl-CoA carboxylase 1 (Acc1) and fatty acid synthase (Fas) (Fig. 3d). In contrast, the expression levels of lipolysis-related genes, including adipose triglyceride lipase (Atgl), hormone-sensitive lipase (Hsl), and monoacylglycerol lipase (Mgl), were reduced in LGHRKO mice (Fig. 3e). Importantly, no significant difference in the expression of these genes was observed between LGHRKO and DIO mice. These results demonstrate that LGHRKO mice exhibit excessive hepatic lipid accumulation, impaired liver function, and an imbalance between lipogenesis and lipolysis in the liver. Notably, the liver histology of LGHRKO mice closely resembles that of DIO mice.
LGHRKO mice contain excessive hepatic lipids with impaired liver function, similar to DIO mice. (a) Microscopic appearance of the livers in control, DIO, and LGHRKO mice. (a’–c’) H&E-stained liver section at 200× magnification. (d’–f’) H&E-stained liver section at 400× magnification. (g’–i’) Oil Red O-stained liver section at 200× magnification. (j’–l’) Oil Red O-stained liver section at 400× magnification. (b) Hepatic TG content of control, DIO, and LGHRKO mice. (c) Serum AST and ALT levels of control, DIO, and LGHRKO mice. (d) Relative hepatic mRNA levels of lipogenesis genes Acc1 and Fas. (e) Relative hepatic mRNA levels of lipolysis genes Atgl, Hsl, and Mgl. n = 6–8 mice in each group. Data are presented as mean ± SEM.
LGHRKO mice progress to MASH at 16 weeks
MASH is characterized by lobular inflammation and fibrosis. Liver tissues of 16-week-old mice were stained with Sirius Red to identify fibrosis. Collagen deposition was observed in the livers of LGHRKO and DIO mice (Fig. 4a). In addition, the expression levels of fibrogenesis-related genes, including desmin (Des), collagen type 1 alpha 1 (Col1a1), Col1a2, and Col3a1, were significantly elevated in LGHRKO mice (Fig. 4b). Moreover, inflammatory cytokines such as tumor necrosis factor alpha (TNF-α), interleukin (IL)-6, and IL-1β were highly expressed in LGHRKO and DIO mice (Fig. 4c). These findings suggest that steatosis in LGHRKO mice has progressed into MASH.
Steatosis in LGHRKO mice deteriorates into MASH at older age. (a) Sirius Red staining showing liver collagen in DIO and LGHRKO mice. Arrows show collagen deposition between hepatocytes (DIO mice) or surrounding vessels (LGHRKO mice). (b) Relative hepatic mRNA levels of fibrogenic genes. (c) The content of inflammatory cytokines. n = 6−8 mice in each group. Data are presented as mean ± SEM.
LGHRKO mice contain less adipose tissues than DIO mice
Our previous results showed that LGHRKO mice are not obese based on body weight. To further investigate whether they are lean in terms of fat tissues, adipose tissues from various body parts were excised en bloc and weighed. The gross appearance of adipose tissues collected from LGHRKO, DIO, and control mice revealed that fat tissues in LGHRKO mice were markedly smaller than those in DIO mice, regardless of epididymal fat (Epi), subcutaneous fat (SubQ), brown adipose tissue (BAT), or perirenal fat (Peri) (Fig. 5a). Histological examination showed that SubQ adipocytes in LGHRKO mice were substantially smaller than those in DIO mice and generally smaller than those in control mice (Fig. 5b). The smaller size of adipocytes indicated reduced lipid storage in adipose tissues, contributing to lower adipose tissue weight. By comparing adipose tissue weight across the three groups, we found that Epi, SubQ, BAT, and Peri adipose tissues were all significantly lighter in LGHRKO mice than those in DIO mice. Notably, SubQ and Peri fat in LGHRKO mice even weighed less than those in control mice (Fig. 5c). Regarding relative fat tissue weight, Epi, SubQ, and Peri fat tissues were significantly lighter in LGHRKO than those in DIO mice, with relative Peri fat also being lower in LGHRKO mice than those in control mice (Fig. 5d).
Adipose tissue size is reduced in LGHRKO mice. (a) Normal appearance of fat tissues in control, DIO, and LGHRKO mice. (b) H&E-stained SubQ fat tissues in control, DIO, and LGHRKO mice at 200× or 400× magnification. (c) Weights of different types of fat tissues in control, DIO, and LGHRKO mice. (d) Relative weights of different types of fat tissues in control, DIO, and LGHRKO mice. (e) Relative mRNA levels of lipogenesis- and lipolysis-related genes in the SubQ of control, DIO, and LGHRKO mice. (f) Western blot analysis of lipogenesis- and lipolysis-related proteins in the SubQ of control, DIO, and LGHRKO mice. BAT: brown adipose tissue; Epi: epididymal white adipose tissue; Peri: perirenal white adipose tissue; SubQ: subcutaneous white adipose tissue. n = 6 mice in each group. Data are presented as mean ± SEM.
Consistently, mRNA expression levels of lipogenic genes, including Srebp-1c and peroxisome proliferator-activated receptor γ (Pparγ), were significantly reduced in SubQ adipocytes of LGHRKO mice, followed by control and DIO mice (Fig. 5e). Meanwhile, mRNA expression levels of lipolytic genes such as Atgl, Hsl, and Mgl were dramatically elevated in LGHRKO mice but significantly decreased in DIO mice compared with those in control mice (Fig. 5e). Similarly, protein levels of lipogenic genes (such as ACC1, FAS, and PPARγ) and lipolytic genes (such as ATGL, HSL, and MGL) in SubQ tissues exhibited the same trend in LGHRKO mice (Fig. 5f).
Single-cell RNA sequencing identifies distinct cell clusters in LGHRKO mice
The Ghr knockout in hepatocytes profoundly influenced hepatic metabolism. To identify a deep transcriptional map of the hepatocytes and functionally related non-parenchymal cells, we applied liver single-cell dissociation procedure and single-cell RNA sequencing technique. The two-dimensional (2D) visualization of the cells is presented using t-distributed stochastic neighbor embedding (t-SNE) (Supplementary Fig. S3a). The library size of each cell was counted by unique molecular identifier with considerable variation among cells, indicating potential differences in biological activities (Supplementary Fig. S3a). A total of 66,493 cells were clustered into 21 populations (Supplementary Fig. S3b). Each cluster was composed of liver cells from both control and LGHRKO mice (Supplementary Fig. 3c). The identified markers of each cluster are shown in Supplementary Fig. S4a. However, the contribution of mice in each group to the cluster differed. Clusters 6 and 7 mainly consisted of control samples, whereas Clusters 8, 11, 12, 16, 17, and 18 predominantly comprised LGHRKO samples. The remaining clusters contained almost equal proportions of control and LGHRKO samples (Supplementary Fig. S3b and c). Clusters 0–10, 13–15, and 18 were identified as hepatocytes, marked by highly expressed cytochrome P450 (CYP) gene family, major urinary protein (MUP) gene family, sulfotransferase (SULT) gene family, argininosuccinate synthetase 1 (Ass1), glutamate-ammonia ligase (Glul), histidine ammonia lyase (Hal), ornithine aminotransferase (Oat), insulin-like growth factor-binding protein-1 (Igfbp1), stearoyl-CoA desaturase-1 (Scd1), hydroxysteroid 17-beta dehydrogenase 13 (Hsd17b13), and ferritin heavy chain 1 (Fth1), among others. Clusters 11, 16, and 17 were macrophages, marked by highly expressed chemokine C-C motif ligands 4 (Ccl4), Ccl5), whey acidic protein four-disulfide core domain 17 (Wfdc17), thymosin beta 4 X-linked (Tmsb4x), Fc epsilon receptor I gamma chain (Fecr1g), interferon alpha-inducible protein 27 like 2 A (Ifi27l2a), and Cd52. Cluster 12 represented endothelial cells, marked by highly expressed secreted protein acidic and rich in cysteine (Sparc), Igfbp7, protein tyrosine phosphatase receptor type B (Ptprb), and transmembrane-4 L-six family member-1 (Tm4sf1). Cluster 19 was composed of T cells and natural killer (NK) cells, marked by highly expressed thymosin beta10 (Tmsb10), cysteine-rich protein 1 (Crip1), Ccl5, and Il4. Cluster 20 comprised endothelial cells, fibroblasts, and hepatocytes, marked by highly expressed decorin (Dcn), extracellular matrix protein 1 (Ecm1), biglycan (Bgn), and regulator of G-protein signaling 5 (Rgs5). The exact cell type composition of each cluster is listed in Table 1.
Macrophage cluster enriched in LGHRKO mice is highly related to MAFLD
Each cell in the single-cell RNA sequencing was annotated into different cell type categories using the SingleR package and Mouse RNA-seq Data (Fig. 6a), including B cells, dendritic cells, endothelial cells, erythrocytes, fibroblasts, granulocytes, hepatocytes, macrophages, monocytes, NK cells, and T cells. The exact cell type composition of each cluster is listed in Table 1. Among the clusters with a relatively large population, Cluster 11 was mostly composed of LGHRKO cells (Fig. 6b), which were macrophage cells. Apart from hepatocytes, macrophage cells are a major contributing factor in the development of steatosis [36]. Therefore, we further investigated this cluster. Kyoto Encyclopedia of Genes and Genomes (KEGG) analysis of upregulated genes in Cluster 11 revealed its significant association with the chemokine signaling pathway (Fig. 6c), suggesting that this cluster was heavily involved in cytokine signaling. Gene Ontology (GO) analysis showed that the upregulated genes in Cluster 11 were significantly enriched in the regulation of cytokine production (Fig. 6d). The feature genes of Cluster 11 included Ccl4, Wfdc17, Ccl5, and Fcer1g (Supplementary Fig. S4b). Both Ccl4 and Ccl5 are cysteine-cysteine (CC) family chemokine members and proinflammatory cytokines secreted by monocytes [37]. MAFLD patients exhibit upregulated hepatic and blood CCL5 levels [38], and an in vivo study has demonstrated that CCL5 contributes to fibrosis in MAFLD [39].
Macrophage cluster enriched in LGHRKO mice is highly related to MAFLD through single-cell sequencing and cell population identification. (a) Cluster map of t-SNE visualized liver cells based on 66,493 single-cell transcriptomes. The cell types of the clusters are noted on the colors and labels. (b) The constitution of clusters from each liver sample. (c) KEGG analysis of Cluster 11. (d) GO analysis of Cluster 11. (e) Serum CCL5 levels of control, DIO, and LGHRKO mice. (f) Volcano plots of up-regulated and down-regulated genes in Cluster 11.
We next measured the serum levels of CCL5 in control, DIO, and LGHRKO mice and found that CCL5 levels were elevated in both LGHRKO and DIO mice (Fig. 6e). Volcano plots showed that nuclear receptor subfamily 1 group H member 3 (Nrlh3), MAF bZIP transcription factor B (Mafb), Maf, Spi-1 proto-oncogene (Spi1), zinc finger E box-binding homeobox 2 (Zeb2), interferon regulatory factor 7 (Irf7), Ccl4, and Ccl5 were elevated in Cluster 11 (Fig. 6f). IRF7, a member of the IRF family, binds to myeloid differentiation primary response 88 (MyD88) to form a complex to initiate downstream gene expression [40]. It is upregulated in obese mice and humans, and knockout of IRF7 protects mice from DIO-induced insulin resistance and obesity [41]. IRF7 is also one of the key activators of Ccl5 [43]. Furthermore, PU.1 (encoded by Spi1) is elevated in DIO-induced obese mice, and knockdown of this gene in macrophages attenuates hepatic liver MASH in db/db mice [42]. PU.1 has also been reported to interact with IRF8 to activate Ccl5 transcription [44]. Additionally, a few fibroblasts were identified in Cluster 20, which consisted of endothelial cells, fibroblasts, and hepatocytes. This suggests that macrophage-mediated inflammatory responses may induce fibrogenesis during liver steatosis and/or MASH.
Hepatocyte cluster enriched in LGHRKO mice has high expression of C/EBPβ and CD36
Hepatocytes are the main component of the liver and play a pivotal role in lipid metabolism. Clusters 8 and 18 were both hepatocytes mainly composed of LGHRKO samples, with Cluster 8 having a relatively larger population than Cluster 18 (Fig. 6b). Therefore, we focused on the expression characteristic of Cluster 8. By separating cells contributed by control or LGHRKO mice in Cluster 8 in t-SNE visualization, we counted 888 cells from control mice and 2131 cells from LGHRKO mice (Supplementary Fig. S3d). This cluster was enriched for the expression of dihydropyrimidinase (Dpys), mitochondrially encoded NADH dehydrogenase 3 (mt-Nd3), cytochrome P450 family 2 subfamily B member 13 (Cyp2b13), and Cebpb (Supplementary Fig. S4c). High expression of mt-Nd3 has been reported to be accompanied by histological severity of steatosis [45], which aligns with the situation in this cluster.
C/EBPβ (protein encoded by Cebpb) regulates hepatic steatosis, inflammation, and endoplasmic reticulum (ER) stress. Deficiency of this gene attenuates lipid accumulation and inflammation in MASH [46]. The liver section of LGHRKO mice showed significantly more C/EBPβ than those of control mice (red arrows), whereas less positive staining was observed in the nuclei of DIO mice (Fig. 7a). The expression level of Cebpb was not significantly altered in the livers of LGHRKO mice (Supplementary Fig. 5a), indicating that the regulatory function of C/EBPβ on its downstream target genes may be governed primarily at the protein level rather than by changes in transcription. This observation indicates that C/EBPβ might be one of the driving forces of lipid deposition in the livers of LGHRKO mice. Apart from lipogenesis genes, C/EBPβ also mediates Cd36 transcription [47, 48]. Genes such as Cyp2b13, Cyp4a14, Cyp2b29, and Cd36 were highly expressed in LGHRKO cells in Cluster 8, while genes such as Mup7, Mup11, solute carrier organic anion transporter family, member 1a1 (Slco1a1), and epidermal growth factor receptor (Egfr) exhibited low expression in LGHRKO cells of Cluster 8 (Fig. 7b).
Hepatocyte cluster enriched in LGHRKO mice displays high expression of C/EBPβ and CD36. (a) Liver sections from control, DIO, and LGHRKO mice immunostained with anti-C/EBPβ antibody. Red arrow pointing to anti-C/EBPβ-positive nucleus. (b) Volcano plots of up-regulated and down-regulated genes in Cluster 8. (c) Western blot analysis revealing increased CD36 content in LGHRKO and DIO mice. (d) GO analysis of upregulated pathways in Cluster 8. (e) KEGG analysis of upregulated pathways in Cluster 8.
CD36 is the main transporter of FFA, carrying extracellular FFA into hepatocytes. As a downstream target gene of C/EBPβ, Cd36 expression was elevated in the livers of LGHRKO mice (Supplementary Fig. S5b) and specifically in hepatocytes (Fig. 7b). This upregulation was consistent with the increased nuclear localization of C/EBPβ observed in LGHRKO mice (Fig. 7a). Western blot analysis showed that the protein levels of CD36 were elevated in LGHRKO and DIO mice (Fig. 7c), suggesting increased FFA uptake in the liver. The featured genes and upregulated transcription factors were both related to the progression of MAFLD. Our findings indicate that the upregulated C/EBPβ and CD36 might be responsible for the unbalanced lipid metabolism in hepatocytes of LGHRKO mice. Differentially expressed genes (DEGs) in the fatty acid metabolic process, long-chain fatty acid metabolic process, and unsaturated fatty acid metabolic process were significantly activated in GO analysis of Cluster 8 (Fig. 7d). Similarly, KEGG analysis of upregulated genes in Cluster 8 found that pathways related to arachidonic acid metabolism, fatty acid degradation, and cholesterol metabolism were activated (Fig. 7e). Meanwhile, the biosynthesis pathway of unsaturated fatty acids was also enriched. The findings from GO and KEGG analyses implied that the hepatocytes were coping with excessive lipids by upregulating relevant metabolic genes and pathways. However, the boosted depletion of lipids was not sufficient to consume the overload of fatty acids, which were mainly originated from adipose tissues and transported into hepatocytes by CD36.
Casual effects of GH on the development of NAFLD
GWAS analyses have accumulated numerous studies associated with NAFLD. There are 221 single-nucleotide polymorphisms (SNPs) and 30 studies associated with NAFLD (EFO_0003095) in the GWAS Catalog (updated to 2023.06.18). The genes mapped to the SNPs are involved in the development of NAFLD, such as PNPLA3 [49, 50], leptin receptor (LEPR) [49], and human leukocyte antigen (HLA) [51]. We extracted the gene list from human NAFLD GWAS summary data and found that GH and GHR interacted with LEPR or leptin receptor overlapping transcript (LEPROT) (Supplementary Fig. S6) with String (version 11.5), which are involved in NAFLD. These results suggest that the GH levels or GHR may be causally associated with NAFLD in humans, similar to mice.
To test our hypothesis, we performed two-sample MR analysis to identify the causal relationship between GH levels and NAFLD. We selected GH levels or GHR as the exposure and NAFLD traits as the outcome. The inverse-variance weighted (IVW) method, which is reported to be more powerful than others, was primarily used for the analysis. As given in Table 2, we found that only GH level (ebi-a-GCST90012032) was causally associated with MAFLD (β < 0, *P *< 0.05), while GH level (ebi-a-GCST90010128) and GHR were not (Fig. 8a and b; Supplementary Fig. S7a and b). The negative β-value indicated that in this population, a decreased GH level may increase the risk of MAFLD (Fig. 8a and c). The SNPs were uniformly distributed in the funnel plot (Fig. 8d).
GH level has causation effects on MAFLD. (a) GH level (ebi-a-GCST90012032) (exposure) is causally related to MAFLD (finn-b-MAFLD) (outcome). P < 0.05. (b) GH level (ebi-a-GCST90010128) (exposure) is not causally related to MAFLD (finn-b-MAFLD) (outcome). P > 0.05. (c) MR effect size for SNPs in the causal effects between GH level and MAFLD. All is under zero. (d) SNPs are uniformly distributed in the funnel plot.
We also conducted the reverse MR analysis between MAFLD and GH levels. However, there were no significant results indicating a causal relationship between MAFLD and GH levels or GHR, although the P-values for the causation relationship between MAFLD and GH levels or GHR were near 0.05 (Table 2; Supplementary Fig. S7c and d). This may be explained by the insufficient number of SNPs in GWAS analysis.
In summary, we speculate that: (i) reduction of IGF-1 hepatic secretion due to impaired GH signaling in LGHRKO mice leads to elevated GH synthesis; (ii) upregulated GH acting on adipose tissues causes increased lipolysis, decreased fat mass, and abundant circulating FFA; (iii)overflow FFA are transported into hepatocytes with the help of CD36; (iv) de novo lipogenesis, promoted by C/EBPβ and FBJ osteosarcoma oncogene (Fos), together with the extrahepatic lipids imported by CD36, collectively triggers steatosis. Meanwhile, the macrophage cluster expressing CC family chemokine is also likely involved in the development of steatosis; and (v) GH and GHR may have a similar regulatory function in the development of MAFLD in humans (Fig. 9).
The mechanism of lean MAFLD in LGHRKO mice. Elevated GH leads to increased lipolysis and decreased lipogenesis in adipose tissues. It contributes to the reduction of fat tissues in LGHRKO mice. Besides, hydrolyzed lipid is transported into the liver in the form of FFA and increases hepatic lipid flux. Meanwhile, in the liver, hepatocytes with high levels of C/EBPβ and other lipogenic transcription factors, such as CD36, also promote de novo lipogenesis. The macrophage cluster expressing CCL5, which causes hepatocyte damage, is probably involved in the development of steatosis.
Discussion
Lean and obese MAFLD share common risks, including hyperlipidemia, hypertension, and diabetes [52]. However, lean MAFLD patients may exhibit higher fibrosis severity and higher cardiovascular mortality, despite having similar or lower degrees of steatosis compared to obese MAFLD patients [5, 8, 53, 54]. These observations highlight the need for distinct therapeutic strategies for lean MAFLD, which are currently lacking. Existing treatments primarily target obese MAFLD or involve lifestyle intervention [6]. This therapeutic gap stems partly from the absence of suitable animal models that accurately mimic lean MAFLD pathogenesis. Current MAFLD models, such as high-fat diet (HFD) or methionine-choline-deficient (MCD) diet mice, are often reported to induce steatosis and insulin resistance alongside obesity. Although tree shrew exhibit steatosis without obesity on a high-energy diet, they do not develop insulin resistance [55], making them less representative of human lean MAFLD [56]. Here, we demonstrated that LGHRKO mice replicate key features of human lean MAFLD, including normal body weight, hyperlipidemia, hepatic steatosis, and insulin resistance, closely resembling human lean MAFLD.
Previous research has shown that hepatic GHR disruption impairs GH/IGF-1 signaling, leading to insulin resistance, glucose tolerance, and hepatic steatosis via increased lipid biogenesis and decreased hepatic lipid export [19, 57]. Fan et al. [19] and List et al. [20] both found that disruption of hepatic GHR would result in fatty liver. The body weight of GHR-deficient mice in their research is either close to or lower than control mice. Consistently, we found that LGHRKO mice have similar body weight to control mice, similar to the report of Cordoba-Chacon et al. [58], and are indeed “lean” compared to DIO mice.
As the majority of endocrine IGF-1 is originated from the liver under the mediation of GHR [59], and LGHRKO mice have hepatic GHR deficiency, it is not surprising that they have a 90% decrease in circulating IGF-I level. On the other hand, an HFD could induce the elevation of IGF-1 [60, 61], which explains the IGF-1 increase in DIO mice. In addition, IGF-1 negatively regulates the secretion of GH by targeting both the hypothalamus and pituitary [62], which explains the elevated serum GH levels in LGHRKO mice. The relationship between IGF-1 level and insulin resistance follows a U-shaped association, with both low or high IGF-1 content leading to increased homeostasis model assessment of insulin resistance (HOMA-IR, insulin resistance index) [63]. High levels of circulating GH would induce peripheral insulin resistance by its competitive binding to PI3K, uncoupling insulin receptor substrate 1 (IRS-1)-associated activation of PI3K [64]. In LGHRKO mice, low IGF-1 level and high GH level act synergistically to induce insulin resistance. This is consistent with the hypothesis that the pathogenesis of lean and obese MAFLD might be different [6].
Hyperlipoidemia is another hallmark of both lean and obese MAFLD [53]. High cholesterol, FFA, LDL, and VLDL levels, together with low HDL levels, were observed in both obese and non-obese patients [52, 65, 66]. Similar to our findings, plasma TG levels are elevated after hepatic knockdown of GHR [67]. Significant increase in VLDL and LDL was reported in the livers of 44–50-week-old GHR-deficient mice [25]. Increased plasma FFA was also found in 8-week hepatic Janus kinase 2 (JAK2) knockout mice (an intracellular tyrosine kinase binding with GHR) [21] and 12-week-old hepatic signal transducer and activator of transcription 5 (STAT5) knockout mice (a downstream transcription factor of JAK2) [68]. These pieces of evidence support dyslipidemia in LGHRKO mice.
Apart from the above similarity to DIO mice, LGHRKO mice also have reduced fat weight. The mechanism might lie in the imbalanced GH/IGF1-1 axis. GH is known to stimulate lipolysis in adipose tissues, and increased plasma FFA in LGHRKO mice could be considered a consequence of this lipolytic activity [69]. Lack of GHR in adipocytes leads to obesity [70]. GH regulates the release of FFAs from adipocytes by modulating HSL, MGL, and ATGL [71]. On the other hand, GH also inhibits lipogenesis in adipose tissue. Similar to insulin, IGF-1 has adipogenesis effects [72]. Adipocyte knockout of IGF-1R leads to a 25% reduction of adipose tissue [73]. Igfbp3 transgenic mice with elevated circulating IGF-1 levels (2– 3 fold) showed an 80% increase in epididymal fat pad [74]. In humans, GH increases circulating FFAs by boosting lipolysis and restraining FFA intake to adipocytes [71]. In LGHRKO mice, as the effect of increased GH and decreased IGF-1, adipose tissue releases lipids in the form of FFAs. These FFAs are absorbed into hepatocytes with the help of CD36. CCL5 is known to be secreted by many hepatic cell types, including macrophages, hematopoietic stem cells (HSCs), T cells, and so on [75]. HSC-generated CCL5 was reported to induce steatosis in hepatocytes [76]. In the case of LGHRKO mice, hepatic CCL5 is mainly generated from macrophages. We have reason to believe that macrophage-originated CCL5 is also involved in the steatosis of LGHRKO mice. In the hepatocytes of LGHRKO mice, CD36 pumps overwhelmed FFA, C/EBPβ regulates the lipogenesis process, and CCL5 in the microenvironment stimulates steatosis, which together trigger fatty liver.
Furthermore, our MR analysis suggests that GH levels may be causally associated with MAFLD in humans, supporting the translational relevance of our model. However, reverse MR analysis did not identify a significant causal relationship between MAFLD and GH/GHR, possibly due to limited SNP data. In summary, LGHKT mice represent a promising model for studying lean MAFLD. The pathogenesis involves dysregulated GH/IGF-1 signaling, adipose tissue lipolysis, hepatic FFA uptake, and macrophage-mediated inflammation. This model may facilitate a better understanding of lean MAFLD and aid in the development of targeted therapies.
Limitations of the study
In our study, we constructed the liver GHR knockout mice and investigated the mechanism underlying the lean MAFLD caused by the loss of GHR. We revealed that loss of GHR in hepatocytes leads to attenuated insulin signaling and elevated CD36 protein level, which may contribute to the enhanced fatty acid uptake. However, the current work is subject to two major limitations. First, to directly establish causal involvement of CD36, future studies should employ GHR/CD36 double-knockout mice and perform in vitro FFA uptake assays using primary hepatocytes lacking both GHR and Cd36. Second, the mechanism through which hepatic GHR loss enhances adipose tissue lipolysis remains unclear; generating tissue-specific double knockout models targeting both liver and adipose GHR will be essential to dissect this inter-organ crosstalk.
Materials and methods
Animals
C57BL/6J mice with a pure genetic background were used in this study. LGHRKO mice were generated using the Cre/LoxP system [22] by crossing GHR^flox/flox^ mice [23] with albumin-Cre mice (B6.FVB(129)-Tg (Alb1-cre)1Dlr/J). Floxed GHR littermates served as controls. Control and LGHRKO mice were fed a regular chow diet (D12450J, 3.85 kcal/g, 10% fat calories). DIO mice were fed an HFD (D12492, 5.24 kcal/g, 60% fat calories) starting at 4 weeks of age. Mice were housed in an individually ventilated cage system with five animals per cage, maintained under 12-h light/12-h dark cycles, and provided with ad libitum access to food and water. Male mice aged 16 weeks were used in all experiments, with 6–9 mice per group. Mice were anesthetized prior to sacrifice. The chow diet was purchased from Keaoxieli (Beijing). All animal procedures were approved by the Animal Care and Use Committee of Dalian Medical University.
GTT and ITT
Blood glucose concentrations were measured with glucometers (ACCU-CHEK). For the GTT, mice were fasted overnight for 16 h in cages with paper bedding. Each mouse was weighed, and glucose was administered at 2 mg/g body weight. For the ITT, mice were fasted for 4 h under the same condition. Insulin was injected at a dose of 0.75 U/kg body weight.
Serum and liver analyses
Hormones and cytokines were measured by ELISA, including GH (BPE20916; BPRO), IGF-1 (BPE20004; BPRO), insulin (H203; Njjcbio), and CCL5 (BPE200198; ShangHai Lengton Bioscience). Serum levels of LDL cholesterol (LDL-C) (A113-1; Njjcbio), VLDL (H249; Njjcbio), total cholesterol (T-CHO) (A111-1; Njjcbio), HDL (A112-1; Njjcbio), non-esterified FFA (A042-2; Njjcbio), AST (C009-2; Njjcbio), and ALT (C010-2; Njjcbio), and hepatic contents of TG (A110-1; Njjcbio), TNF-α (SCA133Mu; USCNLIFE), Il-6 (SEA079Mu; USCNLIFE), and Il-1β (SEA563Mu; USCNLIFE) were measured according to the manufacturer’s instructions.
Histology
Liver and adipose tissues were fixed in 10% formalin, processed into 5-μm paraffin sections, and stained with hematoxylin and eosin (H&E) (I032; Njjcbio). To visualize hepatic neutral lipids, fixed liver tissues were frozen, cut into 10-μm sections, and stained with Oil Red O (D027; Njjcbio). Anti-C/EBPβ (ABP53491; Abbkine) antibody was used to assess C/EBPβ expression in liver sections.
Single-cell preparation of the liver
Mice were anesthetized via intraperitoneal injection of 1% pentobarbital (50 mg/kg). The abdomen was opened, and the portal vein was perfused with wash solution (Ca^2+^-free Hank’s balanced salt solution [HBSS] with 10 mmol/L HEPES and 0.5 mmol/L EGTA, pH 7.7–7.8). The inferior vena cava was clipped before cutting, following visible liver swollen. Wash solution was replaced with collagenase solution (dulbecco's modified eagle medium [DMEM] medium with 1 mg/mL collagenase type II) once the liver turned pale. The liver was excised once all lobes became soft. The liver was gently shaken in collagenase solution to release cells, filtered through a 40-μm filter, and centrifuged at 100 relative centrifugal force (RCF) for 5 min to collect hepatocytes. The pellet was resuspended in DMEM (containing 10% foetal bovine serum and penicillin-streptomycin), seeded in gelatin-coated plates, incubated at 37°C for 45 min, and digested with trypsin. Cell density and viability were subsequently measured.
Single-cell RNA sequencing
Cell suspensions were loaded into Chromium microfluidic chips with 3’ chemistry and barcoded using a Chromium Controller (10X Genomics, USA). Barcoded cells underwent RNA reverse transcription, and sequencing libraries were constructed with a Chromium Single Cell 3’ v2 reagent kit (10X Genomics) according to the manufacturer’s instructions. Sequencing was performed on an Illumina HiSeq 2000. Primary cell clustering was conducted with the “cell ranger” pipeline (10X Genomics), while further analysis was performed using the “Seurat” R packages. GO and KEGG enrichment analyses were conducted with R and the “clusterProfiler” package.
Gene expression analysis
Liver samples were stored in RNAholder^TM^ (#EH101; TransGen). Total RNA was extracted using TRIzol (#9109; Takara), reverse-transcribed using One-Step gDNA Removal and cDNA Synthesis SuperMix (#AT311-03; TransGen), and subjected to real-time PCR using SYBR master mix (#AQ101-03; TransGen) on an Applied Biosystems 7900HT Fast Real-Time PCR System. Transcript levels were normalized to GAPDH. Gene expression related to lipid breakdown and lipid synthesis were measured by quantitative PCR. The primer sequences are listed in Table 3.
Western blot and immunohistochemistry
Total protein was isolated from frozen liver samples stored at −80°C. Liver tissues were lysed in RIPA buffer (#PP1901; Bioteke) containing protease and phosphatase inhibitors (#ROC-5892791001 and #ROC-4906845001, respectively; Roche). Following centrifugation at 4°C, the supernatants were collected, and protein concentration was determined using the BCA assay (#P0012; Beyotime). Protein lysates (50 μg) were separated by SDS-PAGE, transferred onto nitrocellulose (NC) membranes (#66485; PALL), and blotted with the indicated primary antibodies at 1:1000 dilution: ACC1 (#A15606; ABclonal, RRID: AB_2763012), FAS (#A0461; ABclonal, RRID: AB_2757202), PPARγ (#A0270; ABclonal, RRID: AB_2757083), ATGL (#A6245; ABclonal, RRID: AB_2766852), HSL (#A15686; ABclonal, RRID: AB_2763096), MGL (#A6654; ABclonal, RRID: AB_2767241), CD36 (#A5792, Abclonal, RRID: AB_2766544), β-actin (#AC026, Abclonal, RRID: AB_2768234), and GAPDH (#10494-1-AP; Proteintech, RRID: AB_2263076).
Two-sample MR analysis
As illustrated in Supplementary Fig. S8, SNPs from GH-related GWAS projects were selected as instrumental variables (IVs). GH-related traits were downloaded from the IEU Open GWAS project (updated to 2023.06.18). The exposures included growth hormone 1 (prot-b-30), growth hormone levels (ebi-a-GCST90012032 and ebi-a-GCST90010128), and growth hormone receptor (prot-a-1211 and prot-c-2948_58_2) (Supplementary Table S1). The outcomes were MAFLD (finn-b-NAFLD) and lean body mass (ebi-a-GCST004770) (Supplementary Tables S2 and S3). SNPs were selected based on genome wide statistical significance (*P *< 5 × 10^−5^). Linkage disequilibrium (LD) clumping was conducted under the threshold of R^2^ < 0.01 and clumping distance of 5000 kb. MR analysis was performed using R and the TwoSampleMR package [24], primarily based on the IVW test, along with additional analyses. Reverse MR analysis was conducted to explore the causal relationship between GH and MAFLD.
Statistical analysis
Statistical analyses were performed using R software and associated packages. Two-tailed t-tests were applied to compare two groups, while one-way analysis of variance (ANOVA) followed by post hoc tests was used for multiple group comparisons. Results were expressed as means ± SEM, with statistical significance set at *P *< 0.05.
Supplementary data
Supplementary data are available at Life Metabolism online.
Supplementary Material
loaf037_Supplementary_Data
The reference list from the paper itself. Each links out to its DOI / PubMed record.
- 1Yoshitaka H , Hamaguchi M, Kojima T et al. Nonoverweight nonalcoholic fatty liver disease and incident cardiovascular disease. Medicine (Baltimore) 2017;96:e 6712.28471965 10.1097/MD.0000000000006712 PMC 5419911 · doi ↗ · pubmed ↗
- 2Ding C , Chan Z, Magkos F. Lean, but not healthy: the ‘metabolically obese, normal-weight’ phenotype. Curr Opin Clin Nutr Metab Care 2016;19:408–17.27552473 10.1097/MCO.0000000000000317 · doi ↗ · pubmed ↗
- 3Younossi ZM , Otgonsuren M, Henry L et al. Association of nonalcoholic fatty liver disease (NAFLD) with hepatocellular carcinoma (HCC) in the United States from 2004 to 2009. Hepatology 2015;62:1723–30.26274335 10.1002/hep.28123 · doi ↗ · pubmed ↗
- 4Younossi ZM. Non-alcoholic fatty liver disease—a global public health perspective. J Hepatol 2019;70:531–44.30414863 10.1016/j.jhep.2018.10.033 · doi ↗ · pubmed ↗
- 5Hagström H , Nasr P, Ekstedt M et al. Risk for development of severe liver disease in lean patients with nonalcoholic fatty liver disease: a long-term follow-up study. Hepatol Commun 2018;2:48–57.29404512 10.1002/hep 4.1124 PMC 5776871 · doi ↗ · pubmed ↗
- 6Wattacheril J , Sanyal AJ. Lean NAFLD: an underrecognized outlier. Curr Hepatol Rep 2016;15:134–9.27668144 10.1007/s 11901-016-0302-1PMC 5030075 · doi ↗ · pubmed ↗
- 7Kumar R , Mohan S. Non-alcoholic fatty liver disease in lean subjects: characteristics and implications. J Clin Transl Hepatol 2017;5:216–23.28936403 10.14218/JCTH.2016.00068 PMC 5606968 · doi ↗ · pubmed ↗
- 8Golabi P , Paik J, Fukui N et al. Patients with lean nonalcoholic fatty liver disease are metabolically abnormal and have a higher risk for mortality. Clin Diabetes 2019;37:65–72.30705499 10.2337/cd 18-0026 PMC 6336127 · doi ↗ · pubmed ↗