The effect of coffee thermocycling and color correction serum on the colorimetric properties and hardness of CAD‐CAM restorative materials
Hanan Al‐Johani

TL;DR
This study compares how different dental materials respond to coffee staining and color correction, finding that zirconia-reinforced materials perform best.
Contribution
The study introduces a novel comparison of colorimetric and mechanical properties of CAD-CAM materials under coffee thermocycling and color correction.
Findings
Zirconia-reinforced lithium silicate showed the best stain resistance and hardness.
Color correction serums effectively reversed coffee-induced staining in some materials.
Resin nanoceramic exceeded the perceptibility threshold for color change after coffee exposure.
Abstract
To compare the stainability, translucency, opalescence, whiteness, gloss, and hardness of 4 computer‐aided design and computer‐aided manufacturing (CAD‐CAM) restorative materials after simulated coffee drinking and color correction. Four CAD‐CAM blocks were investigated (n = 40): resin nanoceramic (Cerasmart, CS), polymer‐infiltrated ceramic network (Vita Enamic, VE), lithium disilicate glass ceramic (IPS e.max CAD, EC), and zirconia‐reinforced lithium silicate glass ceramic (Vita Suprinity, VS). The color stability (ΔE 00), relative translucency (RTP), opalescence (OP), and whiteness stability (ΔWID) were measured with a spectrophotometer. Gloss (GU) was recorded with a gloss meter, and hardness (HM) was detected with a Martens hardness testing device. The specimens were observed at baseline (T0), after coffee thermocycling (CTC) (T1), and after color correction (T2). ΔE 00 was…
Genes, proteins, chemicals, diseases, species, mutations and cell lines named across the full text — each resolved to its canonical identifier and authoritative record.
Click any figure to enlarge with its caption.
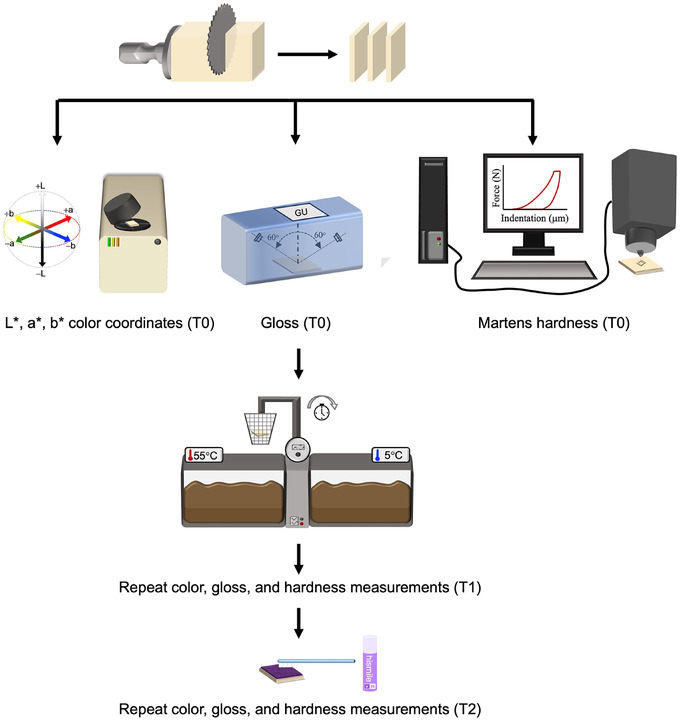 FIGURE 1
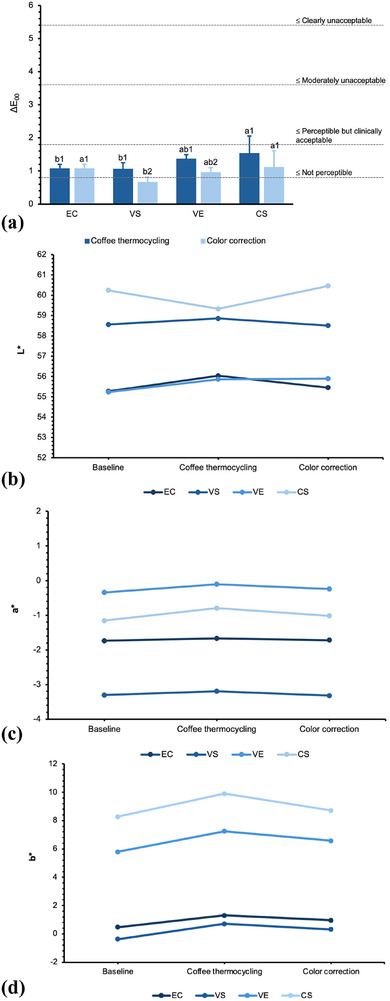 FIGURE 2
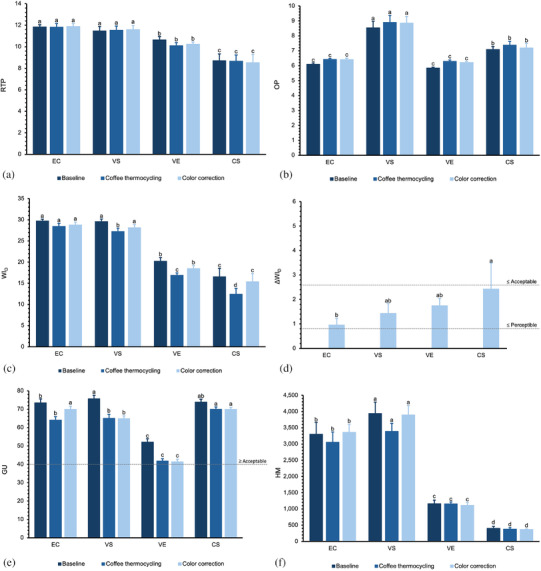 FIGURE 3
| Classification | Product name | Manufacturer | Chemical composition |
|---|---|---|---|
| Resin nanoceramics | CeraSmart | GC‐Corp |
Monomer: Bis‐MEPP, UDMA, DMA Filler: SiO2, barium glass |
| Polymer‐infiltrated ceramic network | Vita Enamic | Vita Zahnfabrik |
Monomer: UDMA, TEGDMA Filler: SiO2, Al2O3, Na2O, K2O, B2O3, ZrO2, CaO |
| Lithium disilicate glass‐ceramic | e.max CAD | Ivoclar Vivadent | SiO2, Li2O, K2O, P2O5, ZrO2, ZnO, Al2O3, MgO, pigments |
| Zirconia‐reinforced lithium silicate glass‐ceramic | Vita Suprinity | Vita Zahnfabrik | SiO2, Li2O, ZrO2, P2O5, Al2O3, K2O, CeO2, La2O3, pigments |
| Whitening gel | HiSmile | HiSmile Pty Ltd. | Glycerin, aqua/water, sorbitol, hydrated silica, xylitol, polysorbate 80, cellulose gum, Mentha piperita oil, phenoxyethanol, sucralose, tetrasodium pyrophosphate, Cl17200/D&C Red No. 33, Cl42090/FD&C Blue No. 1, ethylhexylglycerin |
| Parameter | Source of variation | Sum of squares | df |
|
|
|
|---|---|---|---|---|---|---|
| Δ | Material | 2.248 | 3 | 9.152 | <0.001 | 0.276 |
| Treatment | 1.882 | 1 | 22.985 | <0.001 | 0.242 | |
| Material × Treatment | 0.628 | 3 | 2.556 | 0.062 | 0.096 | |
| ΔWID | Material | 11.351 | 3 | 3.335 | 0.03 | 0.217 |
| Parameter | Sum of squares | df |
|
|
|
|---|---|---|---|---|---|
| WID | 28.459 | 6 | 5.782 | <0.001 | 0.325 |
| RTP | 1.941 | 6 | 1.179 | 0.327 | 0.089 |
| OP | 0.229 | 6 | 2.533 | 0.028 | 0.174 |
| GU | 353.281 | 6 | 24.55 | <0.001 | 0.672 |
| HM | 1,385,651.69 | 6 | 4.526 | <0.001 | 0.274 |
Peer Reviews
No public reviews on file for this paper yet. If you reviewed it on a platform where reviews are public (OpenReview, ICLR, NeurIPS, ICML), you can paste yours below so the community can read it here.
Videos
No videos yet. Explain this paper in a talk, walkthrough, or lecture? Add one.
Taxonomy
TopicsDental materials and restorations · Dental Erosion and Treatment · Coffee research and impacts
Advancements in computer‐aided design and computer‐aided manufacturing (CAD‐CAM) technologies have facilitated efficient manufacturing of monolithic dental restorations from restorative materials in an array of compositions.1 The longevity of monolithic CAD‐CAM restorations is contingent on their ability to fulfill high esthetic demands and deliver optimum mechanical performance.2 Traditionally, machinable glass‐ceramics have been at the forefront for prosthetic single‐unit applications by virtue of their superior esthetic and biocompatibility traits.3 In an attempt to enhance the mechanical durability of lithium disilicate glass‐ceramics (LD), a variety of filler reinforcements, namely zirconium dioxide (ZrO_2_) or ß‐spodumene (LiAlSi_2_O_6_), have been incorporated into the microstructure, giving rise to zirconia‐reinforced lithium silicates (ZLS) and lithium–aluminum disilicates.4, 5, 6 Furthermore, recently developed CAD‐CAM resin‐based materials such as the polymer‐infiltrated ceramic network (PICN) and resin nanoceramic (RNC) have also demonstrated comparable performance, proving them to be suitable alternatives to their machinable glass‐ceramic counterparts.7 While resin‐based materials offer advantages such as ease of milling and intraoral repair, they pose the risk of inferior wear resistance and, in turn, higher surface roughness, color change, and patient dissatisfaction.8, 9
Esthetic outcomes of monolithic dental restorations are conditional on their colorimetric properties, translucency, and stain resistance.10, 11 Additionally, inherent material properties such as chemical composition, microstructure, and filler loading considerably influence their optical behavior, surface integrity, and mechanical performance.12 Nevertheless, environmental intraoral dynamics may alter the appearance and sustainability of esthetic dental restorations due to temperature fluctuations and staining solutions such as coffee. Exposing dental restorative materials to coffee thermocycling (CTC) regimens induces residual stresses through thermal fluxes by means of highly concentrated colorant solutions, thus triggering physical‐chemical modifications within the surface layers and bulk material structure. The effects of CTC have been previously explored regarding LDs13, 14, 15, 16, 17, 18, 19 and ZLSs13, 15, 17, 18, 19, 20, 21; however, limited studies have investigated its impact on PICNs,14, 21, 22, 23 or RNCs.14, 24 Moreover, the existing literature evidence on CTC was conducted in relation to roughness,21, 24, 25, 26, 27 stainability,13, 14, 19, 20, 21, 22, 23, 24, 27, 28 translucency,14, 17, 19, 20, 22, 23, 27, 28 opalescence,17 Vickers hardness,27 fracture load,28 and flexural strength.15 The Martens hardness test uses instrumented indentation under load‐controlled settings to quantify parameters including hardness, elastic modulus, indentation depth, and creep, by virtue of objective force–displacement data, providing an accurate distinction between elastic, viscoelastic, and plastic responses.29 However, to date, no studies have assessed the influence of CTC on the whiteness, gloss, or Martens hardness of restorative dental materials.
Color correction serums such as the HiSmile v34 (Hismile Pty Ltd) have been recently introduced as hydrogen peroxide‐free temporary solutions to reverse the staining of discolored teeth.30 Therein, the radical‐free concept involves the application of violet and blue dyes to simultaneously incite the reflection of shorter visible light wavelengths from teeth, such as violet and blue, and suppress the reflection of longer wavelengths, such as yellow and brown.31 The effects of color correction serum were investigated in terms of natural tooth structures30, 32, 33; however, the inevitable proximity of dental restorations within the oral cavity heightens the demand for further exploration of their influence by color correction serums. To the best of the author's knowledge, no study has previously assessed the impact of color correction serums on CAD‐CAM restorative materials. Thereby, the null hypotheses were (1) CTC and color correction would not significantly affect the color stability, relative translucency, opalescence, whiteness stability, gloss, and hardness of CAD‐CAM restorative materials, and (2) different CAD‐CAM restorative materials would exhibit the same color stability, relative translucency, opalescence, whiteness stability, gloss, and hardness irrespective of the treatment.
MATERIALS AND METHODS
Figure 1 presents a summary of the study outline. Four CAD‐CAM blocks were investigated (n = 40): resin nanoceramic (CS: Cerasmart, GC‐Corp); polymer‐infiltrated ceramic network (VE: Vita Enamic, Vita Zahnfabrick); lithium disilicate glass ceramic (EC: IPS e.max CAD, Ivoclar Vivadent); and zirconia‐reinforced lithium silicate glass ceramic (VS: Vita Suprinity, Vita Zahnfabrik). All blocks were of similar shade (A1) and translucency level (HT) (Table 1). The sample size (n = 10 per material) was deemed sufficient to obtain a power of 90% based on a power analysis conducted in a similar study.34 The machinable blocks were sectioned into 12 × 14 × 1 mm slices using a slow‐speed diamond blade (MK 303, MK Diamond) mounted on a saw device (Isomet 1000 Precision Saw; Buehler Co.) under running water. Subsequently, both sides of the specimens were wet‐ground using a grinding device (MetaServ 250; Buehler Co.) with a sequence of silicon carbide papers (P400, P600, P1200, and P1500 grit; Buehler Co.) and polished with 0.15 µm diamond suspension (Meta Di Supreme; Buehler Co.). EC and VS specimens were crystallized in a furnace (Programat EP 5000; Ivoclar AG) according to the manufacturers' instructions. EC underwent a two‐step crystallization regime with a 403°C standby temperature, 6 min closing time, 90°C/min first heating rate, 820°C first firing temperature, and a 10 min first holding time, followed by a 30°C/min second heating rate, 840°C second firing temperature, a 7 min second holding time, and 700°C long‐term cooling. VS underwent a one‐step crystallization regime with a 400°C standby temperature, 4 min closing time, 55°C/min heating rate, 840°C firing temperature, and an 8 min‐holding time, followed by 680°C long‐term cooling. All specimens were cleaned ultrasonically in distilled water for 10 min (Ultrasonic Cleaning System; L&R Co). The outcomes of interest were measured at baseline (T0), after CTC (T1), and after color correction (T2).
Schematic representation of experimental study design. T0, baseline; T1, after coffee thermocycling; T2, after color correction.
Martens hardness of the specimens was calculated using a hardness testing machine (Z2.5; ZwickRoell Ltd) from the following equation: HM=FAs(h), where HM is the Martens hardness (N/mm^2^), F is the maximum load (N), As(h) is the surface area (mm^2^) of the indenter at a distance h from the tip. A force‐controlled setting was employed to impose 4 indentations per specimen of 3 mm spacing, with a 10 N load, at 0.5 mm/min‐speed, and a 10‐s dwell time.35 The Poisson ratio (v) was derived from previous studies (VS, EC = 0.216, VS = 0.208, VE and CS = 0.35, and diamond indenter = 0.07.12, 36, 37 Mean HM values were computed from the force‐indentation curves via the equipped software program (TestXpert; Zwick GmbH Co.).38, 39
Color measurements were determined with a benchtop UV–visible light spectrophotometer (LabScan XE; Hunter Associates Laboratory Inc.) with a 5‐mm aperture that utilized the Commission International de l'Eclairage Standard (CIE), a 10° human observer characteristics, and a D65 illuminant to record the color coordinates L*, a*, and b* within a wavelength range of 400–700 nm at 10 nm intervals.40 Three readings of L*, a*, and b* were obtained per specimen against a black background (L* = 0.01, a* = −0.02, b* = 0.01) and against a white background (L* = 90.35, a* = −1.31, b* = −0.27),41 and the average L*, a*, and b* values were recorded. The relative translucency parameter (RTP) was computed with the CIEDE2000 color difference formula: RTP=(LB−LWKLSL)2+(CB−CWKCSC)2+(ΔHKHSH)2+RT(ΔCKCSC)(ΔHKHSH),42 and the opalescence parameter (OP) was computed by: OP=(aB∗−aW∗)2+(bB∗−bW∗)2, where subscripts B and W refer to a ^^ and b ^^ coordinates against black and white settings.17, 43 Whiteness was reported using the whiteness index (WI_D_)44, 45 derived from L ^^, a ^^, and b ^*^ coordinates against a white background using the equation: WID=0.511L∗−2.324a∗−1.100b∗.
Gloss readings were obtained by a gloss meter (LS193; Shenzhen Linshang Technology Co) with a 60° projection angle.46 Specimens were positioned within a custom mold and covered with the glossmeter lid to ensure complete elimination of external light. Two gloss readings were recorded per specimen47 and the mean was reported in gloss units (GU), where GU = 0 is an absolute nonreflective surface and GU = 100 is an absolute refractive surface. Gloss was considered clinically acceptable when GU > 40, based on established thresholds.48
Subsequently, after baseline measurements, specimens were subjected to CTC of 10,000 cycles in a coffee solution (THE‐1100 thermocycler; SD Mechatronik) at 5°C and 55°C with a 30‐s dwell time and a 10‐s transfer, to simulate 1 year of intraoral use.49 A fresh solution was prepared and renewed every 12 h by adding 3.6 g of instant coffee powder (Nescafe Classic; Nestle) to 300 mL of hot water.18 After CTC, the specimens were cleaned of coffee residue by circumferential brushing 10 times with toothpaste (Crest; Procter and Gamble) and a soft‐bristle toothbrush under running water, then ultrasonically cleaned for 10 min in distilled water.50 Subsequently, specimens underwent 2 cycles of color correction treatment wherein 2 pumps of the color correction serum (HiSmile v34; Hismile Pty Ltd) were applied to a soft‐bristle toothbrush, and the specimens were gently brushed circumferentially for 2 min, then rinsed under running water for 1 min.30
L*, a*, and b* coordinates were remeasured at T1 and T2, and the color stability (ΔE 00) was computed using the CIEDE2000 color difference formula51 with the parametric factors set as 1. Color differences were deemed as imperceptible (ΔE 00 ≤ 0.8), perceptible (ΔE 00 > 0.8), perceptible but clinically acceptable (0.8 < ΔE 00 ≤ 1.8), moderately unacceptable (1.8 < ΔE 00 ≤ 3.6), clearly unacceptable (3.6 < ΔE 00 ≤5.4), or extremely unacceptable (ΔE 00 > 5.4).52 Likewise, RTP and OP measurements were also recomputed at T1 and T2. WI_D_ measurements were repeated at T2, and ΔWI_D_ was calculated by: ΔWID=WID2−WID0, where subscripts 0 and 2 refer to measurements recorded at the T0 and T2 time points. Whiteness differences were considered visually perceptible when ΔWI_D_ > 0.72 and acceptable when ΔWI_D_ < 2.62.53 To prevent unfavorable influence of hardness indentations on the colorimetric measurements, the color coordinates were obtained from the specimens’ side opposing the indentations.
Statistical analyses were performed by a software program (IBM SPSS Statistics, v29.0; IBM Corp). Data normality was confirmed by the Kolmogorov–Smirnov test, and homogeneity was confirmed by the Levene test. Two‐way ANOVA was employed to evaluate the effects of material type, treatment, and their interactions on the ΔE 00. One‐way ANOVA was used to assess the ΔWI_D_ among materials after color correction. A repeated measures one‐way ANOVA was used to analyze RTP, OP, WI_D_, GU, and HM (between‐subject factor: material, and within‐subject factor: time). Post hoc Tukey and Student t‐tests were employed to identify significant pairwise comparisons within and between different materials and treatment types (α = 0.05).
RESULTS
Mean ΔE 00 and changes in color coordinates L*, a*, and b* of the CAD‐CAM restorative materials after CTC and color correcting are illustrated in Figure 2 and descriptive ΔWI_D_, WI_D_, RTP, OP, GU, and HM data are presented in Figure 3. The ANOVA results of ΔE 00 and ΔWI_D_ are shown in Table 2, and the repeated measures ANOVA for WI_D_, RTP, OP, GU, and HM are shown in Table 3, wherein the Mauchly test was not significant (p > 0.05); therefore, the assumption of sphericity had not been violated.
(a) Color stability (ΔE 00). (b) Changes in the L color coordinate. (c) Changes in the a* color coordinate. (d) Changes in the b* color coordinate. EC, IPS e.max CAD; VS, VITA Suprinity; VE, VITA Enamic; CS, Cerasmart. Different letters reveal significant differences among different CAD‐CAM restorative materials within the same timepoint, and different numbers indicate differences within the same CAD‐CAM restorative material across different timepoints (p < 0.05).*
(a) Relative translucency (RTP), (b) opalescence (OP), (c) whiteness index (WID), (d) whiteness stability (ΔWID), (e) gloss (GU), (f) Martens hardness (HM). EC, IPS e.max CAD; VS, VITA Suprinity; VE, VITA Enamic; CS, Cerasmart; T0, baseline; T1, coffee thermocycling; T2, color correction. Different letters reveal significant differences among CAD‐CAM restorative materials within the same timepoint (p < 0.05).
TABLE 2: ANOVA table for color stability (ΔE 00) and whiteness stability (ΔWID) of CAD‐CAM restorative materials subjected to coffee thermocycling and color correction.
The ΔE_00_ was significantly impacted by both main factors, material (p < 0.001, η p ^2^ = 0.276) and treatment (p < 0.001, η p ^2^ = 0.242), while the interaction between both factors was not significant (p = 0.062). CS exceeded the perceptibility threshold at T1, whereas no materials surpassed the ΔE 00 acceptability threshold, regardless of the treatment type. CS displayed significantly higher ΔE 00 than EC and VS at T1 (p ≤ 0.005), and CS and EC had significantly higher ΔE 00 than VS at T2 (p ≤ 0.01). VS and VE exhibited lower ΔE 00 at T2, whereas EC and CS displayed similar ΔE 00 after both treatments (p ≥ 0.087). Regardless of treatment type, CS displayed the highest L* and b* coordinates, whereas VS had the lowest a* and b*.
RTP was considerably impacted by material (p < 0.001, η p ^2^ = 0.951), whereas the impact of treatment was not significant (p = 0.327, η p ^2^ = 0.089). Significantly higher RTP was observed in EC and VS, followed by VE, and lowest in CS (p < 0.001) across all treatment types. OP was impacted by material (p < 0.001, η p ^2^ = 0.957) and treatment (p = 0.028, η p ^2^ = 0.174). VS had significantly greater OP than other materials, followed by CS (p < 0.001), whereas EC and VE demonstrated similar OP throughout all treatments (p ≥ 0.109). WI_D_ was significantly influenced by material (p < 0.001, η p ^2^ = 0.989) and treatment (p < 0.001, η p ^2^ = 0.325). At T0 and T2, EC and VS demonstrated higher WI_D_ than VE and CS (p < 0.001). After CTC, EC showed significantly greater WI_D_, followed by VS, with the lowest values observed in CS (p < 0.001). VS, VE, and CS exhibited significantly higher WI_D_ at T2 than at T1. The ΔWI_D_ was impacted by material (p < 0.03, η p ^2^ = 0.217); all materials surpassed the ΔWI_D_ perceptibility limit, and CS exceeded the ΔWI_D_ acceptability limit. GU was affected by material (p < 0.001, η p ^2^ = 0.993) and treatment (p < 0.001, η p ^2^ = 0.672). Regardless of the treatment type, all materials exhibited acceptable gloss values when previous thresholds were considered.
HM was impacted by material (p < 0.001, η p ^2^ = 0.274) and treatment type (p < 0.001, η p ^2^ = 0.672). Irrespective of treatment type, the highest HM was exhibited by VS, followed by EC, and the least was detected in CS (p < 0.001).
DISCUSSION
CTC and color correction significantly altered the colorimetric properties and hardness of CAD‐CAM restorative materials. Moreover, irrespective of the treatment employed, different CAD‐CAM restorative materials displayed dissimilar colorimetric characteristics and hardness. Thus, both null hypotheses of the present study were rejected.
The novelty in this scientific body lies in its comprehensive characterization of chemically diverse CAD‐CAM restorative materials. Moreover, the implementation of CTC further enhances the clinical relevance of the study, as it provides an accurate simulation of coffee drinking among patients during a 1‐year period. Additionally, while previous studies have explored staining and color stability, the inclusion of a post‐staining color correction intervention herein, presents a practical clinical interpretation. Specimens were standardized in terms of shade, translucency, thickness, and polishing protocol. Furthermore, color‐coordinate readings were acquired against white and black settings to simulate the intraoral light reflectance of natural teeth.41 Thus, the differences revealed among the outcomes herein were assumed to be a by‐product of compositional variations among the tested materials (Table 1). ΔE 00 is a well‐established parameter frequently used to quantify the stainability of dental materials subjected to CTC.22, 24, 26 In the present study, significant differences were observed in the stainability among the tested materials after CTC and color correction; while the glass‐ceramics and PICN did not exceed previously reported clinical thresholds,52 RNC revealed perceptible color changes after CTC that dissipated upon color correction. Studies have also verified imperceptible color changes of glass‐ceramics after CTC owing to their resistance to hydrolytic degradation by virtue of the densely packed crystalline networks within.14, 15, 18 Some reported superior color stability in ZLSs,18 however, others demonstrated higher stain resistance in LDs.14, 19 Disparities in ΔE 00 findings could be attributed to inconsistencies in Li_2_Si_2_O_5_ crystal size and volume fraction that alter the surface absorption of colorants; EC is comprised of 70 vol% of 1.0–1.5‐µm crystals, whereas VS contains 60 vol% of 0.5–0.7‐µm crystals.5, 6 Additionally, the ΔE_00_ findings of VE verified its adequate color stability after 1 year of simulated coffee drinking, similar to other studies,23 which may be justified by the 86 wt% reinforcement with feldspathic ceramic crystals combined with the decreased monomer content that limited its water uptake. Nonetheless, the ΔE 00 values of VE were greater than those reported by Çakmak et al.27 and lower than those reported by others,14, 21 presumably because of the differences in CTC regimens and polishing protocols. Perceptible color changes in CS herein, align with the findings by Taşın et al.,14 and were rationalized by the increased water sorption of bisphenol A‐glycidyl methacrylate monomer present therein, which led to heightened discoloration of CS materials despite the 70% wt Si_2_O filler load. The color correction serum succeeded in reversing the CTC‐induced stains in VS and VE materials, whereas the effect of color correction of EC and Cs was negligible. Previous studies on the same serum have reported short‐term whitening effects; however, prolonged results were not evident.30, 32 The L ^^, a ^^, and b ^*^ varied among the tested materials, notwithstanding their consistent shade and translucency levels; CS were lighter and yellowish, while EC and VS displayed bluish‐green hues.
RTP was quantified based on the CIEDE2000 formula,18, 42 considering its improved fit of the CIELab color space and the correction of the nonuniformity within. The RTP findings in the present study were contingent on the type of material, whereas the effect of both treatments was irrelevant. Similar RTP values were reported for EC and VS after CTC18; however, the RTP values of VE and CS were lower than those stated in the literature,18, 23 which could be attributed to dissimilar polishing protocols23 or different shades. Alp et al.18 explored materials in B1 and 1M1 shades, while the present study employed the A1 shade. Therefore, lithium silicate‐based glass‐ceramics may be preferred as a restorative option over PICN and RNC when a more translucent appearance is required. The opalescence of dental materials transpires when the existing refractive index mismatch between the filler and the surrounding matrix exceeds 1.1, which renders visible light scattering and, in turn, the appearance of blue hues upon light reflection and orange hues upon light transmission.43 Previous studies reported the range of OP of monolithic CAD‐CAM structures as 5 < OP < 13,10, 17, 43 which was confirmed in the current study. Nonetheless, irrespective of the treatment group, the OP of VE was significantly higher than the other tested materials, which may be credited to the added 10 wt% ZrO_2_ therein. The whiteness index (WI_D_) used in the present study was chosen by virtue of its enhanced ability to objectively quantify whiteness in dental materials.44 At baseline, and after color correction, EC and VS exhibited similar WI_D_ values akin to those of esthetic dental materials in other studies,45, 54 and superior to that of VE and CS herein. When WI_D_ thresholds were considered,53 color corrections caused perceptible whiteness differences in EC, VS, and VE, and unacceptable whiteness differences in CS. Nonetheless, these preliminary findings proved that coffee‐induced discoloration of CAD‐CAM materials may be recovered through color correction serums.
GU of all tested materials was significantly reduced after both treatments, which may be a result of the acidic nature of the coffee solution that accelerated the chemical degradation and altered the light reflection and luster of surfaces. Nevertheless, all materials presented acceptable GU values48 and minor gloss changes when clinical thresholds were considered (< 20 GU).47
The Martens hardness test provides valuable insight into the wear behavior of CAD‐CAM materials through objective computation of their indentation resistance, thereby evading the subjective limitations associated with traditional optical hardness testing methods. In the present study, hardness was measured as a reflection of surface integrity after chemical and thermal exposure of CTC, thereby justifying the concurrent colorimetric changes. The HM findings revealed significantly higher HM among EC and VS compared to VE and CS across all treatment groups, which is consistent with previous findings.34, 39, 55 The disparity in HM among the tested materials is ostensibly conditional on the compositional and filler loading differences therein. Moreover, CTC yielded lower HM in EC and VS, which increased after color correction, possibly because of the manual removal of superficial coffee remnants during tooth brushing.
A main limitation of the current study resides in the nature of CTC, where complete immersion of specimens in the staining solution triggers amplified color changes, whereas the CAD‐CAM restorations are bonded intraorally to underlying substrates and thus are semi‐isolated from staining challenges. Moreover, the use of one thickness, a single staining solution, and no underlying cement could be deemed limitations, as other thicknesses, staining substances, and luting cements may alter the findings.8, 20, 56, 57 Another limitation was the concise duration of the color correction treatment; therefore, future studies should explore the impact of prolonged color correction regimes on the outcomes reported herein. Additionally, the specimens were not subjected to glazing or polishing protocols, which could be considered a limitation, as surface treatments may influence the staining resistance and hardness of CAD‐CAM restorative materials. Furthermore, the present findings would have benefitted from an investigation of the concurrent compositional and crystalline changes, using XRD, SEM‐EDX, or Raman analyses. Nonetheless, while a microstructural analysis is valid from a materials standpoint, it goes beyond the scope of this research, which focuses on the assessment of surface properties and clinically perceptible colorimetric changes rather than microscopic compositional alterations per se.
CONCLUSIONS
Zirconia‐reinforced lithium silicate glass‐ceramics demonstrated superior color stability, opalescence, and hardness when subjected to CTC and color‐correcting serum. Glass‐ceramics displayed greater translucency and whiteness than resin‐based CAD‐CAM restorative materials. The study findings support the promising potential of color correction serums as a temporary solution for the reversal of coffee‐induced staining in CAD‐CAM restorative materials.
CONFLICT OF INTEREST STATEMENT
The author declares no conflicts of interest.
The reference list from the paper itself. Each links out to its DOI / PubMed record.
- 1Spitznagel FA , Boldt J , Gierthmuehlen PC . CAD/CAM ceramic restorative materials for natural teeth. J Dent Res. 2018;97:1082–1091.29906206 10.1177/0022034518779759 · doi ↗ · pubmed ↗
- 2Ille CE , Jivănescu A , Pop D , Stoica ET , Flueras R , Niculescu T IC , et al. Exploring the properties and indications of chairside CAD/CAM materials in restorative dentistry. J Funct Biomater. 2025;16:46.39997580 10.3390/jfb 16020046 PMC 11856138 · doi ↗ · pubmed ↗
- 3Lubauer J , Belli R , Peterlik H , Hurle K , Lohbauer U . Grasping the lithium hype: insights into modern dental lithium silicate glass‐ceramics. Dent Mater. 2022;38:318–332.34961642 10.1016/j.dental.2021.12.013 · doi ↗ · pubmed ↗
- 4Zarone F , Ruggiero G , Leone R , Breschi L , Leuci S , Sorrentino R . Zirconia‐reinforced lithium silicate (ZLS) mechanical and biological properties: a literature review. J Dent. 2021;109:103661.33864886 10.1016/j.jdent.2021.103661 · doi ↗ · pubmed ↗
- 5Phark JH , Duarte S, Jr . Microstructural considerations for novel lithium disilicate glass ceramics: a review. J Esthet Restor Dent. 2022;34:92–103.34995008 10.1111/jerd.12864 · doi ↗ · pubmed ↗
- 6Zhang Y , Vardhaman S , Rodrigues CS , Lawn BR . A critical review of dental lithia‐based glass‐ceramics. J Dent Res. 2023;102:245–253.36645131 10.1177/00220345221142755 PMC 9947811 · doi ↗ · pubmed ↗
- 7Banh W , Hughes J , Sia A , Chien DCH , Tadakamadla SK , Figueredo CM , et al. Longevity of Polymer‐infiltrated ceramic network and zirconia‐reinforced lithium silicate restorations: a systematic review and meta‐analysis. Materials (Basel). 2021;14(17):5058.34501148 10.3390/ma 14175058 PMC 8434158 · doi ↗ · pubmed ↗
- 8Alpkilic DS , Ongul D , Isler Deger S . Stainability of different ceramic materials against mouth rinses and effect of polishing after staining. J Prosthet Dent. 2021;126:686.e 1–686.e 7.10.1016/j.prosdent.2021.06.00234538467 · doi ↗ · pubmed ↗