Detection of Copy‐Number Variations in CNS Tumours From Off‐Target Reads of Hybrid‐Capture Sequencing
Jan Schnorrenberg, Yannis Luca Adrian, Judith Schlathölter, Christian Ruckert, Judit Horvath, Werner Paulus, Martin Hasselblatt, Christian Thomas

TL;DR
This study shows that off-target sequencing data from small DNA panels can detect copy-number variations in brain tumors, matching results from traditional array methods.
Contribution
The study demonstrates that off-target reads from small hybrid-capture NGS panels can reliably detect clinically relevant CNVs in CNS tumors.
Findings
Off-target reads from small NGS panels detected 95% concordance with methylation array CNV profiles.
Focal amplifications and homozygous deletions were reliably identified using off-target reads.
Meningiomas and pilocytic astrocytomas showed WHO-relevant CNV alterations detectable via this method.
Abstract
Copy number variations (CNVs) play a central role in the classification, grading and prognostication of central nervous system (CNS) tumours. While genome‐wide methylation arrays are widely used for CNV profiling, next‐generation sequencing (NGS) panels are increasingly implemented in routine diagnostics. We hypothesised that off‐target sequencing reads from small hybrid‐capture panels not specifically designed for copy‐number detection can yield clinically actionable genome‐wide CNV profiles. We analysed 60 CNS tumour samples, including glioblastomas, oligodendrogliomas, ependymal tumours, medulloblastomas and choroid plexus tumours using a small‐scale custom hybrid‐capture panel (< 0,2 Mb) and compared CNV profiles inferred from sequencing reads to those obtained with methylation arrays. Additionally, 58 meningiomas and 6 pilocytic astrocytomas with BRAF fusions were profiled with the…
Genes, proteins, chemicals, diseases, species, mutations and cell lines named across the full text — each resolved to its canonical identifier and authoritative record.
Click any figure to enlarge with its caption.
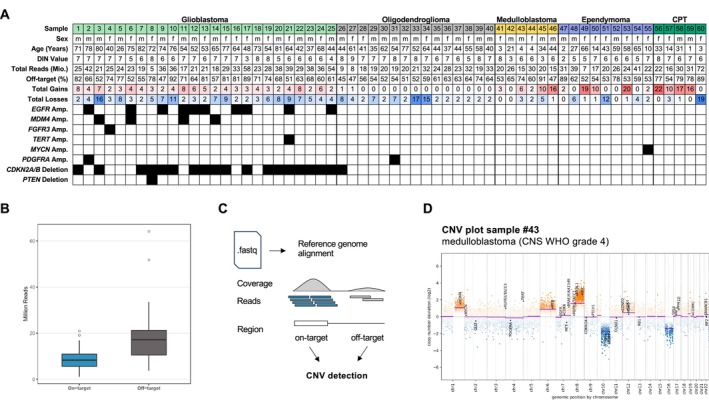 FIGURE 1
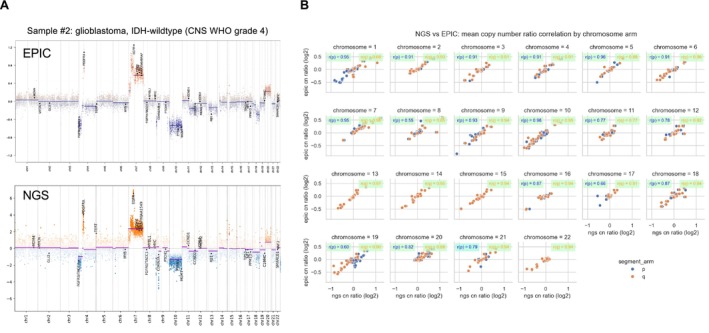 FIGURE 2
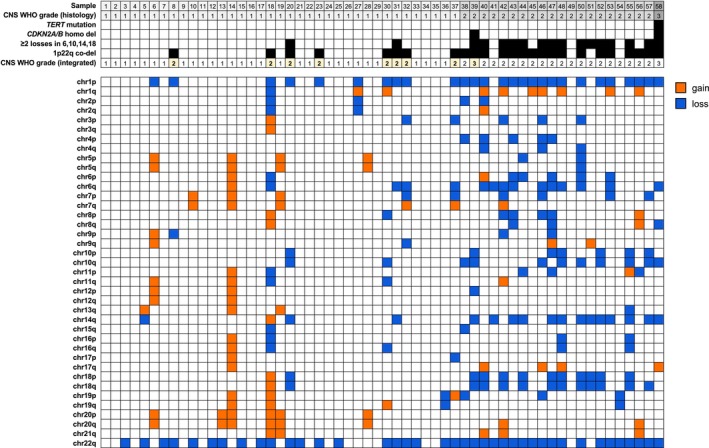 FIGURE 3
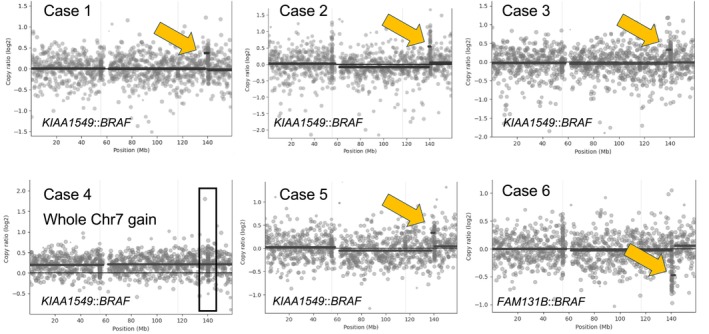 FIGURE 4
Peer Reviews
No public reviews on file for this paper yet. If you reviewed it on a platform where reviews are public (OpenReview, ICLR, NeurIPS, ICML), you can paste yours below so the community can read it here.
Videos
No videos yet. Explain this paper in a talk, walkthrough, or lecture? Add one.
Taxonomy
TopicsGlioma Diagnosis and Treatment · Genomic variations and chromosomal abnormalities · Neurofibromatosis and Schwannoma Cases
Introduction
1
Copy number variations (CNVs) have emerged as critical genomic alterations in the neuropathological evaluation of central nervous system (CNS) tumours, with essential roles in diagnostic classification, prognostic assessment and therapeutic decision‐making [1]. These alterations encompass a spectrum from large, chromosome‐wide changes to focal amplifications or deletions involving single genes [2]. Among the most clinically significant and historically recognised CNVs are the co‐deletion of chromosomal arms 1p and 19q [3], a defining feature of oligodendroglioma, IDH‐mutant and the +Chr7/−Chr10 signature characteristic of glioblastoma, IDH‐wildtype [4]. More recently, loss of Chr1p and MYCN amplification have been incorporated into the WHO classification as essential diagnostic markers for diffuse leptomeningeal glioneuronal tumour (DLGNT) and MYCN‐amplified spinal ependymoma, respectively, highlighting the broad diagnostic relevance of CNVs across tumour types [5, 6]. Furthermore, focal CNVs such as EGFR amplification in glioblastoma [2] and MYCN amplification in medulloblastoma [7], and CDKN2A/B homozygous deletion in IDH‐mutant astrocytoma [8] and meningioma [9] are particularly important for determining tumour grade and prognosis.
Copy‐number profiling is commonly performed using DNA methylation arrays or chromosomal microarrays; however, next‐generation sequencing (NGS) panels have increasingly been employed to extract CNV information alongside mutational data in a single assay [10, 11, 12, 13, 14]. In the context of CNS tumours, several studies have demonstrated the feasibility of detecting diagnostically relevant alterations such as 1p/19q co‐deletion, EGFR amplification and CDKN2A/B homozygous deletion from targeted panels that were specifically designed to capture copy‐number information, either through gene‐centric coverage or additional probes targeting broader genomic regions [12, 14]. While some assays incorporate tiling probes or genome‐wide SNP coverage to explicitly enable CNV detection [11, 15], an alternative approach leverages off‐target sequencing reads, that is, those that map outside of the intended capture regions, as a ‘side‐product’ of hybrid‐capture protocols [16, 17]. Although bioinformatic tools such as CNVkit [17] allow inference of CNVs from off‐target reads, this approach has not yet been systematically applied to CNS tumours or compared against established methods such as DNA methylation arrays. Thus, the diagnostic value and reliability of off‐target‐derived CNV profiles in neuro‐oncology remain largely unexplored. Nonetheless, the ability to extract copy‐number information from off‐target reads may significantly enhance the diagnostic yield of small‐scale targeted panels, particularly in settings where material is limited or the panel was not initially designed for CNV detection.
In this study, we explored the feasibility of generating genome‐wide copy‐number profiles from off‐target reads obtained with a small, custom‐designed 31‐gene hybrid‐capture gene panel lacking a specific CNV‐enabling probe design. We evaluated whether these profiles could reliably capture diagnostically relevant CNVs in CNS tumours and compared them to CNV profiles obtained from DNA methylation arrays, a current reference standard in CNS tumour diagnostics [2]. We aimed to determine whether off‐target read analysis offers a reliable, low‐cost complement to existing sequencing workflows.
Materials and Methods
2
Materials
2.1
Formalin‐fixed paraffin‐embedded (FFPE) samples from 60 CNS tumours across different entities (Table S1), plus 58 meningiomas (Table S2) and 6 pilocytic astrocytomas (Table S3), were retrieved from the archive of the Institute of Neuropathology in Münster. The use of biopsy specimens for research upon anonymisation was in accordance with local regulations of the University Hospital Münster and approved by the Münster ethics committee (2007‐420‐f‐S and 2017‐707‐f‐S).
DNA Isolation
2.2
Genomic DNA was extracted from FFPE samples using the Maxwell RSC FFPE Plus DNA Kit (AS1720, Promega, Madison, USA). DNA was eluted in 50 μL of 1 × TE buffer (pH 7.5; Promega) and quantified using the QuantiFluor ONE dsDNA System (Promega). DNA integrity (DIN) values and concentrations were assessed with the Genomic DNA ScreenTape Assay on the TapeStation platform (Agilent Technologies, Santa Clara, USA).
Library Preparation and Next‐Generation Sequencing
2.3
Genomic DNA integrity (DIN) and concentration were assessed using the Genomic DNA ScreenTape Assay on the TapeStation system (Agilent Technologies, Santa Clara, USA), with the region of interest set from 50 bp to > 60,000 bp. Libraries were prepared using different versions of custom hybrid‐capture panels (Twist Bioscience, San Francisco, USA), targeting genes selected exons, the TERT promoter and intronic regions for gene fusion detection in CNS tumour diagnostics (Table S4). Across the cohort, n = 10 samples were hybridised with panel version 2 (total size: 137 kb), n = 11 samples were hybridised with panel version 3 (total size: 161 kb) and n = 39 samples were hybridised with panel version 4 (total size: 171 kb). Fragmentation times and the number of PCR cycles were adjusted according to DIN values, following the manufacturer's recommendations. Final libraries were sequenced on an Illumina NextSeq platform (Illumina, San Diego, USA).
Bioinformatic Analysis of NGS Data
2.4
Copy‐number profiling was conducted using CNVkit, which uses both on‐target and off‐target reads from hybrid‐capture sequencing to infer genome‐wide copy‐number alterations [17]. On‐target read depth provides high resolution where probes are designed, while off‐target read depth is binned across the remainder of the genome to improve coverage uniformity and enable detection of large‐scale events beyond targeted regions. Coverage profiles for both target and antitarget bins are normalised and bias‐corrected using a reference constructed from a pooled cohort of normal samples or tumour samples with flat CNV profiles (n = 8) processed with the same panel and protocol, which mitigates systematic biases such as GC content and capture efficiency. After adapter trimming with fastp and alignment against the hg19 reference genome using BWA mem, CNVkit was run with default settings, and the reference coverage was used to calculate log2 copy‐ratio estimates for each bin across the genome.
For gene fusion analysis, paired‐end reads were aligned to the hg19 reference genome using STAR with chimeric read detection enabled. Fusion calling was subsequently performed with Arriba using the GENCODE v19 annotation together with curated databases of known fusions and blacklisted events. Standard filtering settings were applied. Fusion candidates were visualised using the Arriba plotting scripts and manually reviewed.
DNA Methylation Profiling
2.5
Following purification and bisulfite conversion using standard protocols, DNA methylation profiling was performed with the Infinium MethylationEPIC BeadChip array (Illumina, San Diego, USA), with 21 samples analysed on the EPIC (850 K) array and 39 on the EPICv2 (935 K) array. Tumour classification was carried out using the Heidelberg Brain Tumour Classifier (v12b8), and copy‐number alterations were inferred with the conumee2.0 R package [18].
Bioinformatic Analysis for Comparative CNV Analysis
2.6
Copy‐number segmentation (.seg) and bin (.igv) files were generated from DNA methylation data using the conumee2.0 R package, and copy‐number ratio files (.cnr) were derived from hybrid‐capture sequencing data using CNVkit. Comparative analyses were performed by calculating the correlation of copy‐number profiles both genome‐wide and on a per‐chromosome arm basis. Sex chromosomes were excluded from all correlation analyses. Data processing and statistical analyses were conducted in Python 3.13 using the pandas and numpy libraries, and visualisations were generated using matplotlib and seaborn. All analysis scripts are available on GitHub (https://github.com/yansch/cnv‐from‐ngs/). For the final genome‐wide CNV visualisation, the following genes or gene regions were highlighted: MDM4, MYCN, GLI2, FGFR3/TACC3, PDGFRA, TERT, MYB, EGFR, CDK6, MET, BRAF/KIAA1549, FGFR1/TACC1, MYBL1, MYC, CDKN2A, PTCH1, PTEN, MGMT, CCND1, CCND2, CDK4, MDM2, RB1, TP53, NF1, PPM1D, C19MC, SMARCB1 and NF2. For manual review, copy‐number profiles were visually inspected to identify chromosome arm–level gains or losses (defined as affecting ≥ 50% of the chromosomal arm) and focal amplifications or deletions.
Results
3
Study Cohort
3.1
Our cohort comprised 60 CNS tumours from 51 adult and 9 paediatric patients (27 female and 33 male), including IDH‐wildtype glioblastomas (n = 25), oligodendrogliomas (n = 15), ependymal tumours (n = 9), medulloblastomas (n = 6), and choroid plexus tumours (n = 5) (Figure 1A, Table S1). The average tumour cell content, as estimated from H&E slides, was 72% (range: 20%–95%, Table S1). Seven of 60 samples (12%) had a tumour cell content < 50%, all of which were from the infiltration zones of glioblastomas (samples #7, #11, #15, #16, #18, #21 and #25). All samples were analysed using the Illumina EPIC methylation array and classified with the v12.8 version of the Heidelberg CNS tumour classifier (median calibrated score: 0.99, Table S1).
Overview of the sample cohort and CNV detection strategy from NGS data. (A) Summary of the sample cohort, including clinical and genetic information. Black boxes indicate the presence of genetic alterations. DIN, DNA integrity number. (B) Box plots showing the distribution of on‐target and off‐target reads across all samples. (C) Schematic illustration of the CNV detection pipeline integrating both on‐target and off‐target sequencing reads. (D) Example CNV profile from sample #43 (medulloblastoma, CNS WHO grade 4), highlighting chromosomal gains and losses identified by the pipeline.
Genome‐wide copy‐number profiles generated with conumee 2.0 [18] identified 527 chromosomal arm‐wide changes with 253 chromosomal arm gains and 274 arm losses. Only one medulloblastoma (sample #42) and one posterior fossa subependymoma (sample #52) exhibited balanced CNV profiles without copy‐number variations. Glioblastomas largely displayed the expected signature of whole‐chromosome 7 gain with monosomy 10; only two cases harboured isolated 7q gains and one case an isolated 10q loss (Table S1). Among oligodendrogliomas, in addition to the canonical 1p/19q codeletion, 6 of 15 cases showed a total of 46 additional chromosomal arm losses, and 2 cases exhibited a single chromosomal arm gain. Across entities, choroid plexus tumours demonstrated the highest CNV burden (mean 17.6 chromosomal arm alterations per sample), followed by glioblastomas (9.5 per sample), ependymomas (8.9 per sample) and medulloblastomas (8 per sample), whereas oligodendrogliomas carried the lowest average number of CNVs (5.2 per sample).
Focal CNVs were most frequent in glioblastomas, with 17 amplifications detected across 13 cases. These included EGFR (n = 10), MDM4 (n = 4), FGFR3 (n = 1), TERT (n = 1) and PDGFRA (n = 1). The case with FGFR3 amplification (sample #4) harboured a FGFR3::MYH6 fusion detected by the NGS panel (Figure S1). Homozygous CDKN2A/B deletions were observed in 17 of 25 glioblastomas, and one case (sample #8) additionally showed homozygous PTEN loss on chromosome 10. In the remainder of the cohort, focal events were rare: one oligodendroglioma (sample #31) harboured a PDGFRA amplification, and another oligodendroglioma (sample #26) carried a homozygous CDKN2A/B deletion. Of diagnostic relevance, one spinal ependymoma (sample #55) exhibited a high‐level MYCN amplification.
Copy‐Number Profiling From Targeted Next‐Generation Sequencing Data
3.2
All samples were sequenced using a custom hybrid‐capture panel designed for neuropathology diagnostics (see Methods), yielding a median of 23.99 million reads (range: 5–72 million, Table S1). The majority of reads mapped off‐target (median: 17.18 million), whereas a smaller fraction represented on‐target reads (median: 8.32 million; Figure 1B). Mean on‐target coverage was 1304×, and only four of 60 samples had a mean target coverage below 500×. In all cases, more than 99% of targeted bases were covered at ≥ 50×. Notably, higher DNA quality, as reflected by increased DIN values, was significantly associated with lower off‐target rates (Pearson r = −0.44, p = 4.8 × 10^−4^; Figure S2). Leveraging both on‐ and off‐target reads (Figure 1C), we subsequently generated chromosome‐wide copy‐number profiles and incorporated custom gene annotations to highlight focal genomic alterations (Figure 1D).
We next compared copy‐number profiles generated from EPIC and NGS data across our cohort of 60 tumour samples (Figure 2). On visual inspection, chromosomal arm‐level copy‐number ratios showed high concordance (Figure 2A). Using length‐weighted mean log_2_ ratios per chromosomal arm (p and q) derived independently from CNVkit (.cnr) and EPIC/conumee (.igv) data, and classifying each arm as gain, loss or neutral based on ±0.5 log_2_ thresholds (excluding sex chromosomes), we observed a mean per‐sample arm‐level concordance of 0.95 (95%) between the two methods across all comparable arms. Similarly, correlation analysis of the log_2_ ratios derived from each method demonstrated high and significant concordance across all chromosomal arms (Figure 2B). Manual inspection confirmed a high agreement for each of the 253 chromosomal arm gains and 274 arm losses (Table S1, Figure S3). Focal events included both genes that were targeted by the panel (EGFR, FGFR3, PDGFRA, CDKN2A/B, PTEN, TERT) but also genes that were not specifically targeted by the panel (MYCN, MDM4). Across the cohort, all 19/19 focal amplifications were also detected by NGS, including 4 cases with MDM4 amplification and one spinal ependymoma with MYCN amplification (sample #55). In contrast, the interpretation of homozygous deletions proved more challenging. While several cases showed clear CDKN2A/B homozygous deletions (samples #1, #3, #8, #9, #10, #12, #13, #17, #20, #21, #22, #23 and #26), others (samples #6, #7, #14, #15, #24 and #25) were more ambiguous with respect to their homozygous versus heterozygous status on visual inspection (Figure S3). In addition, one glioblastoma with a PTEN homozygous deletion detected by EPIC was not identified by NGS (sample #8; Figure S3).
Concordance of CNV detection between targeted NGS and EPIC array platforms. (A) Representative genome‐wide comparison of copy‐number profiles generated from EPIC methylation array data (top) and targeted plus off‐target NGS reads (bottom) for sample #2 (IDH‐wildtype glioblastoma, CNS WHO grade 4). (B) Genome‐wide correlation of log2 copy‐number ratios obtained from EPIC and NGS data across 60 CNS tumour samples, demonstrating high concordance for both chromosomal arm‐level and focal copy‐number alterations. All correlations were statistically significant (p < 0.01).
NGS‐Based Copy‐Number Profiling for Meningioma Samples
3.3
According to the latest WHO classification of CNS tumours, TERT promoter mutations and homozygous CDKN2A/B deletions are recognised as independent criteria for upgrading meningiomas to CNS WHO grade 3, regardless of their histological features [1]. More recently, the Consortium to Inform Molecular and Practical Approaches to CNS Tumour Taxonomy (cIMPACT‐NOW) has proposed additional chromosomal arm copy‐number alterations as prognostic and/or grading markers. Specifically, co‐deletion of Chr 1p and 22q has been suggested as a molecular criterion for CNS WHO grade 2 classification, also independent of histopathological findings [9].
To investigate these molecular features, we used off‐target sequencing reads from 58 meningioma samples (37 CNS WHO grade 1, 20 CNS WHO grade 2, and 1 CNS WHO grade 3) using our small‐scale NGS panel to perform genome‐wide copy‐number profiling. Sequencing yielded a median of 24.41 million reads (range, 7.8–110.4 million reads, Table S2). The mean number of chromosomal arm copy‐number alterations was 3.46 for CNS WHO grade 1, 8.05 for CNS WHO grade 2 and 7 for the single CNS WHO grade 3 tumour (Figure 3, Table S2). The CNS WHO grade 3 meningioma harboured a TERT promoter mutation (C250T) and homozygous CDKN2A/B deletion, whereas all other cases were TERT wildtype. Notably, one tumour initially classified as CNS WHO grade 2 by histology demonstrated a homozygous CDKN2A/B deletion, resulting in its reclassification as CNS WHO grade 3.
NGS‐based copy‐number analysis in meningioma samples. Genome‐wide chromosomal arm‐level copy‐number profiles of 58 meningioma samples stratified by histological CNS WHO grade. Tumours of higher grade exhibited an increased CNV burden. Co‐deletion of chromosomes 1p and 22q was observed in a subset of CNS WHO grade 1 tumours, resulting in an upgrade of the integrated CNS WHO grade (yellow boxes), and in the majority of CNS WHO grade 2 tumours. Additional whole‐arm losses involving chromosomes 6, 10, 14 and 18 were enriched in higher‐grade tumours.
Co‐deletion of chromosomes 1p and 22q was identified in eight of 37 (22%) tumours with CNS WHO grade 1 morphology, supporting their reclassification to CNS WHO grade 2 according to the proposed molecular criteria [9]. Notably, 6 of these 8 meningiomas exhibited focal areas of increased cellular density and proliferative activity, whereas 2 tumours showed no atypical features and had low proliferation indices (1% and 3%, respectively). Sixteen of 20 (80%) CNS WHO grade 2 meningiomas exhibited 1p and 22q deletions. Two tumours with CNS WHO grade 1 morphology and 1p22q co‐deletion additionally showed ≥ 2 whole‐arm chromosomal losses involving chromosomes 6, 10, 14 and 18, a pattern associated with an increased risk of recurrence despite low histological grade [9]. These chromosomal alterations were observed in 14/20 (70%) of grade 2 meningiomas and in the CNS WHO grade 3 meningioma (Figure 3). We validated our NGS‐based copy‐number analysis using EPIC methylation arrays in 11 of 58 cases, including the CNS WHO grade 2 meningioma that was upgraded due to a homozygous CDKN2A/B deletion (sample #39); all validated cases showed concordant results (Table S2).
Focal Copy‐Number Alterations as Indicators of Gene Fusions
3.4
In our evaluation cohort, focal FGFR3 amplification served as an indicator of an FGFR3::MYH6 fusion, which was subsequently confirmed by fusion calling. We further analysed six pilocytic astrocytomas, five of which harboured KIAA1549::BRAF fusions and one that exhibited a FAM131B::BRAF fusion. KIAA1549::BRAF fusions typically result from small duplications on Chr 7q34, whereas FAM131B::BRAF fusions are associated with focal deletions on Chr 7q that are also detectable upon CNV calling from DNA methylation array data [2].
The six samples were sequenced at a median depth of 16.85 million reads (Table S3). Four of the five tumours with the characteristic KIAA1549::BRAF fusion showed focal copy‐number gains on Chr 7q (Figure 4), whereas Case 4 demonstrated gain of the entire Chr 7 without evidence of focal copy‐number alteration. As expected, the pilocytic astrocytoma harbouring the FAM131B::BRAF fusion displayed a focal loss on Chr 7q (Figure 4).
Focal copy‐number alterations in BRAF‐fused pilocytic astrocytomas. Copy‐number profiles of chromosome 7 for six pilocytic astrocytoma cases harbouring BRAF fusions. Arrows highlight focal copy‐number changes at the BRAF fusion locus. Case 4 shows a gain of the entire chromosome 7 rather than a focal alteration. The corresponding fusion partners are indicated below each panel (KIAA1549::BRAF or FAM131B::BRAF).
Discussion
4
Next‐generation sequencing has become a standard approach for detecting mutations and gene fusions in diagnostic neuropathology [12, 13, 19]. The vast majority of NGS panels are hybrid‐capture‐based, enriching predefined genomic regions using targeted oligonucleotides. However, this approach inevitably generates off‐target reads due to non‐specific probe hybridization, which are typically discarded during standard bioinformatic pipelines. Here, we show that these off‐target reads from a minimal (< 0.2 Mb) custom NGS panel, solely designed for mutation and fusion detection without tiling probes specifically designed for CNV calling [11], can reliably generate genome‐wide CNV profiles in CNS tumour samples. Although bioinformatic tools for copy‐number detection from targeted NGS data initially focused on depth of coverage in on‐target regions [20], methods that incorporate off‐target reads, such as cnvOffSeq [21], CopywriteR [16] and CNVkit [17] have long been available, yet they have not been systematically evaluated for copy‐number profiling in diagnostic (neuro)pathology.
At the chromosomal arm level, these profiles achieved near‐perfect concordance with methylation array‐derived CNVs across key diagnostic entities, such as the +7/−10 signature in IDH‐wildtype glioblastoma and 1p/19q codeletion in oligodendroglioma [1]. However, in tumours with marked deviations from the normal diploid state, particularly choroid plexus tumours, interpretation of relative copy‐number variations may be more challenging, as absolute ploidy changes shift the baseline against which gains and losses are assessed. Focal, high‐level amplifications were fully recapitulated (19/19), encompassing EGFR, MDM4 and MYCN alterations with immediate diagnostic or prognostic relevance in glioblastoma and ependymoma [1, 6]. Notably, whereas EGFR is intentionally enriched (on‐target) by the panel, MDM4 and MYCN were not specifically targeted, with all reads supporting their amplification detection derived exclusively from off‐target sequences. In contrast, interpretation of homozygous CDKN2A/B deletions proved more challenging, with ambiguous deletion status in 6 of 19 cases. This limitation is not unique to our approach, as commonly used tools such as conumee2 applied to DNA methylation array data show a sensitivity of only 60.9% when compared with SNP arrays [18]. Accordingly, additional confirmatory testing may be required for unresolved cases, particularly in samples with low tumour cell content. Another discordant finding was a PTEN homozygous deletion detected by EPIC in one glioblastoma that was not identified by NGS, despite complete on‐target coverage of all PTEN exons.
Extending this approach to meningiomas further underscores its clinical value: we detected CDKN2A/B homozygous deletions and codeletions of 1p and 22q, facilitating molecular upgrading in 16% of histologically lower grade tumours, in line with recent cIMPACT‐NOW recommendations and WHO classification updates [9, 22]. These alterations, along with additional chromosomal losses (e.g., 6, 10, 14 and 18), are associated with increased recurrence risk and poorer prognosis [9], supporting risk stratification beyond histology alone. Our findings align with methylation‐based studies showing that CNV burden correlates with meningioma aggressiveness [23], while showing that off‐target NGS can deliver comparable insights concurrently with on‐target data on diagnostically relevant TERT promoter mutations. However, a limitation of the present approach is that it remains unclear to what extent very small or low‐level chromosomal arm alterations (e.g., < 10% of an arm), such as those described for 1p loss in meningiomas, can be detected, particularly in the setting of variable tumour purity and ploidy.
Focal copy‐number events may act as indicative genomic patterns suggestive of underlying gene fusions and should prompt gene fusion analysis. Examples include 7q34 duplications indicative of BRAF‐rearranged low‐grade gliomas [2, 24], chromothripsis associated with ZFTA‐fused ependymomas [25] and FGFR3 focal gains implicated in FGFR3::TACC3 fusions [26].
In summary, our findings show that copy‐number information can be extracted from diagnostic NGS panel sequencing data as an additional, easily implementable tool for genome‐wide CNV assessment in CNS tumours. By leveraging sequencing data that are already generated, this approach can be integrated into existing diagnostic workflows without additional costs and can shorten the time to an integrated diagnosis, particularly when characteristic patterns such as 1p/19q codeletion or +7/−10 are readily apparent.
Funding
The authors have nothing to report.
Conflicts of Interest
The authors declare no conflicts of interest.
Supporting information
Figure S1: nan70070‐sup‐0001‐Figure_S1.pdf. ** FGFR3::MYH6 fusion in a glioblastoma with FGFR3 amplification.** A, CNV profile showing FGFR3 amplification. B, Fusion analysis with arriba revealed a FGFR3::MYH6 fusion with 119 split and 87 discordant reads.
Figure S2: nan70070‐sup‐0002‐Figure_S2.pdf. Correlation of DIN values and off‐target reads. Correlation analysis shows a relationship between higher DIN values and lower number of off‐target reads (r = −0.44, p = 4.8 x 10^−4^).
Figure S3: Comparative visualisation of genome‐wide copy‐number profiles derived from DNA methylation arrays and next‐generation sequencing for all 60 analysed cases.
Table S1: Neuropathological, genetic and epigenetic characteristics of the 60 CNS tumour samples.
Table S2: Neuropathological and genetic characteristics from 58 meningioma samples.
Table S3: Neuropathological and genetic characteristics of 6 pilocytic astrocytomas.
Table S4: Technical specifications and design features of the different versions of the custom hybrid‐capture next‐generation sequencing panel.
The reference list from the paper itself. Each links out to its DOI / PubMed record.
- 1D. N. Louis , A. Perry , P. Wesseling , et al., “The 2021 WHO Classification of Tumors of the Central Nervous System: A Summary,” Neuro‐Oncology 23, no. 8 (2021): 1231–1251.34185076 10.1093/neuonc/noab 106PMC 8328013 · doi ↗ · pubmed ↗
- 2D. Capper , D. Stichel , F. Sahm , et al., “Practical Implementation of DNA Methylation and Copy‐Number‐Based CNS Tumor Diagnostics: The Heidelberg Experience,” Acta Neuropathologica 136, no. 2 (2018 Aug): 181–210.29967940 10.1007/s 00401-018-1879-y PMC 6060790 · doi ↗ · pubmed ↗
- 3G. Reifenberger and D. N. Louis , “Oligodendroglioma: Toward Molecular Definitions in Diagnostic Neuro‐Oncology,” Journal of Neuropathology and Experimental Neurology 62, no. 2 (2003 Feb): 111–126.12578221 10.1093/jnen/62.2.111 · doi ↗ · pubmed ↗
- 4S. H. Bigner , J. Mark , P. C. Burger , et al., “Specific Chromosomal Abnormalities in Malignant Human Gliomas,” Cancer Research 48, no. 2 (1988): 405–411.3335011 · pubmed ↗
- 5M. Y. Deng , M. Sill , J. Chiang , et al., “Molecularly Defined Diffuse Leptomeningeal Glioneuronal Tumor (DLGNT) Comprises Two Subgroups With Distinct Clinical and Genetic Features,” Acta Neuropathologica 136, no. 2 (2018 Aug): 239–253.29766299 10.1007/s 00401-018-1865-4 · doi ↗ · pubmed ↗
- 6D. R. Ghasemi , M. Sill , K. Okonechnikov , et al., “MYCN Amplification Drives an Aggressive Form of Spinal Ependymoma,” Acta Neuropathologica 138, no. 6 (2019 Dec): 1075–1089.31414211 10.1007/s 00401-019-02056-2PMC 6851394 · doi ↗ · pubmed ↗
- 7E. C. Schwalbe , J. C. Lindsey , M. Danilenko , et al., “Molecular and Clinical Heterogeneity Within MYC‐Family Amplified Medulloblastoma Is Associated With Survival Outcomes: A Multicenter Cohort Study,” Neuro‐Oncology 27, no. 1 (2025): 222–236.39377358 10.1093/neuonc/noae 178PMC 11726341 · doi ↗ · pubmed ↗
- 8D. N. Louis , P. Wesseling , K. Aldape , et al., “c IMPACT‐NOW Update 6: New Entity and Diagnostic Principle Recommendations of the c IMPACT‐Utrecht Meeting on Future CNS Tumor Classification and Grading,” Brain Pathology 30, no. 4 (2020 Jul): 844–856.32307792 10.1111/bpa.12832 PMC 8018152 · doi ↗ · pubmed ↗