Development and multicenter validation of a predictive model for malignant pleural effusion recurrence
Xin Hu, Yongjie Jiang, Yiluo Heibi, Li Jiang, Yuying Li

TL;DR
Researchers created a machine learning model to predict if lung cancer patients will experience a recurrence of malignant pleural effusion within 3 months.
Contribution
A novel Elastic Net machine learning model using four routine clinical features for predicting MPE recurrence was developed and validated.
Findings
The model achieved high performance with AUCs of 0.848 and 0.940 in external validation.
It outperformed other machine learning approaches in predicting MPE recurrence.
An interactive risk stratification tool was developed to classify patients into four risk groups.
Abstract
Early prediction of malignant pleural effusion (MPE) recurrence within 3 months is essential for optimizing management in lung cancer patients. This study developed and validated a machine learning model to estimate the 3-month recurrence risk of MPE in patients with newly diagnosed lung cancer. Using data from 221 patients for model training and 237 from two external validation cohorts, the Elastic Net model—based solely on four routine clinical features (treatment regimen, alanine aminotransferase, total pleural effusion volume, and tumor diameter)—achieved excellent performance, with areas under the curve of 0.848 and 0.940 in external validation. The model significantly outperformed other machine learning approaches. An interactive risk stratification tool was further developed to classify patients into four risk groups, enabling early identification and individualized management of…
Genes, proteins, chemicals, diseases, species, mutations and cell lines named across the full text — each resolved to its canonical identifier and authoritative record.
Click any figure to enlarge with its caption.
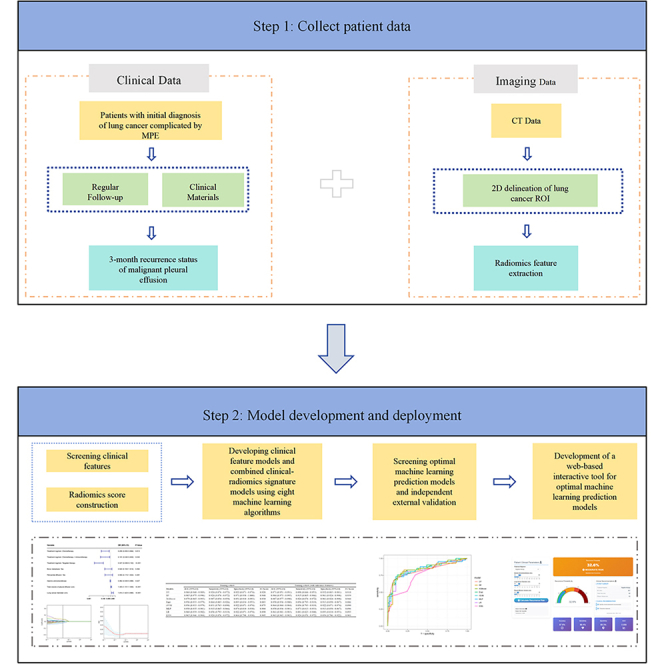 Figure 1
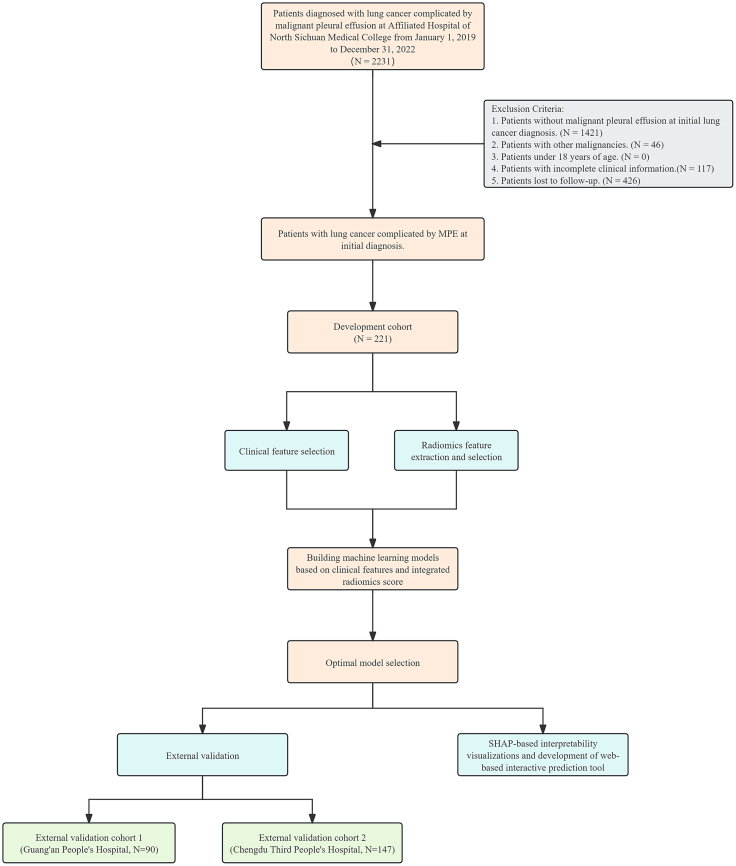 Figure 2
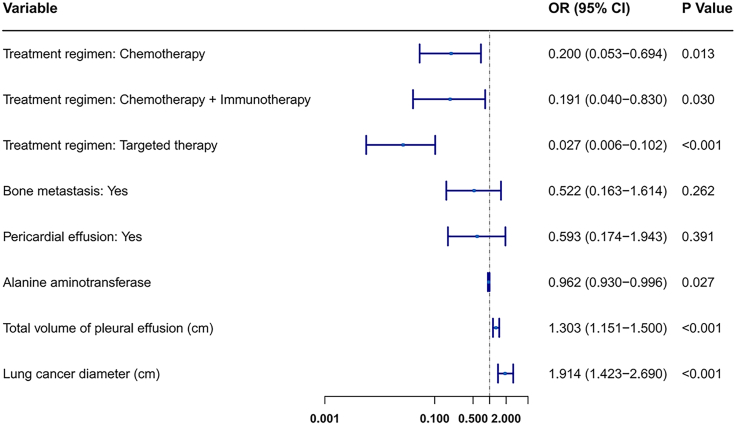 Figure 3
 Figure 4
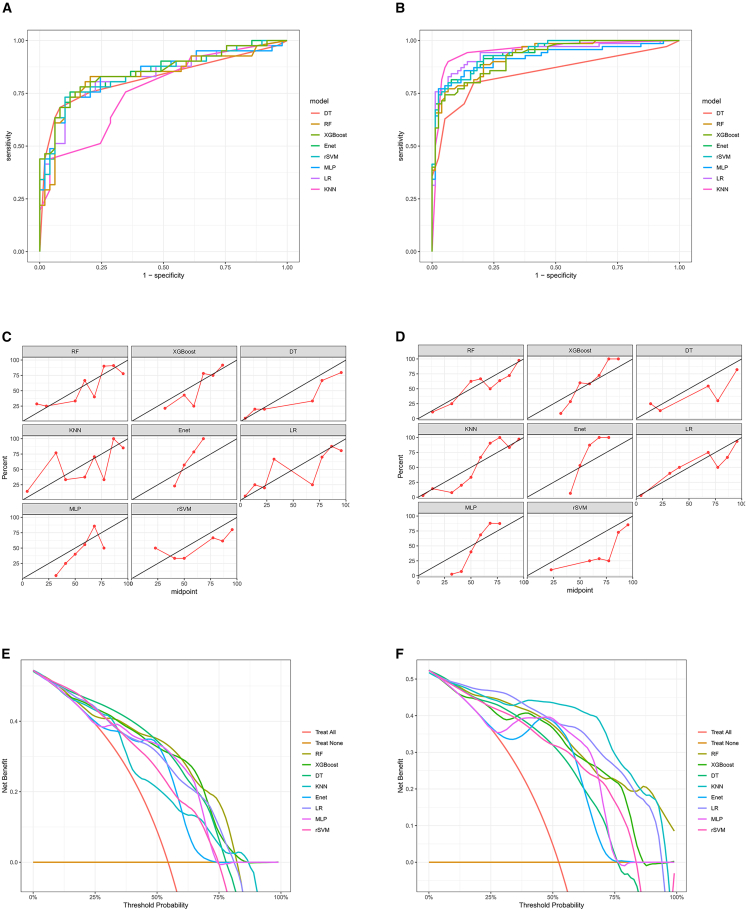 Figure 5
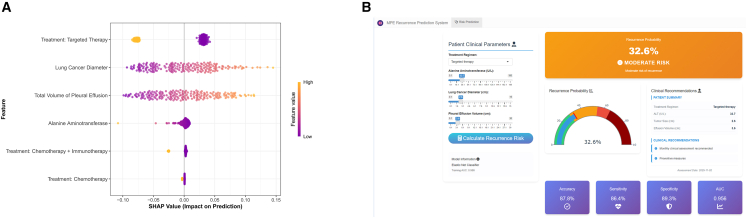 Figure 6
Peer Reviews
No public reviews on file for this paper yet. If you reviewed it on a platform where reviews are public (OpenReview, ICLR, NeurIPS, ICML), you can paste yours below so the community can read it here.
Videos
No videos yet. Explain this paper in a talk, walkthrough, or lecture? Add one.
Taxonomy
TopicsPleural and Pulmonary Diseases · Occupational and environmental lung diseases · Lung Cancer Diagnosis and Treatment
Introduction
Malignant pleural effusion (MPE) is a common complication of advanced lung cancer, closely associated with poor patient prognosis.1 MPE most frequently occurs in lung cancer, especially advanced stages, followed by breast cancer, lymphoma, gynecological cancers, and malignant mesothelioma.2^,^3 The presence of MPE at the initial diagnosis of lung cancer not only significantly reduces overall survival but also complicates treatment strategies.4^,^5
Although systemic therapy and local pleural interventions can achieve initial control of MPE, recurrence after initial treatment remains a common and clinically significant outcome. MPE recurrence signifies disease progression, exacerbates symptoms, often necessitates repeated invasive procedures, and further diminishes survival expectancy and quality of life.6 Early identification of patients at high risk of recurrence enables intensified monitoring, prophylactic interventions, individualized treatment escalation, and optimized palliative care planning.
Current prognostic models for lung cancer primarily focus on overall survival or initial treatment response prediction. Research specifically targeting risk stratification for MPE recurrence after completion of initial treatment is remains limited.7^,^8 Moreover, high-precision models often require complex or expensive biomarker testing, limiting their practical clinical application. Feature extraction methods from medical images based on computed tomography (CT) scans have emerged as a novel approach to enhance prediction accuracy.9^,^10^,^11 Imaging indicators such as tumor size, texture features, and morphological changes may provide important insights into MPE recurrence risk. The application of artificial intelligence (AI), particularly deep learning, has shown great promise in revolutionizing lung cancer diagnosis. For example, state-of-the-art approaches have successfully utilized deep learning models like convolutional neural networks to analyze next-generation sequencing data, achieving high accuracy in identifying genetic biomarkers.12 Our study complements these genomics-focused efforts by demonstrating the significant predictive power of routinely available clinical data. Therefore, this study focused on developing a computational model using routinely accessible clinical parameters and CT radiomics features to accurately predict the probability of MPE recurrence.
Results
Patient features
Based on inclusion and exclusion criteria, this study enrolled 221 patients from Affiliated Hospital of North Sichuan Medical College as the training cohort, 90 patients from Guang’an People’s Hospital as external validation cohort 1, and 147 patients from Chengdu Third People’s Hospital as external validation cohort 2 (Figure 1). In the training cohort, 103 patients (46.6%) did not experience pleural effusion recurrence beyond three months. In external validation cohort 1, 49 patients (54.4%) did not experience recurrence beyond three months. In external validation cohort 2, 77 patients (52.4%) did not experience recurrence beyond 3 months. Tables S1 and S2 detail the clinical characteristics of patients in the training and external validation cohorts.Figure 1. Flow chart for studying the risk factors and predictive models of recurrent MPE in patients initially diagnosed with lung cancer complicated by MPE
Clinical feature analysis and screening
Univariate logistic regression analysis was performed on all clinical features in the training cohort (Table 1), identifying significant features at p < 0.05: treatment regimen, bone metastasis, pericardial effusion, alanine aminotransferase (ALT), total volume of pleural effusion, and lung cancer diameter. Further multivariate logistic regression analysis retained features with p < 0.05 for model construction, ultimately identifying four core variables: treatment regimen, ALT, total volume of pleural effusion, and lung cancer diameter (Figure 2). These were incorporated into machine learning model development. Within the observed range, a higher ALT was a protective factor against MPE recurrence within 3 months, while a larger total volume of pleural effusion and larger lung cancer diameter were risk factors for MPE recurrence within 3 months.Table 1. Results of univariate logistic regression analysisNo recurrence of MPE within 3 monthsRecurrence of MPE within 3 monthsp valuen103118Gender = Woman (%)46 (44.7)54 (45.8)0.977Age = ≥60 (%)63 (61.2)87 (73.7)0.064Pathological subtype of lung cancer (%)0.521 Adenocarcinoma79 (76.7)97 (82.2) Squamous cell carcinoma13 (12.6)13 (11.0) Small cell lung cancer11 (10.7)8 (6.8)Qualitative assessment of mucoprotein in pleural fluid = Positive (%)99 (96.1)112 (94.9)0.917Clarity of pleural effusion (%)0.507 Clear6 (5.8)6 (5.1) Slightly turbid40 (38.8)55 (46.6) Turbid57 (55.3)57 (48.3)Pleural effusion coagulation status = Coagulation (%)6 (5.8)8 (6.8)0.989Location of pleural effusion (%)0.372 Left side38 (36.9)40 (33.9) Right side55 (53.4)59 (50.0) Both sides10 (9.7)19 (16.1)Treatment regimen (%)<0.001 Untreated8 (7.8)81 (68.6) Chemotherapy18 (17.5)23 (19.5) Chemotherapy + Immunotherapy12 (11.7)8 (6.8) Targeted therapy65 (63.1)6 (5.1)Smoking = Yes (%)46 (44.7)49 (41.5)0.739Drinking = Yes (%)33 (32.0)34 (28.8)0.709Family history of tumors = Yes (%)2 (1.9)4 (3.4)0.806Previous tumor history = Yes (%)10 (9.7)10 (8.5)0.933Primary tumor site = Right (%)61 (59.2)77 (65.3)0.433Cerebral infarction = Yes (%)17 (16.5)13 (11.0)0.322Hypertension = Yes (%)15 (14.6)23 (19.5)0.43Diabetes = Yes (%)9 (8.7)13 (11.0)0.734Respiratory tract infection = Yes (%)53 (51.5)73 (61.9)0.155Venous thrombosis = Yes (%)11 (10.7)16 (13.6)0.655Hypoxemia = Yes (%)17 (16.5)14 (11.9)0.426Cardiovascular disease = Yes (%)3 (2.9)8 (6.8)0.313Electrolyte imbalance = Yes (%)36 (35.0)41 (34.7)1Respiratory failure = Yes (%)11 (10.7)13 (11.0)1Acid base imbalance = Yes (%)7 (6.8)7 (5.9)1Pulmonary disease = Yes (%)29 (28.2)29 (24.6)0.653Bone metastasis = Yes (%)38 (36.9)24 (20.3)0.01Brain metastasis = Yes (%)11 (10.7)6 (5.1)0.192Adrenal metastasis = Yes (%)2 (1.9)3 (2.5)1Liver metastasis = Yes (%)8 (7.8)8 (6.8)0.982Pericardial effusion = Yes (%)16 (15.5)33 (28.0)0.04Intrapulmonary metastases = Yes (%)29 (28.2)43 (36.4)0.243High sensitivity C reactive protein in pleural fluid (mg/L), mean (SD)13.61 (19.61)11.01 (13.96)0.253Total protein in pleural fluid (g/L), mean (SD)43.92 (8.54)44.52 (9.82)0.629Adenosine deaminase in pleural fluid (U/L), mean (SD)12.21 (9.24)11.49 (8.37)0.539Glucose in pleural fluid (mmol/L), mean (SD)6.10 (3.35)9.74 (35.50)0.3Lactate dehydrogenase levels in pleural fluid (U/L), mean (SD)656.93 (1,007.41)611.16 (433.37)0.654Nucleated cell count in pleural fluid, mean (10E6/L) (SD)2,958.17 (8,007.65)2,239.96 (3,008.54)0.367Percentage of multinucleated cells in pleural fluid, mean (SD)37.33 (91.18)24.44 (20.52)0.137Percentage of mononuclear cells in pleural fluid, mean (SD)71.46 (23.68)74.61 (20.83)0.294Aspartate aminotransferase (U/L), mean (SD)26.35 (23.52)24.18 (13.41)0.392Alanine aminotransferase (U/L), mean (SD)24.27 (29.07)18.25 (13.23)0.044Albumin in pleural fluid (g/L), mean (SD)37.04 (4.25)36.82 (4.78)0.721Serum creatinine level (umol/L), mean (SD)65.18 (23.54)62.81 (22.65)0.447Neutrophil count in blood (10E9/L), mean (SD)5.72 (2.64)6.06 (3.80)0.437White blood cells (10E9/L), mean (SD)7.74 (2.83)8.02 (3.92)0.557Red blood cells (10E12/L), mean (SD)4.27 (0.61)4.29 (0.60)0.766Hemoglobin level (g/L), mean (SD)124.28 (19.11)126.01 (19.80)0.512Platelets (10E9/L), mean (SD)245.17 (96.67)234.71 (86.90)0.398Total volume of pleural effusion (cm), mean (SD)7.69 (3.02)13.87 (4.22)<0.001Lung cancer diameter (cm), mean (SD)3.29 (1.57)6.23 (1.85)<0.001Figure 2Multivariate analysis of independent predictors for 3-month MPE recurrenceThe forest plot displays the four independent clinical predictors retained after multivariate logistic regression analysis. For each variable, the plot shows the adjusted odds ratio (OR) with its 95% CI. An OR > 1 indicates a risk factor, while an OR < 1 indicates a protective factor.
Machine learning model evaluation
Based on the 221 patients in the training cohort, chest CT image data for all these patients were obtained. Radiomics analysis extracted 1,223 radiomics features, from which 8 radiomics signatures were ultimately selected. The radiomics score was then calculated based on these 8 selected signatures (Figure S1 and Table S3). Using the clinical features and the combination of clinical features with the radscore from these 221 patients, eight machine learning models were built to predict the probability of MPE recurrence within 3 months in lung cancer patients with MPE.
Results from the eight machine learning models showed: among models built on clinical features alone, the RF model had the highest area under the curve (AUC) (0.985, 95% CI: 0.975–0.996) (Figure 3A). Among models built on clinical features combined with the radiomics score, the XGBoost model had the highest AUC (0.987, 95% CI: 0.977–0.998) (Figure 3B). Notably, the difference in AUC between the eight models built on clinical features alone and those built on the combined features was not statistically significant (Table 2). Decision curve analysis (DCA) indicated that models based on both clinical features alone and the combined features provided substantial clinical benefit (Figures 3C and 3D). Calibration curves further confirmed the superior predictive performance of models built on clinical features and the combined features (Figures 3E and 3F). Furthermore, the 5-fold cross-validation performed on the training cohort confirmed the robustness of these models without signs of overfitting (Figure S2). In summary, given their simplicity and predictive accuracy, clinical features alone were chosen as the preferred indicators for building machine learning models.Figure 3. Performance comparison of prediction models in the training cohort(A) ROC curves of the eight models built on clinical features alone.(B) ROC curves of the models built on the combination of clinical features and the radiomics score.(C) DCA for the clinical feature-based models. The net benefit of using each model for clinical decision-making is plotted against the threshold probability.(D) DCA for the combined feature-based models.(E) Calibration curves for the clinical feature-based models.(F) Calibration curves for the combined feature-based models.Table 2. Performance comparison of clinical feature-based models versus clinical and radiomics feature-based models in the training cohortModelsTraining cohortTraining cohort (with radiomics features)AUC1 vs. AUC2AUC1 (95% CI)Sensitivity (95% CI)Specificity (95% CI)Accuracy (95% CI)F1 ScoreAUC2 (95% CI)Sensitivity (95% CI)Specificity (95% CI)Accuracy (95% CI)F1 Scorep valueDT0.968 (0.948–0.989)0.924 (0.876–0.972)0.922 (0.871–0.974)0.923 (0.888–0.958)0.9280.971 (0.951–0.991)0.898 (0.844–0.953)0.932 (0.883–0.981)0.914 (0.877–0.951)0.9180.837RF0.985 (0.975–0.996)0.924 (0.876–0.972)0.971 (0.938–1.000)0.946 (0.916–0.976)0.9480.984 (0.973–0.995)0.915 (0.865–0.966)0.961 (0.924–0.998)0.915 (0.865–0.966)0.9390.897XGBoost0.979 (0.965–0.993)0.907 (0.854–0.959)0.951 (0.910–0.993)0.928 (0.893–0.962)0.9300.987 (0.977–0.998)0.924 (0.876–0.972)0.961 (0.924–0.998)0.941 (0.910–0.972)0.9440.370Enet0.956 (0.933–0.979)0.864 (0.803–0.926)0.893 (0.834–0.953)0.878 (0.835–0.921)0.8830.958 (0.936–0.980)0.856 (0.793–0.919)0.913 (0.858–0.967)0.882 (0.840–0.925)0.8860.902rSVM0.956 (0.933–0.979)0.831 (0.763–0.898)0.922 (0.871–0.974)0.873 (0.829–0.917)0.8750.964 (0.944–0.984)0.856 (0.793–0.919)0.922 (0.871–0.974)0.887 (0.845–0.929)0.8900.607MLP0.958 (0.935–0.981)0.915 (0.865–0.966)0.874 (0.810–0.938)0.896 (0.856–0.936)0.9040.958 (0.936–0.981)0.873 (0.813–0.933)0.913 (0.858–0.967)0.891 (0.850–0.932)0.8961.000LR0.960 (0.939–0.982)0.856 (0.793–0.919)0.922 (0.871–0.974)0.887 (0.845–0.929)0.8900.961 (0.941–0.983)0.881 (0.823–0.940)0.893 (0.834–0.953)0.887 (0.845–0.929)0.8930.948KNN0.965 (0.946–0.984)0.924 (0.876–0.972)0.864 (0.798–0.930)0.896 (0.856–0.936)0.9050.963 (0.943–0.983)0.924 (0.876–0.972)0.854 (0.786–0.922)0.891 (0.850–0.932)0.9010.887AUC, area under the curve; DT, decision tree; RF, random forest; XGBoost, extreme gradient boosting; Enet, elastic net; rSVM, radial-basis support vector machine; MLP, multilayer perceptron; LR, logistic regression; KNN, k-nearest neighbors.
Performance of the eight machine learning models built on clinical features in external validation
In external validation cohort 1, elastic net (Enet) (AUC = 0.848 [95% CI: 0.764–0.931]) and eXtreme Gradient Boosting (XGBoost) (AUC = 0.851 [95% CI: 0.768–0.935]) demonstrated leading discriminatory ability (Figure 4A and Table 3). In external validation cohort 2, although K-Nearest Neighbors (KNN) had the highest AUC (0.952, 95% CI: 0.916–0.989), its cross-center stability was slightly lower (Figure 4B and Table 3). Calibration curves also showed high concordance between the predicted probabilities of all eight models and the actual observed MPE recurrence probability (Figures 4C and 4D). Furthermore, DCA performed on external validation cohorts 1 and 2 demonstrated that using any of the eight machine learning prediction models to assess the risk of MPE recurrence within 3 months and intervene accordingly provided greater clinical benefit than intervening in all patients or no intervention, within a reasonable threshold probability range (Figures 4E and 4F). Considering that Enet maintained high performance across both independent cohorts with stable specificity and the strongest generalization ability, the Enet model was established as the optimal prediction model.Figure 4. External validation of the eight clinical feature-based machine learning models(A) ROC curves demonstrating the discriminatory performance of each model in external validation cohort 1.(B) ROC curves for the models in external validation cohort 2.(C) Calibration curves assessing the prediction accuracy of the models in external validation cohort 1.(D) Calibration curves for the models in external validation cohort 2.(E) DCA evaluating the clinical utility of the models in external validation cohort 1. The net benefit of model-guided intervention is plotted against various threshold probabilities.(F) DCA for the models in external validation cohort 2.Table 3. Performance of eight clinical feature-based machine learning predictive models in two external validation cohortsModelsExternal validation cohort 1External validation cohort 2AUC (95% CI)Sensitivity (95% CI)Specificity (95% CI)Accuracy (95% CI)F1 scoreAUC (95% CI)Sensitivity (95% CI)Specificity (95% CI)Accuracy (95% CI)F1 scoreDT0.822 (0.734–0.910)0.625 (0.475–0.775)0.939 (0.872–1.000)0.798 (0.714–0.881)0.7350.847 (0.783–0.910)0.629 (0.515–0.742)0.948 (0.898–0.998)0.796 (0.731–0.861)0.746RF0.831 (0.739–0.923)0.537 (0.384–0.689)0.939 (0.872–1.000)0.756 (0.667–0.844)0.6670.929 (0.891–0.968)0.714 (0.608–0.820)0.961 (0.918–1.000)0.844 (0.785–0.902)0.813XGBoost0.851 (0.768–0.935)0.537 (0.384–0.689)0.949 (0.893–1.000)0.780 (0.699–0.861)0.6670.920 (0.880–0.961)0.700 (0.593–0.807)0.974 (0.938–1.000)0.844 (0.785–0.902)0.810Enet0.848 (0.764–0.931)0.585 (0.435–0.736)0.939 (0.872–1.000)0.778 (0.692–0.864)0.7060.940 (0.906–0.975)0.729 (0.624–0.833)0.974 (0.938–1.000)0.857 (0.801–0.914)0.829rSVM0.842 (0.756–0.928)0.488 (0.335–0.641)0.939 (0.872–1.000)0.733 (0.642–0.825)0.6250.941 (0.907–0.975)0.671 (0.561–0.781)0.987 (0.962–1.000)0.837 (0.777–0.896)0.797MLP0.841 (0.754–0.928)0.610 (0.460–0.759)0.918 (0.842–0.995)0.778 (0.692–0.864)0.7140.917 (0.869–0.966)0.743 (0.640–0.845)0.974 (0.938–1.000)0.864 (0.809–0.919)0.839LR0.831 (0.743–0.920)0.537 (0.384–0.689)0.898 (0.813–0.983)0.733 (0.642–0.825)0.6470.941 (0.900–0.981)0.757 (0.657–0.858)0.974 (0.938–1.000)0.871 (0.817–0.925)0.848KNN0.763 (0.665–0.861)0.634 (0.487–0.782)0.714 (0.588–0.841)0.678 (0.581–0.774)0.6420.952 (0.916–0.989)0.900 (0.830–0.970)0.935 (0.880–0.990)0.918 (0.874–0.963)0.913AUC, area under the curve; DT, decision tree; RF, random forest; XGBoost, extreme gradient boosting; Enet, elastic net; rSVM, radial-basis support vector machine; MLP, multilayer perceptron; LR, logistic regression; KNN, k-nearest neighbors.
SHapley additive exPlanations (SHAP) interpretability and development of interactive tool
This study developed an SHAP beeswarm plot for the prediction model (Figure 5A), showing that targeted therapy was the strongest protective factor reducing pleural effusion recurrence risk, while larger lung cancer diameter was the primary risk factor. Additionally, after risk grading patients in the training set using the Enet model, three critical thresholds were established: (1) the recurrence probability corresponding to the model’s maximum sensitivity; (2) the recurrence probability corresponding to the maximum sum of sensitivity and specificity; and (3) the recurrence probability corresponding to the model’s maximum specificity. Patients were thus divided into four risk groups: low-risk group (recurrence probability ≤ 29%), medium-risk group (recurrence probability 29%–54%), high-risk group (recurrence probability 54%–65%), and very-high-risk group (recurrence probability >65%). To enhance clinical operability, an interactive prediction tool based on Shiny was developed based on this stratification (Figure 5B) (https://ericqazxsw.shinyapps.io/123456789/). Clinicians can input patient features to obtain individualized risk probability and graded management recommendations in real-time: Very-high-risk and high-risk groups require weekly monitoring and consideration of adjuvant intrapleural therapy; the medium-risk group is recommended for monthly clinical assessment and preventive measures; the low-risk group follows routine 3-month follow-up and is instructed on self-monitoring.Figure 5. Model interpretability and the developed interactive clinical tool(A) SHAP beeswarm plot for the optimal Enet model, illustrating the impact of the four key features on the model’s output.(B) Screenshot of the interactive web-based risk prediction tool. Clinicians can input the four predictor values to receive a real-time calculation of the individualized 3-month recurrence probability, which is automatically categorized into a risk stratum with corresponding clinical management recommendations.
Discussion
In lung cancer patients with MPE, recurrence signifies disease progression and is closely associated with overall survival. This study developed and validated the first stratification tool specifically designed to predict the risk of MPE recurrence within 3 months in lung cancer patients newly diagnosed with MPE. By integrating routine clinical parameters—including treatment regimen, primary tumor diameter, total pleural effusion volume, and ALT level—a pure clinical feature model based on the Enet algorithm demonstrated excellent performance in external multicenter validation. Notably, the incorporation of radiomics features did not significantly enhance predictive accuracy compared to the model using clinical features alone. Interpretability analysis using SHAP revealed that targeted therapy was the strongest protective factor against MPE recurrence, while larger tumor diameter was the primary risk factor.
Previous studies have identified several biomarkers associated with MPE recurrence, such as elevated neutrophil-to-lymphocyte ratio, serum lactate dehydrogenase, and serum carcinoembryonic antigen levels, while also noting the potential protective role of targeted therapy.11 Radiomics features have also been explored for predicting MPE recurrence.12 Although numerous high-precision predictive models exist for MPE prognosis, most focus on overall survival or initial treatment response.13^,^14^,^15 Research specifically addressing the prediction of 3-month recurrence risk in patients newly diagnosed with MPE remains scarce. Our study fills this gap by leveraging routinely available clinical data to build a highly generalizable and interpretable model.
This study confirmed that treatment regimen, lung cancer diameter, total pleural effusion volume, and ALT level are key independent predictors of MPE recurrence. Targeted therapy precisely inhibits driver genes, blocking tumor cell secretion of pro-angiogenic factors such as vascular endothelial growth factor/interleukin-6, thereby significantly reducing pleural microvascular leakage.16^,^17 A larger primary tumor diameter not only mechanically compresses mediastinal lymphatics, impairing fluid drainage, but is also associated with heightened epithelial-mesenchymal transition activity, which promotes pleural implantation of tumor cells.18^,^19^,^20 Increased total pleural effusion volume creates a vicious cycle by compressing lung tissue and reducing lymphatic drainage efficiency. Moreover, the rich transforming growth factor β content in the effusion induces cancer-associated fibroblasts to secrete hyaluronic acid, increasing colloid osmotic pressure and promoting fibrous encapsulation.21 Interestingly, moderately elevated ALT was identified as a protective factor against MPE recurrence. We speculate that this may reflect an active hepatic metabolic state, potentially enhancing the clearance of inflammatory mediators and optimizing the metabolism of targeted drugs, thereby indirectly inhibiting MPE recurrence in the absence of severe liver pathology.
In addition to these core factors, univariate analysis revealed that the presence of bone metastasis and pericardial effusion were also significantly associated with MPE recurrence. Bone metastasis often signifies a higher systemic tumor burden and more aggressive disease biology, which could predispose patients to pleural dissemination and fluid reaccumulation. Similarly, pericardial effusion may reflect extensive serosal involvement or compromised thoracic lymphatic drainage, creating a milieu conducive to pleural fluid recurrence. Although these variables did not retain independent significance in the multivariate model—likely due to collinearity with or being overshadowed by the stronger predictors like tumor diameter and treatment regimen—their univariate significance underscores the close interplay between multi-cavity effusions and advanced tumor progression in driving recurrence risk. Notably, several demographic and baseline clinical characteristics, such as gender, pathological subtype, and most comorbidities, showed no significant association. This suggests that the risk of early MPE recurrence is driven primarily by tumor burden and treatment-related factors rather than by patient demographics or common comorbid conditions. Moreover, age ≥60 years showed a borderline association with recurrence risk. Elderly patients may exhibit reduced immune surveillance and lower tolerance to systemic therapy, which could predispose them to earlier recurrence—an observation that warrants further validation in larger cohorts.
Our findings on predictive clinical features for MPE recurrence align with the broader trend of AI-driven biomarker discovery. As highlighted in recent literature, AI serves as a powerful tool for deciphering complex patterns in biomedical data to identify novel biomarkers and enhance diagnostic frameworks.22 The success of our model, which relies solely on easily accessible clinical parameters, underscores the translational potential of AI in creating practical tools for personalized patient management.
To sum up, the Enet model based on routine clinical indicators demonstrated robust performance in predicting the 3-month recurrence risk of MPE in lung cancer patients. To bridge the gap between model development and clinical practice, we developed an interactive Shiny-based risk stratification tool. This tool facilitates real-time risk assessment and supports individualized management, thereby significantly lowering the threshold for clinical deployment. It offers a practical and universally accessible solution, particularly for resource-limited institutions, with the potential to guide early intervention in high-risk patients.
Limitations of the study
This study has several limitations. First, the retrospective design may introduce confounding bias and preclude causal inferences, necessitating future prospective validation. Second, although the model was externally validated across multiple hospitals, all centers were within the same geographic region of China, which may limit its generalizability to other populations. Therefore, international cohort validation is therefore warranted. Third, the 2D region of interest (ROI) delineation method, while simple and practical, cannot fully capture the three-dimensional morphological heterogeneity of the tumor. Finally, the model is currently limited to clinical and radiomic features. As the field of AI in lung cancer is increasingly moving toward multiomics frameworks, future work should integrate molecular data from sources such as next-generation sequencing to capture the biological drivers of MPE recurrence and enhance the model’s predictive power and interpretability.23
Resource availability
Lead contact
Requests for further information and resources should be directed to and will be fulfilled by the lead contact, Yuying Li ([email protected]).
Materials availability
This study did not generate new unique materials.
Data and code availability
- •De-identified clinical data reported in this paper have been deposited at Zenodo and are publicly available as of the date of publication at https://doi.org/10.5281/zenodo.18391732.
- •This paper does not report original code.
- •Any additional information required to reanalyze the data reported in this paper is available from the lead contact upon request.
Acknowledgments
This research was supported by the Foundation of Tianfu Emei Plan (no. CW202204), the 10.13039/501100018542Natural Science Foundation of Sichuan Province (no. 2023NSFSC0527), and Science and Technology Cooperation Project between Luzhou Municipal Government and 10.13039/501100014895Southwest Medical University (2024LZXNYDJ003).
Author contributions
Conceptualization, X.H., Y.J., L.J., and Y.L.; methodology, X.H. and Y.J.; investigation, X.H., Y.J., Y.H., and Y.L.; writing – original draft, X.H. and Y.J.; writing – review and editing, all authors; supervision, Y.H., L.J., and Y.L.
Declaration of interests
All authors declare no competing interests.
Declaration of generative AI and AI-assisted technologies in the writing process
Not applicable.
STAR★Methods
Key resources table
REAGENT or RESOURCESOURCEIDENTIFIERDe-identified clinical dataZenodohttps://doi.org/10.5281/zenodo.18391732R (version 4.4.1)The R Foundationhttps://cran.r-project.org/bin/windows/base/old/4.4.1/3D Slicer (version 5.8.1)Slicer Communityhttps://www.slicer.org/Python (version 3.11.5)Python Software Foundationhttps://www.python.org/
Experimental model and study participant details
Study population
This multicenter, retrospective study enrolled a total of 458 human participants diagnosed with lung cancer and presented with malignant pleural effusion (MPE) at initial diagnosis. Data were collected from patients treated between January 1, 2019, and December 31, 2022, at three medical centers in China: the Affiliated Hospital of North Sichuan Medical College (training cohort, n=221), Guang'an People's Hospital (external validation cohort 1, n=90), and Chengdu Third People's Hospital (external validation cohort 2, n=147). Detailed demographic data were available for the training cohort, which consisted of 121 males (54.8%) and 100 females (45.2%), with 150 patients (67.9%) aged ≥60 years. All participants were of Chinese ethnicity. For the two external validation cohorts, data collection was focused on the specific clinical and radiomic variables required for model validation; thus, full demographic breakdowns (sex and age) were not recorded for these subsets.
Inclusion and exclusion criteria
Inclusion Criteria: (1) Patients with a histopathologically confirmed diagnosis of lung cancer, including non-small cell lung cancer and small cell lung cancer; (2) Diagnosis of MPE confirmed either by cytological/histopathological assessment of the effusion or pleural tissue, OR by meeting the following clinical-imaging criteria: (a) histopathologically confirmed lung cancer with no other reasonable cause for the effusion, or (b) confirmed lung cancer with pleural effusion and imaging evidence (CT, positron emission tomography - computed tomography, magnetic resonance imaging or ultrasound) of pleural nodules, masses, or irregular thickening consistent with pleural metastasis. Exclusion Criteria: (1) Lung cancer patients without MPE at initial diagnosis; (2) Individuals with a history of other malignancies; (3) Patients under 18 years of age; (4) Cases with incomplete clinical information; (5) Patients lost to follow-up.
Ethical statement
The study protocol was approved by the Medical Ethics Committee of the Affiliated Hospital of North Sichuan Medical College (Approval File Number: 2023ER423-1). The study was conducted in accordance with the ethical principles of the Declaration of Helsinki. Due to the retrospective nature of the study, which utilized anonymized data from hospital electronic medical records and health check databases, the requirement for informed consent was waived by the approving ethics committee.
Method details
Screening of clinical features
In the training cohort, all variables were first analyzed using univariate logistic regression. Variables with a p-value < 0.05 were then included in multivariate logistic regression analysis to identify independent predictors. Variables retaining a p-value < 0.05 in the multivariate analysis were retained for subsequent model development.
Image evaluation and feature extraction
Delineation of the ROI for the lung cancer lesion was performed by two physicians using 3D Slicer software on the training cohort scans. Discrepancies in delineation were resolved through consultation with a third physician. Radiomics features were then extracted from the delineated ROIs again using 3D Slicer, yielding a total of 1223 features. In the preliminary analysis, Mann-Whitney U tests were performed on the imaging features using Python (version 3.11.5). Features with a significance level of p < 0.05 were standardized using Z-Score normalization and further screened using the least absolute shrinkage and selection operator (LASSO) algorithm, ultimately identifying 8 radiomics signatures. The radiomics score was calculated based on these 8 signatures.
Machine learning model construction
Based on the aforementioned clinical features and radiomics features, two types of prediction models were constructed: pure clinical feature models and clinical feature combined with radiomics score models. The selected features were input into eight machine learning algorithms for modeling: Decision Tree (DT), Random Forest (RF), XGBoost, Radial-basis Support Vector Machine (rSVM), Multilayer Perceptron (MLP), Logistic Regression (LR), KNN, and Enet. Specific hyperparameter tuning strategies and parameter ranges for these algorithms are detailed in Methods S1. All models were trained using 5-fold cross-validation and their performance was evaluated on both the training set and the external validation sets.
Quantification and statistical analysis
Model performance was evaluated using the receiver operating characteristic curve (ROC), calculating sensitivity, specificity, accuracy, F1 score, and AUC. Calibration curves assessed the agreement between predicted probabilities and observed probabilities, reflecting model calibration. DCA quantified the net benefit of the model compared to alternative diagnostic/prognostic strategies, evaluating clinical utility. Finally, an interactive risk prediction system for the optimal model was built using Shiny. Except for the methods mentioned above, all analyses were performed in the R (version 4.4.1) environment.
The reference list from the paper itself. Each links out to its DOI / PubMed record.
- 1Wang J.Pang B.Zhang J.Ren X.Han Y.Malignant pleural effusion is a negative prognostic factor for immunotherapy outcomes in non-small cell lung cancer: a single-center retrospective study J. Thorac. Dis.1720253064307210.21037/jtd-2024-199940529739 PMC 12170141 · doi ↗ · pubmed ↗
- 2Penz E.Watt K.N.Hergott C.A.Rahman N.M.Psallidas I.Management of malignant pleural effusion: challenges and solutions Cancer Manag. Res.9201722924110.2147/CMAR.S 9566328694705 PMC 5491570 · doi ↗ · pubmed ↗
- 3Antunes G.Neville E.Duffy J.Ali N.Pleural Diseases Group, Standards of Care Committee, British Thoracic Society Bts guidelines for the management of malignant pleural effusions Thorax 582003 ii 29ii 3810.1136/thorax.58.suppl_2.ii 2912728148 PMC 1766015 · doi ↗ · pubmed ↗
- 4Trovisco R.Freitas C.Serino M.Ferreira P.Martins B.Coelho D.Melo N.Fernandes G.Magalhães A.Bastos H.N.Predictors of lung entrapment in malignant pleural effusion Pulmonology 30202455556210.1016/j.pulmoe.2022.08.00136180353 · doi ↗ · pubmed ↗
- 5Gayen S.Malignant pleural effusion: presentation, diagnosis, and management Am. J. Med.13520221188119210.1016/j.amjmed.2022.04.01735576996 · doi ↗ · pubmed ↗
- 6Li Q.Hu C.Su S.Ma Z.Geng Y.Hu Y.Li H.Lu B.Failure pattern and radiotherapy exploration in malignant pleural effusion non-small cell lung cancer treated with targeted therapy Front. Oncol.13202397473510.3389/fonc.2023.974735 PMC 1023563437274290 · doi ↗ · pubmed ↗
- 7Na K.J.Kim Y.T.Goo J.M.Kim H.Clinical utility of a ct-based ai prognostic model for segmentectomy in non-small cell lung cancer Radiology 3112024 e 23179310.1148/radiol.23179338625008 · doi ↗ · pubmed ↗
- 8Lai Y.H.Chen W.N.Hsu T.C.Lin C.Tsao Y.Wu S.Overall survival prediction of non-small cell lung cancer by integrating microarray and clinical data with deep learning Sci. Rep.102020467910.1038/s 41598-020-61588-w PMC 706996432170141 · doi ↗ · pubmed ↗