miRNA-210 expression is associated with iron deficiency and biochemical parameters in hemodialysis patients
Merve Kılıç, Hamad Dheir, Mahmud İslam, Zafer Ercan, Muhittin Abdulkadir Serdar

TL;DR
The study suggests that miRNA-210 could help distinguish between types of iron deficiency in patients undergoing hemodialysis.
Contribution
The study identifies miRNA-210 as a potential biomarker for differentiating iron deficiency anemia from functional iron deficiency in hemodialysis patients.
Findings
miRNA-210 levels were significantly higher in patients with iron deficiency anemia compared to controls and those with functional iron deficiency.
miRNA-210 showed moderate diagnostic ability for identifying iron deficiency anemia, comparable to zinc protoporphyrin.
miRNA-210 correlated negatively with hemoglobin levels, indicating its potential role in reflecting iron metabolism.
Abstract
This study aimed to evaluate the potential of microRNA (miRNA)-210 as a biomarker for distinguishing iron deficiency anemia (IDA) from functional iron deficiency (FID) in hemodialysis (HD) patients. The diagnostic performance of miRNA-210 was also compared with conventional biochemical markers, including hemoglobin (Hb), ferritin, transferrin saturation (TSAT), and zinc protoporphyrin (ZnPP). Fifty HD patients were classified into control, IDA, and FID groups according to Hb, ferritin, and TSAT criteria. Pre-dialysis blood samples were collected, and plasma miRNA-210 levels were measured using reverse transcription quantitative polymerase chain reaction (RT2-PCR). Diagnostic performance was assessed through receiver operating characteristic (ROC) analysis alongside traditional biomarkers. Plasma miRNA-210 levels were significantly higher in the IDA group compared to both the control…
Genes, proteins, chemicals, diseases, species, mutations and cell lines named across the full text — each resolved to its canonical identifier and authoritative record.
Click any figure to enlarge with its caption.
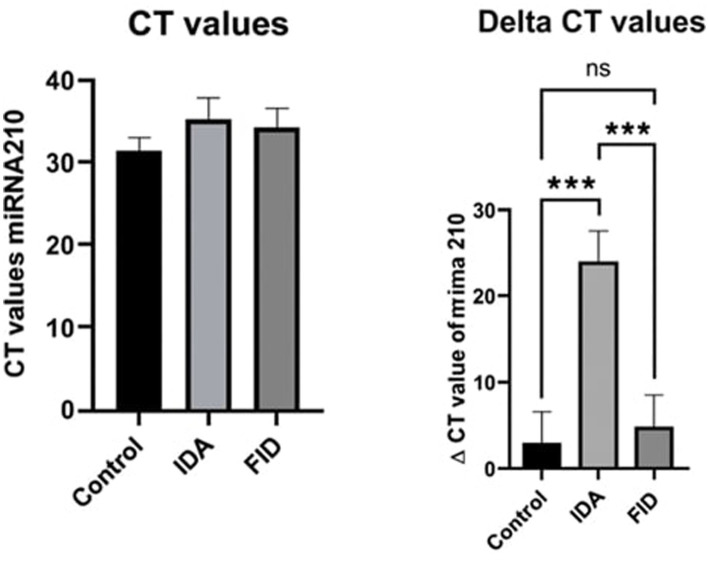 Figure 1
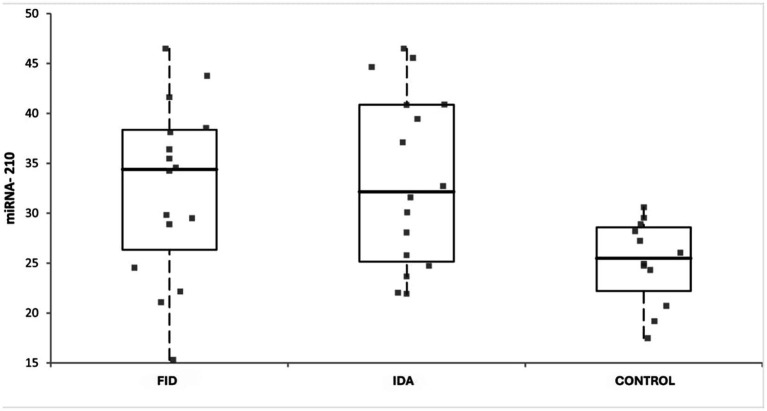 Figure 2
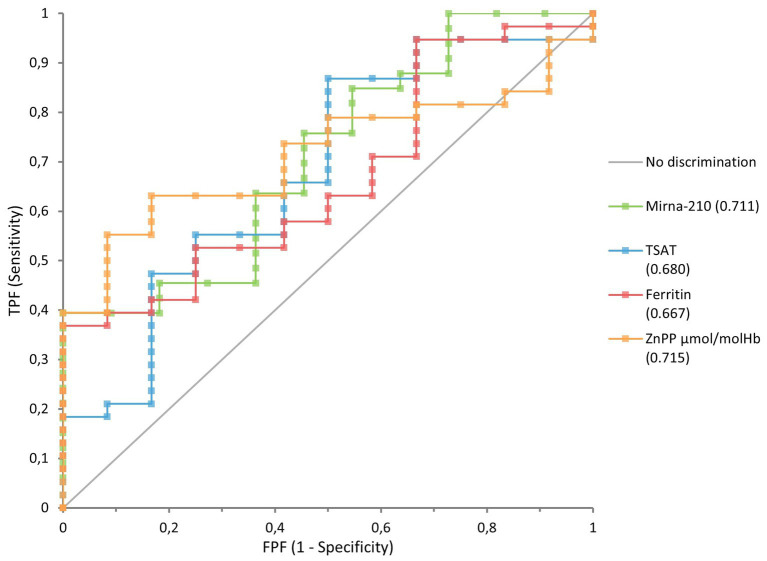 Figure 3
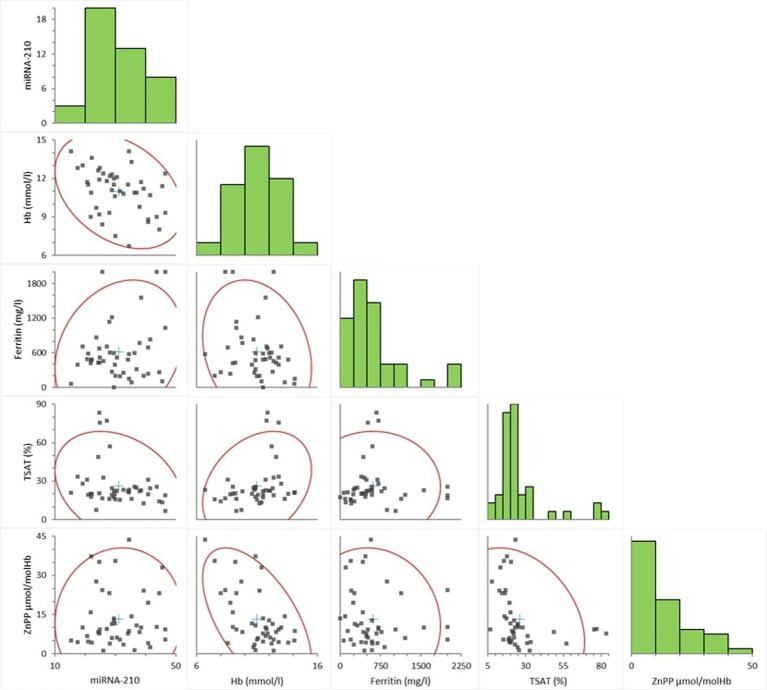 Figure 4
| Target miRNA | Assay ID/catalog no. | Amplicon length (bp) | qPCR kit (catalog no.) | Instrument | Efficiency (%) | |
|---|---|---|---|---|---|---|
| miR-210 | Qiagen miRCURY LNA PCR Assay, 339,306 | 72 | Qiagen miRCURY LNA SYBR Green PCR Kit, 339,345 | QIAGEN Rotor-Gene | 96.5 | 0.998 |
| UniSp6 | Qiagen miRCURY LNA PCR Assay, 339,306 | 68 | Qiagen miRCURY LNA SYBR Green PCR Kit, 339,345 | QIAGEN Rotor-Gene | 94.2 | 0.997 |
| CHARACTERISTIC ( |
| % |
|---|---|---|
| Gender | ||
| Male | 30 | 60 |
| Female | 20 | 40 |
| Age groups | ||
| 18–44 | 8 | 16 |
| 45–64 | 15 | 30 |
| 65–84 | 20 | 40 |
| >85 | 7 | 14 |
| Primary disease, no, % | ||
| Diabetes mellitus | 20 | 27.4 |
| Hypertension | 39 | 53.4 |
| Other | 14 | 19.2 |
| Dialysis duration | ||
| 3–12 months | 8 | 16 |
| 13–60 months | 28 | 56 |
| > 61 months | 14 | 28 |
| Smoker | ||
| Yes | 4 | 8 |
| No | 46 | 92 |
| Drinking alcohol | ||
| Yes | 0 | 0 |
| No | 50 | 100 |
| Vascular access information | ||
| Arteriovenous fistula (AVF) | 26 | 52 |
| Permanent catheter | 24 | 48 |
| Iron supplement use | ||
| Yes | 22 | 44 |
| No | 28 | 56 |
| Erythropoietin (EPO) use | ||
| Yes | 28 | 56 |
| No | 22 | 44 |
| Angiotensin-converting enzyme inhibitors (ACEI)/Antiotensin II receptor blocker use | ||
| Yes | 2 | 4 |
| No | 48 | 96 |
| Control | FID | IDA | ||
|---|---|---|---|---|
| Median | Median | Median | ||
| (25th–75th percentile) | (25th–75th percentile) | (25th–75th percentile) | ||
| RBC (10^9/1) | 4.015 [3.8575–4.1725]* | 3.925 [3.365–4.22] | 3.27 [2.87–3.42] | <0.01 |
| Hb (mmol/L) | 12.25 [11.975–13]* | 11.5 [10.675–12.775]† | 9.3 [8.8–10.8] | <0.001 |
| MCV (fL) | 93.3 [90.975–94.825] | 91 [90.075–92.35] | 90 [88.2–94.5] | 0.213 |
| MCH (pg) | 30.9 [30.2–31.6] | 29.35 [28.525–30.925] | 29.6 [28.1–31.1] | 0.057 |
| TSAT (%) | 33.58 [27.2275–61.7175]║,* | 20.98 [19.2595–23.0325] | 16.2 [14.23–20.11] | <0.001 |
| Iron (μmol/L) | 66.4 [58.475–70.715]║,* | 46.56 [41.545–55.05] | 35 [27.89–41.9] | <0.001 |
| Ferritin (mg/L) | 517.5 [446.795–619.05] | 580.815 [334–873.855] | 334.05 [241–695] | 0.416 |
| ZnPP (μmol/molHb) | 7.66 [4.20–9.80]* | 8.01 [4.54–12.15]† | 23.25 [9.34–33.13] | <0.05 |
| CRP (mg/L) | 9.45 [3.3325–15.925] | 12.2 [7.375–23.575] | 13.3 [9.88–38.9] | 0.106 |
| HCT (%) | 37.25 [36.9–37.95]* | 35.35 [30.875–38.9]† | 28.6 [27–33.5] | <0.001 |
| MCHC (g Hb/L) | 32.7 [32.275–33] | 32.35 [32.075–32.925] | 32.2 [31.8–32.7] | 0.203 |
| MPV (fL) | 10.65 [10.075–10.95]* | 9.35 [9.075–10.45] | 9 [8.7–10.1] |
| miRNA-210 | Mean ± SD | Confidence interval (95% CI) | |
|---|---|---|---|
| Control and IDA | −20.39 ± 5.29 | [−33.19, −7.595] |
|
| Control and FID | −1.24 ± 5.35 | [−14.18, 11.70] | 0.9706 |
| IDA and FID | 19.15 ± 4.83 | [7.454, 30,84] |
|
| Biomarker | AUC | 95% CI | |
|---|---|---|---|
| ZnPP (μmol/molHb) | 0.727 | 0.585–0.870 | |
| miRNA-210 | 0.711 | 0.535–0.886 | |
| Ferritin (mg/L) | 0.657 | 0.489–0.824 | 0.0664 |
| TSAT% | 0.657 | 0.474–0.839 | 0.0925 |
| Variable | Beta ( | Odds ratio (OR) | Lower limit (95% CI) | Upper limit (95% CI) | |
|---|---|---|---|---|---|
| Intercept | −3.917 | 0.047 | – | – | – |
| miRNA-210 | 0.117 | 0.022 | 1.174 | 1.049 | 1.320 |
| Comorbidity (absent/present) | 0.754 | 0.427 | 2.126 | 0.331 | 13.658 |
| Iron supplementation (not using/using) | 0.927 | 0.301 | 2.527 | 0.436 | 14.634 |
| EPO use (not using/using) | 1.883 | 0.036 | 6.571 | 1.130 | 38.199 |
| ACEI use (not using/using) | 0.696 | 0.738 | 2.007 | 0.034 | 119.590 |
Peer Reviews
No public reviews on file for this paper yet. If you reviewed it on a platform where reviews are public (OpenReview, ICLR, NeurIPS, ICML), you can paste yours below so the community can read it here.
Videos
No videos yet. Explain this paper in a talk, walkthrough, or lecture? Add one.
Taxonomy
TopicsIron Metabolism and Disorders · MicroRNA in disease regulation · Hemoglobinopathies and Related Disorders
Introduction
1
Iron deficiency anemia (IDA) is one of the most common complications in hemodialysis (HD) patients and can negatively impact their quality of life and impair their clinical outcomes. IDA is generally characterized by low hemoglobin (Hb) levels, decreased transferrin saturation (TSAT), and low ferritin levels, which lead to hypoxia, exacerbating the progression of kidney disease and other comorbid diseases (1, 2).
Anemia is a clinical condition characterized by a Hb level of <13 g/dL in men and <12 g/dL in women, leading to a reduction in the capacity to carry oxygen to tissues. Anemia in chronic kidney failure is associated with decreased quality of life, cardiovascular diseases, left ventricular hypertrophy, increased hospitalization rates, and mortality (3, 4). Functional iron deficiency is defined as a serum ferritin level of ≥30 ng/mL but a TSAT of <20% (5).
As chronic kidney disease (CKD) reaches end-stage kidney disease, repeated dialysis becomes a fundamental requirement for survival. These patients frequently undergo HD to manage metabolic waste and fluid imbalances and often develop iron deficiency and anemia due to decreased erythropoiesis, blood loss during dialysis, and iron utilization disorders (3, 6, 7).
Hypoxia is one of the most important factors in the pathogenesis of IDA. Iron plays a critical role in oxygen transport, and its deficiency reduces the capacity to carry oxygen to tissues, leading to hypoxia. This leads to the activation of regulatory mechanisms such as erythropoiesis and the modulation of microRNA (miRNA) expression. miRNAs are small non-coding RNA molecules that play important roles in regulating various physiological processes in response to hypoxia (8–10).
miRNA-210 is known as a miRNA that plays a role in cellular adaptation to low oxygen conditions. This miRNA is particularly effective in regulating critical genes such as angiogenesis, cell proliferation, and apoptosis (8, 10, 11).
Recent studies have suggested that miRNA-210 expression may be altered in IDA patients in the context of hypoxia caused by low Hb levels (12). However, there is a limited number of studies examining how miRNA-210 expression specifically changes in HD patients due to IDA. Therefore, this study aims to examine the differences in miR-210 expression levels between the groups of HD patients defined by Hb, TSAT, and ferritin thresholds and to contribute to the literature.
Methods
2
Study population
2.1
This study included a group of 50 patients who were undergoing a chronic HD program at the Nephrology Clinic of Sakarya University Training and Research Hospital and were regularly followed between September 1 and December 1, 2023. The study was approved by Acibadem Mehmet Ali Aydinlar University ATADEK (Acıbadem University and Acıbadem Healthcare Organizations Medical Research Ethics Committee) on June 16, 2023, with decision number 2023-10/340. Inclusion criteria included: presenting to the Nephrology Outpatient Clinic between the specified dates, being over 18 years of age, having been diagnosed with CKD at the relevant outpatient clinic, falling outside the exclusion criteria specified in the study plan, signing the consent form, and being on chronic HD program for at least 90 days and 3 days per week. Exclusion criteria included: pregnancy/postpartum/breastfeeding mothers, unconscious individuals, individuals who could not give consent personally, the presence of any active infection, patients with malabsorption syndrome, diagnosed with malignancy, liver disease, diagnosed with hematological disease, active bleeding, history of bleeding in the last 3 months, patients using anticoagulants such as warfarin, and patients enrolled in a diet or drug study.
According to the results of the study by Özdemir et al. (13), the effect size was determined to be 1.03. Based on this, with an alpha value of 5% and a power value of 90%, an a priori power analysis was conducted using the G*Power software. The analysis indicated that a minimum sample size of 42 participants, with 21 individuals in each group, was required for the study. Considering potential issues that might arise during the study, it was initiated with 50 participants. After the completion of the study, a post-hoc power analysis was performed using the actual sample size, and the statistical power achieved was determined to be 84%.
Collection and storage of analysis samples
2.2
Blood samples were collected from patients at one time at the Nephrology Clinic of Sakarya Training and Research Hospital, following a 12-h hunger, and collected in vacuum tubes containing 15 mg/mL ethylenediaminetetraacetic acid (EDTA) anticoagulant before HD. All blood samples were collected immediately before the initiation of the dialysis session to minimize the effect of potential dialysis-induced clearance on circulation miRNA levels. Measurements of the analyzed samples were performed using BC MINDRAY 6200 and BC MINDRAY 6000 devices in the Biochemistry Laboratory of Sakarya Training and Research Hospital. All determined parameters were determined following daily quality control procedures. Plasma was obtained by centrifugation at 3,000 rpm for 10 min, and samples used outside of daily analyses were stored at −80 °C.
miRNA-210 gene expression analysis
2.3
The real-time Reverse Transcription Polymerase Chain Reaction (RT-qPCR) method was used to determine miRNA expression levels. Total RNA was purified using an RNA isolation kit (QIAGEN, miRNeasy serum/plasma kit catalog no: 217184) from the manufacturer. Purity measurements of isolated RNAs were performed using a nanodrop spectrometer, and samples with an A260/280 ratio below 1.8–2.0 were excluded from the study. After RNA purification, a cDNA synthesis kit (QIAGEN, miRCURY LNA RT kit catalog no: 339340) was used. A QIAGEN RotorGene device was used for RT-qPCR analyses, and gene expression analysis was performed using relevant kits (QIAGEN miRCURY LNA SYBR Green PCR kit, catalog number: 339345, and QIAGEN miRCURY LNA PCR Assay kit, catalog number: 339306). Normalization in the study was provided with the UniSp6 miRCURY LNA miRNA PCR Assay.
Plasma miRNA isolation protocol
2.4
Plasma samples were stored at −80 °C and thawed at room temperature prior to analysis. A total of 100 μL of thawed plasma was mixed with 500 μL of QIAzol lysis solution by pipetting and incubated for 5 min at room temperature. Subsequently, 100 μL of chloroform was added, and the mixture was vortexed vigorously for 15 s, allowed to stand for 2–3 min, and then centrifuged at 12,000 g for 15 min at 4 °C. Following centrifugation, three phases were formed, and the upper, colorless aqueous phase containing RNA was carefully transferred to a new tube. An additional 1.5 volumes of 100% ethanol was added to the aqueous phase, mixed thoroughly, and applied to an RNeasy MinElute spin column. The column was centrifuged at 11,000 rpm for 15 s, followed by sequential washes with 700 μL Buffer RWT, 500 μL Buffer RPE, and 500 μL of 80% ethanol. After the final wash, the column was placed into a new collection tube and centrifuged at maximum speed for 5 min with the lid open to allow drying. For RNA elution, 14 μL of RNase-free water was added directly to the center of the membrane and centrifuged at 11,000 rpm for 1 min, yielding a total of 12 μL of eluate. RNA concentrations were measured using a Nanodrop spectrophotometer, and only samples with an A260/280 ratio between 1.8 and 2.0 were included in the study.
cDNA synthesis
2.5
cDNA synthesis was performed using the QIAGEN miRCURY LNA RT Kit (catalog no: 339340). RNA samples were diluted with RNase-free water to a final concentration of 5 ng/μL. Each 20 μL reaction mixture consisted of 4 μL 5 × miRCURY SYBR Green RT Reaction Buffer, 9 μL RNase-free water, 2 μL 10 × miRCURY RT Enzyme Mix, 1 μL UniSp6 RNA spike-in, and 4 μL RNA. The reaction mixtures were placed into PCR strip tubes and processed in a thermal cycler under the following program: incubation at 42 °C for 60 min, followed by enzyme inactivation at 95 °C for 5 min and rapid cooling to 4 °C. The resulting cDNA was stored and subsequently used for real-time PCR analysis.
Real-time PCR analysis
2.6
RT-qPCR analyses were performed using the QIAGEN Rotor-Gene real-time PCR system. Each reaction had a final volume of 20 μL, consisting of 10 μL 2 × miRCURY SYBR Green Master Mix, 2 μL PCR Primer Mix, 2 μL RNase-free water, and 4 μL diluted cDNA. The PCR cycling conditions included an initial denaturation at 95 °C for 2 min, followed by 40 cycles of 95 °C for 10 s and 56 °C for 1 min. Ct values were automatically generated by the system software. Melt-curve analysis was performed to confirm the specificity of the amplified products.
Normalization strategy
2.7
Because universally accepted endogenous reference miRNAs are lacking in plasma and serum samples, normalization was carried out using the UniSp6 spike-in control (QIAGEN miRCURY LNA miRNA PCR Assay, catalog no: 339306) to control for technical variability during RNA extraction and reverse transcription steps. Relative expression levels were calculated using the ΔΔCt method, where ΔCt = Ct_miR-210 – Ct_UniSp6. Fold changes were then calculated using the 2^-ΔΔCt method. ΔΔCt was obtained by subtracting the mean ΔCt value of the control group from the mean ΔCt value of the patient group. A fold change greater than 2 was interpreted as upregulation of expression, while a value less than 1 was considered downregulation. Reactions with a Ct value greater than 35 or a replicate standard deviation (SD) above 0.5 were excluded from the analysis. Inter-run calibrators were used to minimize plate-to-plate variability, and melt-curve analysis confirmed the presence of single, specific amplification products.
Data analysis
2.8
Quantification of miRNA expression was normalized using the UniSp6 spike-in reference gene. ΔCt and ΔΔCt values were used to calculate fold change, and results were subjected to statistical analysis. All assay performance characteristics are summarized in Table 1.
Results
3
Demographic findings and distributions of HD patients
3.1
This study included 50 chronic HD patients receiving treatment at the Nephrology Clinic of Sakarya Training and Research Hospital. Participants were divided into three subgroups based on their Hb, TSAT, and ferritin levels, which reflect their iron status and anemia levels.
The control group consisted of 13 patients with Hb > 11 g/dL, TSAT > 20%, and ferritin > 200 ng/mL. The IDA group included 19 patients with Hb < 9 g/dL, TSAT < 20%, and ferritin < 200 ng/mL. The functional iron deficiency group, representing the intermediate group, included 18 patients with Hb between 9 and 11 g/dL, TSAT < 20%, and ferritin > 200 ng/mL.
Demographic characteristics of HD patients included in the study are presented in detail in Table 2.
The patient group consisted of 60% men and 40% women. The majority of patients were aged 45 and over. Hypertension was the most common primary disease at 53.4%, followed by diabetes mellitus at 27.4%. An evaluation of the dialysis duration revealed that 56% of patients had been on dialysis for 13–60 months, and 28% for 61 months or longer. Arteriovenous fistulas (AVF) were the preferred vascular access method in 52% of patients, and 44% received iron supplements, and 56% received erythropoietin (EPO) therapy. Smoking rates were low, alcohol consumption was nonexistent, and only 4% used angiotensin-converting enzyme inhibitors (ACEIs) or angiotensin II receptor blockers as part of antihypertensive treatment.
Comparison of complete blood count and other biochemical parameters among specified groups in HD patients
3.2
Laboratory data for the control, FID, and IDA groups are shown in Table 3.
The Shapiro–Wilk test was used to determine whether the data in the specified groups were normally distributed (p < 0.05). Differences between the groups were tested with the Mann–Whitney test, and statistically significant differences were found in the red blood cell count (RBC), Hb, TSAT, iron, hematocrit (HCT), mean platelet volume (MPV), and Zinc Protoporphyrin (ZnPP) parameters (p < 0.05) (Table 3). RBC, Hb, and HCT levels were found to be statistically significantly lower in the IDA group, reflecting a pronounced anemic picture. TSAT and serum iron levels decreased significantly in the IDA group and in the FID group compared to the control group; however, no significant difference was found in ferritin levels. This suggests that the high ferritin values in the FID group may be related to the inflammatory state. The significantly higher MPV values in the control group indicate possible effects on thrombopoiesis. While there was no statistical significance in MCV and mean erythrocyte hemoglobin content (MCH) levels, the lower levels in the IDA group support microcytic-hypochromic anemia. The findings exhibit that different subtypes of iron deficiency in HD patients lead to distinct changes in the hematological profile, and these parameters reveal significant differences in the differential diagnosis.
Pairwise comparisons of ZnPP levels revealed that ZnPP levels were statistically significantly higher in the IDA group compared to both the FID and control groups. However, no significant difference was detected between the control and FID groups. These findings suggest that ZnPP is significantly increased, particularly in IDA, and may be a potential biomarker in the differential diagnosis.
Evaluation of miRNA-210 expression in HD patients
3.3
The significant differences detected in miRNA-210 expression levels in HD patients, because of one-way ANOVA analysis, were further analyzed using Tukey’s multiple comparisons test to determine differences between the groups. Accordingly, the mean difference of the plasma miRNA-210 expression level in the control group was 20.39 ΔCt units lower than in the IDA group. The IDA group had significantly up-regulated miRNA-210 expression compared to the control group (p = 0.0010).
The mean difference between plasma miRNA-210 expression levels in the control group and the FID group was −1.244, with a confidence interval (95% CI: −14.18 to 11.70). Since the p-value was 0.9706, there was no statistically significant difference between the two groups.
The mean difference between plasma miRNA-210 expression levels in the IDA group and the expression levels in the FID group was 19.15 units higher. The IDA group showed upregulation, while the FID group showed downregulation. The 95% CI (7.454 to 30.84) indicated a statistically significant difference between IDA and FID (p = 0.0007).
Plasma miRNA-210 *∆*Ct levels of the groups are shown in Table 4.
Information, including the statistical significance of plasma miRNA-210 CT values and *∆*Ct levels between groups in HD patients, is shown in Figure 1.
Statistically significant differences in plasma miRNA-210 CT value and ΔCt levels between groups in individuals with HD disease.
miRNA-210 expression levels in the control, FID, and IDA groups are shown in Figure 2. MiRNA-210 expression levels in the IDA and FID groups are higher and more variable compared to the control group, indicating an increased hypoxic response due to iron deficiency.
Comparison of miRNA-210 expression levels between groups.
To further evaluate the discriminatory potential of IDA in HD patients, Receiver Operating Characteristic (ROC) curve analysis was performed. Accordingly, ROC curves were generated for TSAT, ZnPP, ferritin, and miRNA-210 levels. ROC analysis results revealed that miRNA demonstrated statistically significant diagnostic performance in distinguishing IDA (AUC = 0.711, p = 0.0186). This value is higher than that of the traditional parameters TSAT and ferritin, supporting the biomarker potential of this hypoxia-sensitive molecule. The discriminatory power of miRNA-210 is comparable to that of a clinically accepted parameter, such as ZnPP (ZnPP AUC = 0.727, p = 0.0017), suggesting that miRNA may have not only supportive but also potentially equivalent diagnostic value. In this context, the biochemical role of ZnPP, reflecting iron metabolism, and miRNA, representing the molecular response associated with cellular stress and hypoxia, suggest that both parameters can be considered complementary biomarkers (Figure 3 and Table 5).
ROC showing the sensitivity and specificity of miRNA-210, TSAT, ZnPP, and Ferritin in distinguishing IDA in chronic HD patients (miRNA, microRNA, ROC, receiver operating characteristic, TSAT, transferrin saturation, ZnPP, zinc protoporphyrin).
In the study, the relationships between miRNA-210 levels and hematological and iron metabolism parameters were evaluated using Spearman correlation analysis, and the findings are exhibited in Figure 4.
Scatter graph of correlations between miRNA-210, Hb, ferritin, TSAT, and ZnPP in HD patients (Hb, Hemoglobin, miRNA, microRNA; TSAT, transferrin saturation; ZnPP, zinc protoporphyrin).
As a result of the analysis, a negative and statistically significant correlation was found between miRNA-210 and Hb levels (Spearman’s ρ = −0.363; p = 0.0155). A negative and borderline significant correlation was observed between miRNA-210 and TSAT (ρ = −0.269; p = 0.0775). In contrast, the relationships of miRNA-210 with ferritin (ρ = 0.057; p = 0.7118) and ZnPP (ρ = 0.062; p = 0.6902) levels were not found to be statistically significant.
According to the logistic regression analysis, the relationship between miRNA-210 levels and the presence of anemia was evaluated. The analysis revealed an Odds Ratio (OR) of 1.174 (95% CI: 1.049–1.320) with a p-value of 0.022 for miRNA-210. After adjusting for variables such as the number of comorbidities, iron supplementation, EPO use, and ACEI use, miRNA-210 was identified as an independent predictor (Table 6).
Discussion
4
Anemia is defined as Hb levels below the normal range for an individual’s age and sex, while IDA is characterized by decreased body iron stores in addition to anemia and is considered the most common type of anemia globally. IDA is reported to reduce work capacity, negatively impact cognitive function, and impair quality of life in adults (14). Furthermore, numerous studies in the literature indicate that IDA may be associated with chronic diseases (7, 15, 16).
The primary aim of our study was to distinguish between IDA and FID in HD patients by evaluating differences in miRNA-210 expression levels between these two groups. Therefore, as the focus of the study was the comparison of these anemia types, a healthy control group was not included. Although the absence of a healthy control group limits the establishment of reference ranges for circulating miRNA-210 and the generalizability of the findings, our results demonstrate the potential of miRNA-210 levels to differentiate between IDA and FID within the HD population.
The timing of blood sample collection in our study may significantly influence circulating biomarker levels in HD patients, as dialysis procedures can alter the plasma concentrations of certain small molecules, including miRNAs. To minimize this potential confounding effect, all blood samples in our study were collected prior to the initiation of the dialysis session.
In a study conducted by Martino et al., no significant differences were observed in the levels of miR-210 and miR-21 between pre- and post-dialysis samples, and only very small amounts of miRNAs were detected in the dialysate. This finding indicates that circulating miRNAs are largely not removed during dialysis (17). However, other studies have reported marked differences in circulating miRNA profiles across different stages of CKD and in patients undergoing HD. In a study evaluating miR-126 and miR-155 levels, these miRNAs were found to be significantly lower in HD patients compared to both early-stage CKD patients and kidney transplant recipients (18). Furthermore, another study demonstrated that specific miRNAs, such as miR-122, were decreased in individuals with end-stage renal disease prior to dialysis (19).
These findings indicate that while the pre-dialysis sampling strategy partially minimizes potential bias introduced by the dialysis process, the possible effects of dialysis procedures on biomarker levels and the biological variability arising from the intervals between sessions should be carefully considered when interpreting the results. To clarify the impact of these factors, future studies should investigate these issues in greater detail.
In the study, the significantly lower RBC, Hb, and HCT levels in the IDA group confirm the classic anemic picture. The decrease in TSAT and serum iron levels in both the IDA and FID groups compared to the control group suggests that functional iron deficiency can also be observed at the biochemical level. The lack of a significant difference in ferritin levels suggests that the higher values, particularly in the FID group, may be related to inflammation (20). Furthermore, the higher MPV values in the control group may indicate the potential effects of iron deficiency on thrombopoiesis (21). These findings suggest that significant differences in hematological parameters may occur depending on the subtype of iron deficiency in HD patients.
In the literature, ZnPP has been reported as a strong biomarker reflecting iron deficiency and functional iron deficiency. Previous studies have demonstrated that ZnPP may be more reliable than Hb and ferritin in predicting the need for intravenous iron in HD patients and that it plays an especially important role in the assessment of functional iron deficiency. Moreover, large cohort studies have shown that ZnPP accurately reflects iron status, provides high sensitivity and specificity in ROC analyses for the diagnosis of IDA, and yields more reliable results than ferritin and TSAT in the presence of inflammation (22–26).
In our study, ROC analysis was conducted to compare the diagnostic performance of various parameters used to distinguish IDA in HD patients, including TSAT, ferritin, ZnPP, and miRNA-210 levels. The findings demonstrated that miRNA-210 exhibited a statistically significant diagnostic performance (AUC = 0.711, p = 0.0186), indicating moderate discrimination for IDA. Accordingly, we interpret miR-210 as a supportive and exploratory biomarker that may complement, but not replace, established measures such as Hb, ferritin, TSAT, and research-stage ZnPP. Its potential clinical utility requires validation in larger, multicenter, longitudinal cohorts with prespecified cut-offs and external replication.
However, it should be noted that ZnPP is not yet endorsed by current clinical guidelines and is not widely used in routine clinical practice. Therefore, the ZnPP findings in our study should be interpreted within an experimental research context, rather than as equivalent to standard clinical biomarkers.
The significant negative correlation between miRNA-210 and Hb levels (ρ = −0.363; p = 0.0155) suggests that this microRNA may play a regulatory role in erythropoietic processes. This finding is consistent with the literature demonstrating that miRNA-210 is transcriptionally induced via Hypoxia-Inducible Factor 1-alpha (HIF-1α) in response to hypoxia and functions as a key molecular regulator governing cellular adaptation in hypoxic environments (27–29). It is thought that miRNA-210 may reflect adaptive responses that suppress or remodel erythropoiesis, particularly in HD patients exposed to chronic hypoxia. In addition, the fact that the negative correlation between miRNA-210 and TSAT was close to the statistical significance limit (ρ = −0.269; p = 0.0775) suggests that this miRNA may be associated not only with oxygen-carrying capacity but also with bioactive iron availability. TSAT is considered one of the most clinically sensitive indicators in the evaluation of functional iron deficiency, and in this context, miRNA-210 has the potential to be a biomarker reflecting the molecular interactions between iron bioavailability and erythropoietic stimulation (30).
miRNAs are posttranscriptional regulators that play a critical role at the cellular level in maintaining iron homeostasis. These molecules, which precisely control the cell’s iron uptake, storage, and utilization, are important components of molecular networks that are activated particularly when iron availability is low or oxygen is limited (13, 31–34). At low iron levels, oxygen-carrying capacity decreases with decreased Hb synthesis; on the other hand, in response to hypoxia, iron stores are mobilized and erythropoiesis accelerates. In this process, miRNA-210 stands out as one of the most important hypoxia-sensitive miRNAs. Highly expressed under hypoxic conditions, miRNA-210 has been shown to exert regulatory effects on oxygen balance, iron bioavailability, and cellular adaptation (35).
The importance of miRNA-210 has also been emphasized in various experimental studies on kidney pathophysiology. It has been reported that during processes characterized by oxygen deficiency, such as ischemia/reperfusion injury, this miRNA is expressed at high levels, activating genetic programs that ensure cell survival (36). Furthermore, a study by Douvris et al. (37) demonstrated that miRNAs can be reliably detected in biological fluids such as blood and urine, thus possessing diagnostic potential as non-invasive biomarkers. This view is supported by review studies indicating that miRNA-210 may play a protective role by affecting renal cell adaptation in both acute and chronic kidney diseases (18, 31, 38–43).
The relationship between miRNA-210 and IDA has also been demonstrated in various patient groups. It has been reported that miR-210 levels are significantly increased in individuals with IDA, and this increase correlates with parameters related to iron metabolism (12, 44). It has been emphasized that processes such as ferritin synthesis, iron transport, and utilization are regulated at a post-transcriptional level by miRNA-210 (45). Furthermore, a study in children with IDA found that miRNA-210 is associated not only with iron status but also with the hypercoagulability index (13).
Similarly, increased miRNA-210 levels were observed in patients with β-thalassemia/HbE, and this increase has been reported to correlate with their anemic status (46). These findings support the possibility that miRNA-210 may be a sensitive indicator reflecting anemia-related hypoxia. In addition, a study examining the effects of HD on the serum miRNA profile indicated that miRNA-210 levels changed and that these changes may be linked to hypoxia-related cellular adaptation mechanisms (47).
miR-21 has been associated with neointimal hyperplasia, restenosis, and vascular remodeling in HD vascular access pathology. Its increased expression in both vascular tissue and circulation has been linked to access failure. Clinical and translational studies have demonstrated that elevated miR-21 levels may be associated with an increased risk of post-angioplasty restenosis (48). Furthermore, the CKD literature identifies miR-21 as one of the prominent “candidate” miRNAs implicated in kidney disease (49).
miR-210 is a classical hypoxamir regulated through the HIF pathway and influences mitochondrial metabolism and iron–sulfur (Fe-S) cluster biogenesis by repressing Iron–Sulfur Cluster Scaffold Protein 1/2 (ISCU1/2). Through this mechanism, miR-210 establishes a link between hypoxia, iron metabolism, and erythropoiesis (29, 50). Increased miR-210 expression has been observed in cells and tissues in response to hypoxia, and this elevation has been associated with modulation of hypoxic injury in renal cell models (10). In iron deficiency, reduced oxygen delivery to tissues activates HIF-1α, leading to upregulation of miR-210. Sak et al. (12) and Özdemir et al. (13) reported significantly elevated miR-210 levels in patients with IDA. Moreover, Felaco et al. (35) demonstrated that EPO may induce miR-210 expression through the JAK2/STAT5 signaling pathway.
In the context of dialysis, miR-21 and miR-210 were detected only at trace levels in dialysate or ultrafiltrate, indicating that they are not substantially cleared during dialysis. This finding highlights that the timing of pre- and post-dialysis sampling is critical for interpretation, while also suggesting that circulating miRNAs are relatively stable from a technical standpoint (17). In both CKD and HD groups, circulating miRNA profiles, particularly endothelial and inflammatory miRNAs such as miR-126 and miR-155, have been reported to vary according to disease stage (49).
In this context, the use of miR-210 as a biomarker to differentiate IDA from FID in HD patients is pathophysiologically supported by its dual role in reflecting both hypoxia and disrupted iron metabolism.
Consistent with the literature, our study demonstrated that plasma miR-210 levels were significantly elevated in HD patients with IDA. This increase can be interpreted as a molecular reflection of adaptive responses to decreased tissue oxygenation caused by low Hb levels and impaired iron metabolism. Moreover, the observed negative correlations between miR-210 and key hematological parameters such as Hb and TSAT suggest that miR-210 may be sensitive to changes in iron homeostasis and erythropoietic activity.
Previous studies have largely examined anemia using broad and nonspecific definitions, without adequately distinguishing between IDA and FID. These two conditions are biologically distinct: IDA primarily reflects true iron depletion, whereas FID represents a state in which iron stores are sufficient but its mobilization is impaired, often due to underlying inflammation. Failure to distinguish between these phenotypes limits the interpretability of findings. Our study aimed to address this gap by clearly separating IDA and FID within a well-characterized HD cohort. Furthermore, to minimize variability introduced by the clearance effect of dialysis on circulating biomolecules, all blood samples were standardized to the pre-dialysis period.
In this study, miR-210 levels were evaluated alongside both standard clinical biomarkers (Hb, ferritin, TSAT) and the research-based parameter ZnPP. This comprehensive approach enabled us to demonstrate that miR-210 reflects not only a general hypoxic response but also, more specifically, iron deficiency–related hypoxia, providing new insights into anemia mechanisms in HD patients. Unlike previous studies that focused primarily on vascular miRNAs, such as miR-21, our work positions miR-210 within the context of iron metabolism and hypoxia, thereby expanding the current understanding of the biological role of circulating miRNAs in CKD and dialysis populations.
The findings of this study suggest that miR-210 could be integrated into clinical practice as a supportive biomarker, alongside conventional hematological and biochemical parameters. Further research with more extensive causal and functional studies is needed to clarify the role of miR-210 in iron deficiency–related biological processes, which may ultimately contribute to the development of more personalized and targeted strategies for the diagnosis and treatment of anemia.
This study has several limitations that should be considered. First, the relatively small sample size limits both the statistical power and the generalizability of the findings. Additionally, the single-center and cross-sectional design of the study makes it difficult to establish causal relationships and limits the ability to generalize the results to different patient populations.
Since the primary objective of this study was to differentiate between IDA and FID within the HD population, a healthy control group was not included. However, this limitation hinders the establishment of reference ranges for miR-210 and restricts the generalizability of the findings to broader populations. Future studies involving healthy individuals and non-dialysis CKD patients are warranted to facilitate the determination of clinically meaningful cut-off values for miR-210.
Finally, no functional validation was performed at the molecular level. Although this study demonstrated that circulating miR-210 is associated with anemia status in HD patients and negatively correlated with Hb and TSAT levels, downstream molecular targets such as ISCU1/2 or HIF-1α, as well as its functional roles in iron metabolism and hypoxia pathways, were not investigated. Therefore, future multicenter and longitudinal studies incorporating protein-level analyses and cellular models are needed to confirm these findings causally and to better understand the clinical utility of miR-210.
The reference list from the paper itself. Each links out to its DOI / PubMed record.
- 1Gafter-Gvili A Schechter A Rozen-Zvi B. Iron deficiency anemia in chronic kidney disease. Acta Haematol. (2019) 142:44–50. doi: 10.1159/000496492, 30970355 · doi ↗ · pubmed ↗
- 2Kazmi S Zarovniaeva V Cortez Perez K Sandhu S Anwar S Mohammed L. Iron-deficiency anemia in chronic kidney disease: a literature review of its pathophysiology, diagnosis, and management. Cureus. (2025)10.7759/cureus.77598 PMC 1183048839958087 · doi ↗ · pubmed ↗
- 3KDIGO. Clinical practice guideline for the evaluation and management of chronic kidney disease. Kidney Int Suppl. (2012) 3:1–150.
- 4Astor BC Muntner P Levin A Eustace JA Coresh J. Association of kidney function with anemia. Arch Intern Med. (2002) 162:1401. doi: 10.1001/archinte.162.12.1401, 12076240 · doi ↗ · pubmed ↗
- 5Tawfik YMK Billingsley H Bhatt AS Aboelsaad I Al-Khezi OS Lutsey PL . Absolute and functional iron deficiency in the US, 2017-2020. JAMA Netw Open. (2024) 7:e 2433126. doi: 10.1001/jamanetworkopen.2024.33126, 39316402 PMC 11423176 · doi ↗ · pubmed ↗
- 6Hill NR Fatoba ST Oke JL Hirst JA O’Callaghan CA Lasserson DS . Global prevalence of chronic kidney disease – a systematic review and meta-analysis. P Lo S One. (2016) 11:e 0158765. doi: 10.1371/journal.pone.0158765, 27383068 PMC 4934905 · doi ↗ · pubmed ↗
- 7Sany D El Shahawi Y Taha J. Diagnosis of iron deficiency in hemodialysis patients: usefulness of measuring reticulocyte hemoglobin equivalent. Saudi J Kidney Dis Transpl. (2020) 31:1263–72. doi: 10.4103/1319-2442.308335, 33565438 · doi ↗ · pubmed ↗
- 8Bavelloni A Ramazzotti G Poli A Piazzi M Focaccia E Blalock W . Mi RNA-210: a current overview. Anticancer Res. (2017) 37:7105. doi: 10.21873/anticanres.12107, 29187425 · doi ↗ · pubmed ↗