Identification of preschool children's physical fitness phenotypes and their association with multidimensional body shape indicators: a data-driven approach with risk prediction modeling
Xiaoxiao Chen, Deqiang Zhao, Aoyu Zhang, Xiang Pan, Chuanmiao Wang, Jiaxin Chen, Yanfeng Zhang

TL;DR
This study identifies distinct physical fitness profiles in preschool children and develops a body shape-based screening tool to predict low fitness, improving on traditional BMI measures.
Contribution
A data-driven method identifies fitness profiles and a new composite index for predicting low fitness in preschoolers using multidimensional body shape indicators.
Findings
Three distinct physical fitness profiles (low, moderate, high) were identified in preschool children.
A composite body shape index using waist circumference and pelvic width outperformed BMI in predicting low fitness.
The index showed strong predictive performance with an AUC of 0.779 and consistent results in sex-stratified analyses.
Abstract
Traditional physical fitness assessments in young children often rely on single indicators, which fail to capture integrated ability patterns. The common use of body mass index (BMI) to link morphology and fitness has limited discriminant validity. This study aimed to identify naturally emerging physical fitness profiles among preschool children in Macao using a data-driven approach and to develop a screening tool based on multi-dimensional body shape indicators—beyond BMI—for identifying children at risk of low physical fitness. The sample comprised 3,180 children aged 3–6 years from the Macao China Physical Fitness Surveillance and Physical Activity Survey (2010, 2015, 2020). K-means clustering was performed on six standardized physical fitness test scores to identify intrinsic fitness profiles. One-way ANOVA was used to compare body shape indicators across clusters. Using the…
Click any figure to enlarge with its caption.
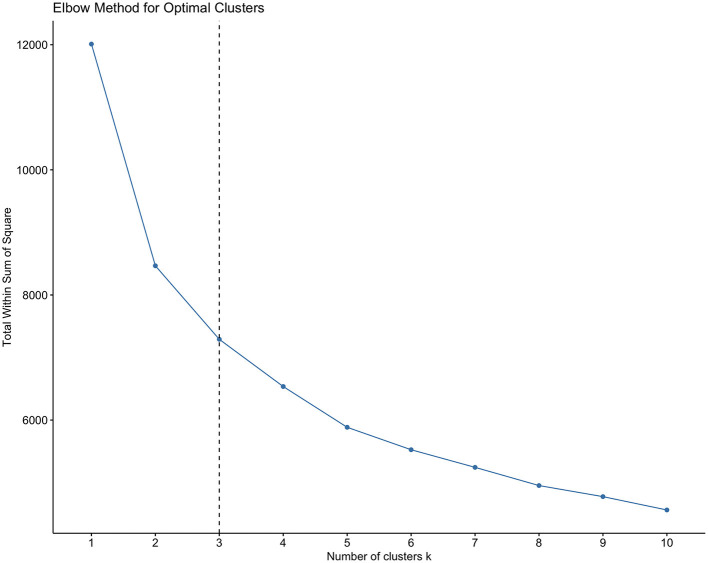 Figure 1
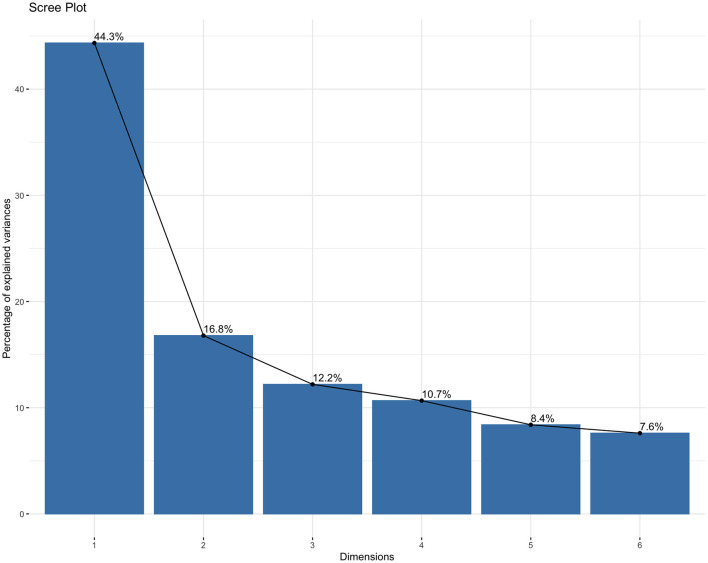 Figure 2
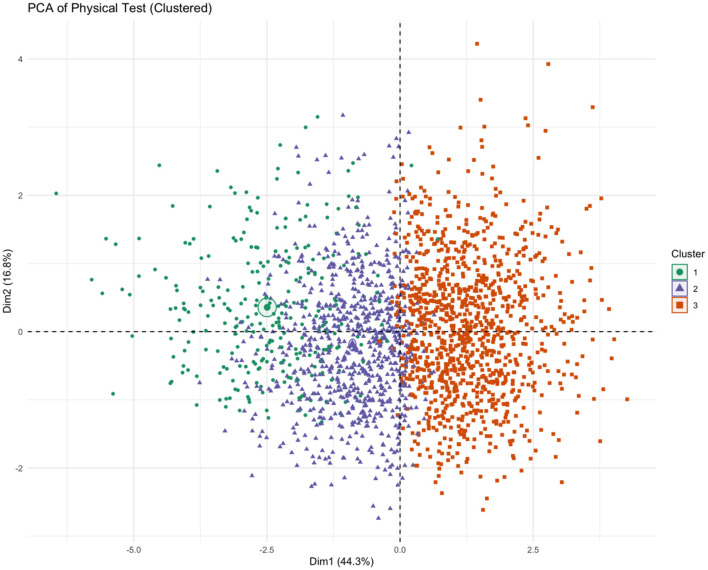 Figure 3
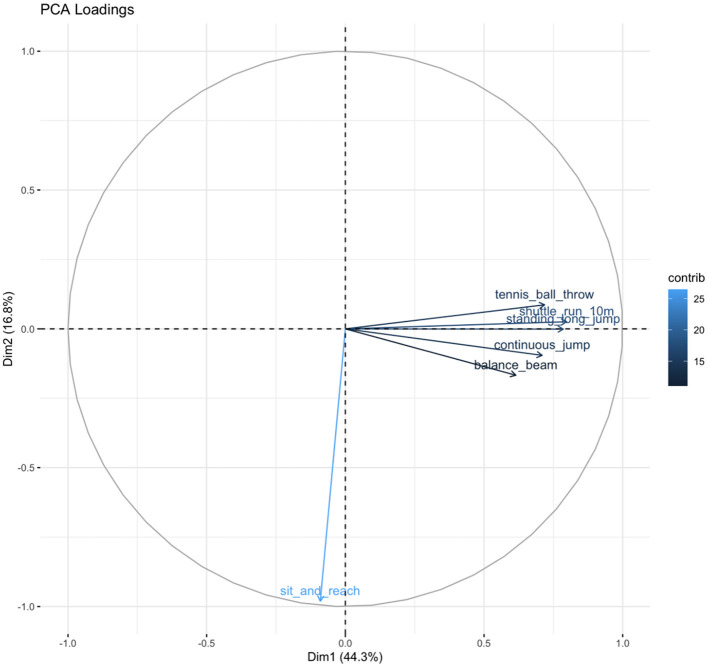 Figure 4
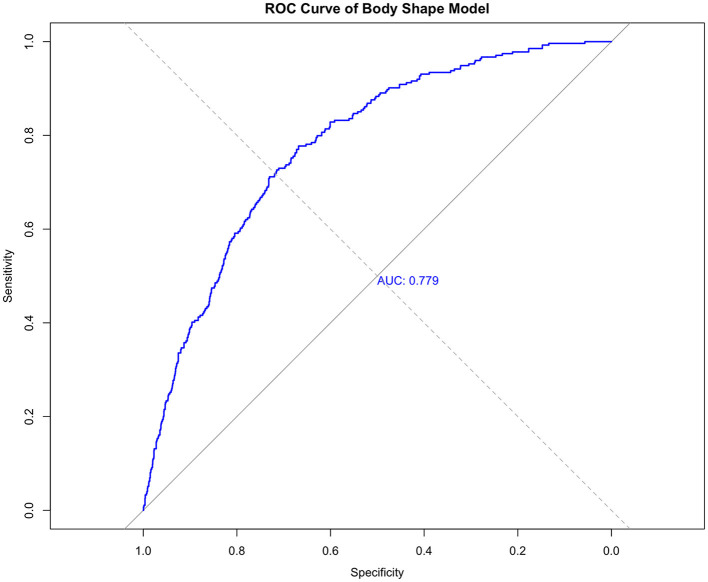 Figure 5
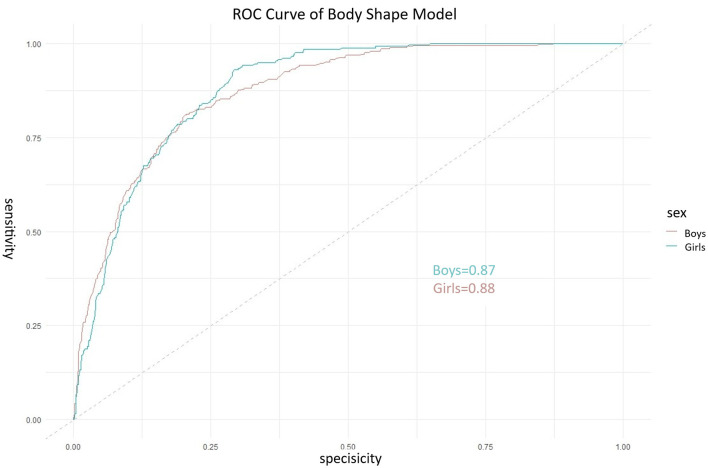 Figure 6
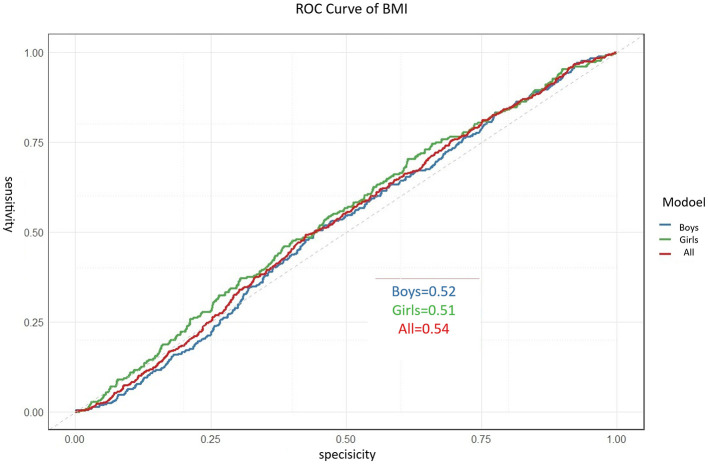 Figure 7
|
|
|
|
|
|
|---|---|---|---|---|
| 3 | 136 | 72 | 208 | |
| 2010 | 4 | 173 | 108 | 281 |
| 5 | 175 | 98 | 273 | |
| 6 | 95 | 73 | 168 | |
| 3 | 142 | 91 | 233 | |
| 4 | 170 | 119 | 289 | |
| 2015 | 5 | 205 | 139 | 344 |
| 6 | 89 | 82 | 171 | |
| 3 | 209 | 132 | 341 | |
| 2020 | 4 | 189 | 125 | 314 |
| 5 | 222 | 160 | 382 | |
| 6 | 98 | 78 | 176 | |
| Total | 1,903 | 1,277 | 3,180 |
|
|
|
|
|
|
|
|
|
|---|---|---|---|---|---|---|---|
| 1 | 412 | −1.24 ± 0.62 | −1.00 ± 0.54 | 0.13 ± 0.87 | −1.58 ± 1.12 | −2.65 ± 1.25 | −1.60 ± 1.47 |
| 2 | 1,200 | −1.04 ± 0.58 | −0.84 ± 0.51 | 0.28 ± 0.89 | −0.99 ± 0.77 | −0.22 ± 0.59 | −0.83 ± 0.96 |
| 3 | 1,568 | 0.00 ± 0.64 | −0.09 ± 0.72 | 0.02 ± 0.94 | 0.13 ± 0.52 | 0.15 ± 0.61 | 0.25 ± 0.51 |
|
|
|
|
|
|
|
|---|---|---|---|---|---|
| Height (cm) | 1 | 98.10 ± 4.42 | 371.971 | 0.190 | < 0.001 |
| 2 | 100.25 ± 4.76 | ||||
| 3 | 105.24 ± 5.01 | ||||
| Sit height (cm) | 1 | 56.30 ± 2.50 | 237.131 | 0.130 | < 0.001 |
| 2 | 57.37 ± 2.63 | ||||
| 3 | 59.61 ± 2.93 | ||||
| Weight (kg) | 1 | 14.92 ± 2.07 | 155.278 | 0.125 | < 0.001 |
| 2 | 15.59 ± 2.16 | ||||
| 3 | 17.16 ± 2.55 | ||||
| Chest circumference (cm) | 1 | 51.46 ± 2.86 | 63.433 | 0.089 | < 0.001 |
| 2 | 51.85 ± 2.76 | ||||
| 3 | 53.15 ± 3.06 | ||||
| Waist (cm) | 1 | 48.40 ± 3.56 | 38.543 | 0.025 | < 0.001 |
| 2 | 48.40 ± 3.56 | ||||
| 3 | 49.84 ± 4.02 | ||||
| Hip circumference (cm) | 1 | 53.28 ± 3.92 | 87.505 | 0.052 | < 0.001 |
| 2 | 53.81 ± 3.87 | ||||
| 3 | 55.96 ± 4.21 | ||||
| Shoulder breadth (cm) | 1 | 21.94 ± 1.41 | 121.192 | 0.071 | < 0.001 |
| 2 | 22.30 ± 1.40 | ||||
| 3 | 23.12 ± 1.41 | ||||
| Width of pelvic (cm) | 1 | 16.38 ± 1.27 | 60.978 | 0.132 | < 0.001 |
| 2 | 16.40 ± 1.23 | ||||
| 3 | 16.96 ± 1.15 | ||||
| Foot length (cm) | 1 | 15.53 ± 1.23 | 152.711 | 0.088 | < 0.001 |
| 2 | 15.77 ± 1.01 | ||||
| 3 | 16.50 ± 1.05 |
|
|
|
|
|
|
|---|---|---|---|---|
| Height (cm) | −1.156 (0.215) | 0.315 | 0.207–0.480 | < 0.001 |
| Weight (kg) | −0.412 (0.187) | 0.662 | 0.459–0.955 | 0.028 |
| Waist circumference (cm) | 0.493 (0.098) | 1.637 | 1.351–1.983 | < 0.001 |
| Pelvic width (cm) | 0.225 (0.078) | 1.252 | 1.075–1.459 | 0.004 |
| Hosmer-Lemeshow: χ2 = 6.85, | ||||
|
|
|
|
|
|
|---|---|---|---|---|
| Body shape index (BSI) | 0.779 (0.742–0.800) | 77.7% | 66.8% | Reference |
| BMI-only (Total sample) | 0.54 (0.50–0.58) | 61.5% | 58.3% | Z = 10.15, |
Peer Reviews
No public reviews on file for this paper yet. If you reviewed it on a platform where reviews are public (OpenReview, ICLR, NeurIPS, ICML), you can paste yours below so the community can read it here.
Videos
No videos yet. Explain this paper in a talk, walkthrough, or lecture? Add one.
Taxonomy
TopicsBody Composition Measurement Techniques · Obesity, Physical Activity, Diet · Children's Physical and Motor Development
Introduction
1
The preschool period (3–6 years) is a critical window for the development of fundamental motor skills and physical growth. Fitness levels during this stage not only influence current health, activity participation, and quality of life but also have long-term implications for physical conditioning, habitual physical activity, cognitive ability, school readiness, and social development (1–3). Establishing a scientific, valid, and forward-looking physical fitness assessment system for young children is therefore a central issue in early health promotion and holistic development, with significant implications for precise intervention and population health.
Current fitness assessments typically rely on isolated performance measures (4–6). While useful for evaluating specific motor skills, such approaches fail to capture the multidimensional, synergistic, and heterogeneous nature of overall physical fitness and cannot systematically address the fundamental question of what typical integrated fitness development patterns exist among children (7). This limits holistic understanding and hinders personalized guidance. In parallel, BMI remains the most widely used morphological indicator internationally due to its simplicity. However, its validity is particularly challenged in children aged 3–6 years, a period of rapid and non-uniform changes in body composition (8). Numerous studies note that BMI cannot distinguish between lean mass and fat mass or reflect fat distribution (e.g., central adiposity) (9–11). Evidence suggests that body composition (muscle-to-fat ratio) and fat distribution may be more closely linked to motor competence and metabolic health than overall adiposity (12, 13). Thus, relying solely on BMI provides a fragmented and limited link between morphology and comprehensive physical ability, offering insufficient basis for differentiated health promotion and fitness intervention (14).
To address these gaps, prior research has often correlated single fitness tests with isolated anthropometrics or focused on long-term growth indices. However, a significant methodological gap exists in objectively identifying holistic fitness phenotypes from multi-test data and subsequently linking these phenotypes to a practical, multidimensional morphological screening tool suitable for immediate risk assessment. This study aims to fill this gap. Specifically, this study aimed to: (1) identify naturally emerging physical fitness phenotypes among preschool children in Macao using data-driven clustering; (2) examine the association between these phenotypes and multidimensional body shape indicators; (3) develop and validate a composite body shape index for screening children at risk of low physical fitness. The application of unsupervised machine learning (cluster analysis) represents a substantive methodological advance by shifting the analytical focus from comparing children on isolated tests to identifying their inherent, integrated ability patterns. This approach is grounded in the recognition that physical fitness is a latent construct best revealed through pattern recognition in multi-dimensional data.
Methods
2
Participants
2.1
Data were drawn from the Macao China Physical Fitness Surveillance and Physical Activity Survey (2010, 2015, 2020), which used stratified random cluster sampling with one-year age groups (15). The study included 3,180 children aged 3–6 years. Parents or guardians provided written informed consent, and the study was approved by the Ethics Committee of the China Institute of Sport Science (CISS-2019-06-07). While combining data from three waves increases sample size and generalizability within the Macao context, we acknowledge the potential for unmeasured cohort or period effects as a study limitation. Data collection followed standardized national protocols with trained examiners to ensure consistency, although formal inter-rater reliability metrics were not recorded for all waves.
Measures
2.2
Height and weight were measured following the China Physical Fitness Standards for Preschool Children (CPFS-preschool) manual, and BMI was calculated. Physical fitness was assessed using six tests: standing long jump, tennis ball throw, 10-m shuttle run, 15-m obstacle run, sit-and-reach, and balance beam walk, administered according to CPFS-preschool guidelines (16). Raw scores were standardized (Z-scores) by age and sex. All raw scores were converted to age- and sex-specific Z-scores based on the entire combined sample to control for developmental differences prior to clustering, aligning with our aim to identify fitness patterns independent of normal age/sex variation.
Data analysis
2.3
Clustering analysis.
2.3.1
To identify latent fitness profiles, K-means clustering was performed on the six standardized fitness Z-scores. The choice of K-means was justified by its efficiency with large samples, its common use for phenotype discovery, and the standardized, continuous nature of our variables. We addressed key assumptions and stability: (1) variables were standardized to equalize scales; (2) the Euclidean distance metric was used; (3) the algorithm was run with 50 random initializations to minimize the impact of initial centroid placement and achieve a stable solution; (4) cluster stability was assessed by calculating the average silhouette width (0.41), indicating fair structure. The optimal number of clusters (k = 3) was determined using the elbow method and scree plot of within-cluster sum of squares. To support the suitability of the data for structure detection, we report the Kaiser-Meyer-Olkin (KMO) measure of sampling adequacy (0.82) and Bartlett's test of sphericity (p < 0.001). We clarify that these tests indicate the data's suitability for multivariate analysis (like PCA used for visualization) rather than directly validating the cluster solution.
Group comparisons.
2.3.2
One-way ANOVA was used to compare body shape indicators across the three clusters. Assumptions of homogeneity of variance and normality were tested using Levene's test and Shapiro-Wilk test on residuals, respectively. For indicators where Levene's test was significant (p < 0.05), Welch's ANOVA was applied, and this is specified in the results. Effect sizes are reported using Cohen's f. Post-hoc comparisons used Tukey's HSD test.
Predictive modeling.
2.3.3
Logistic regression was performed with the low-fitness cluster as the dependent variable (1 = low, 0 = moderate/high) and all body shape indicators as potential predictors. Model building followed a purposeful selection approach. Key demographic covariates (age, sex, survey year) were examined. Age and sex were not included as their effects were already statistically controlled for via Z-score standardization of the fitness outcomes used to define the dependent variable. Including them again in the prediction model could lead to over-adjustment. Survey year was tested as a covariate but was not a significant predictor (p = 0.43) and did not improve model fit (Likelihood Ratio Test p = 0.41), thus it was excluded for parsimony. Multicollinearity was assessed using variance inflation factors (VIF < 5). A composite Body Shape Index was derived from the final model's coefficients.
Validation and comparison
2.3.4
The index's discriminative performance was evaluated using ROC curve analysis. The area under the curve (AUC) with 95% confidence interval (derived from 1,000 bootstrap samples) was reported. Sensitivity and specificity at the optimal cut-off (Youden's index) were calculated. Internal validity was assessed via 10-fold cross-validation, reporting the mean cross-validated AUC. To formally test the claimed superiority over BMI, a separate logistic regression model using only BMI as a predictor was fitted, and its ROC curve was compared to the composite index's ROC curve using DeLong's test for two correlated ROC curves. Additionally, analyses were stratified by sex to explore potential differences, with ROC curves reported for boys and girls separately. All analyses used α = 0.05 and were performed in R (version 4.3.1).
Results
3
Sample characteristics
3.1
The final sample included 3,180 children (1,903 boys, 1,277 girls) across three survey years (Table 1).
Identification of physical fitness phenotypes
3.2
K-means clustering on the six fitness Z-scores yielded a stable 3-cluster solution (Figures 1, 2). The clusters were characterized as: Cluster 1 (Low Fitness, n = 412), Cluster 2 (Moderate Fitness, n = 1,200), and Cluster 3 (High Fitness, n = 1,568) (Table 2). The clustering solution explained 39.3% of the total variance (R^2^ = 0.393). Principal Component Analysis (PCA) for visualization showed clear separation of the three clusters in the space of the first two principal components (cumulative variance explained = 61.1%) (Figures 3, 4).
Elbow method for optimal clusters.
Scree plot.
PCA biplot.
PCA loading.
Association between fitness phenotypes and body shape
3.3
All nine body shape indicators differed significantly across the three clusters (all p < 0.001). Standard ANOVA was used for height, sit height, weight, chest circumference, hip circumference, shoulder breadth, and foot length. Welch's ANOVA was applied for waist circumference and pelvic width due to significant heteroscedasticity (Levene's test p < 0.05). As shown in Table 3, a clear gradient was observed: the High Fitness cluster had the most developed body shape metrics, followed by the Moderate and Low Fitness clusters. Effect sizes (Cohen's f) ranged from small (0.025 for waist circumference) to medium-large (0.190 for height).
Development of the composite body shape index
3.4
Multivariate logistic regression (low fitness cluster as reference) identified four significant predictors: height (β = −1.156, p < 0.001), weight (β = −0.412, p = 0.028), waist circumference (β = 0.493, p < 0.001), and pelvic width (β = 0.225, p = 0.004). The derived body shape index was:
BSI = −2.376 – 1.156 × Height (cm) – 0.412 × Weight (kg) + 0.493 × Waist Circumference (cm) + 0.225 × Pelvic Width (cm). Higher values of waist circumference and pelvic width increased the odds of low fitness, while greater height and weight decreased it. The model showed no significant multicollinearity (all VIFs < 2.5) and adequate fit (Hosmer-Lemeshow test p = 0.553) (Table 4).
Predictive performance and validation
3.5
The ROC curve for the BSI is shown in Figure 5. The apparent AUC was 0.779 (95% CI: 0.742–0.800). The 10-fold cross-validated mean AUC was 0.765 (SD = 0.021), indicating robust internal validity. At the optimal cut-off score of −2.003, sensitivity was 77.7% and specificity was 66.8%. Further analysis regarding gender differences revealed that the composite body shape index demonstrated good predictive performance in both boys and girls. In the subsample of boys, the area under the curve (AUC) of the BSI for predicting low physical fitness risk was 0.87 (95% CI: 0.84–0.90), while in the subsample of girls, the AUC was 0.88 (95% CI: 0.85–0.91). These results suggest that within the current preschool-aged population of 3–6 years, the body shape index developed in this study shows consistent applicability and strong predictive ability across sexes. Nevertheless, if sex-specific models were to be constructed separately, the regression coefficients might differ, which presents a potential direction for refinement in future research. The comparative analysis and sex-stratified results are visually presented in Figure 6 through ROC curves.
Receiver operating characteristic (ROC) curve for the composite body shape index in predicting the low physical fitness phenotype.
Receiver operating characteristic (ROC) curves of the composite Body Shape Index for predicting low physical fitness risk, stratified by sex. The solid line represents the ROC curve for boys (AUC = 0.87), and the dashed line represents the ROC curve for girls (AUC = 0.88). The diagonal gray line indicates the reference line of no discrimination (AUC = 0.50). The close and high AUC values in both sexes demonstrate the strong and consistent predictive ability of the BSI across genders in this population.
Comparison with BMI and sex-stratified analysis
3.6
To validate the superiority of the constructed Body Shape Index (BSI), we conducted a direct comparison with the traditional BMI. Separate logistic regression models, using only age- and sex-standardized BMI as the predictor, were fitted for boys, girls, and the combined sample to predict membership in the low physical fitness phenotype. The discriminative performance of BMI was limited in all groups. The area under the curve (AUC) was 0.52 (95% CI: 0.47–0.57) for boys, 0.51 (95% CI: 0.46–0.56) for girls, and 0.54 (95% CI: 0.50–0.58) for the total sample (Figure 7). These results indicate that BMI alone has only marginal discriminative ability, with AUC values not meaningfully exceeding the chance level of 0.5, in identifying children at risk of low physical fitness in this study population.
Receiver operating characteristic (ROC) curves of BMI for predicting low physical fitness phenotype in preschool children. Results are shown for the total sample and stratified by sex. The AUC (95% Confidence Interval) values were 0.54 for the total sample, 0.52 for boys, and 0.51 (0.46–0.56) for girls. The diagonal gray line indicates the reference line of no discrimination (AUC = 0.5).
To formally test the difference in diagnostic performance between the composite BSI and the BMI-only model, we performed DeLong's test for two correlated ROC curves using the total sample. The results are summarized in Table 5. The BSI demonstrated a significantly larger AUC (0.779) compared to the BMI-only model for the total sample (0.54), with a difference of 0.239 (Z = 10.15, p < 0.001). This provides statistical confirmation of the superior discriminant validity of the proposed body shape index over the traditional BMI metric.
Discussion
4
This study achieved its 3-fold aim. First, using a data-driven clustering approach with enhanced methodological reporting, we identified three distinct, naturally emerging physical fitness phenotypes among preschool children. Second, we established strong gradient associations between these phenotypes and a range of body shape indicators. Third, and most innovatively, we developed and validated a composite Body Shape Index (BSI) that demonstrates good performance in screening for low fitness risk, with statistical evidence supporting its discriminant advantage over the traditional BMI metric in our sample.
The core methodological contribution lies in the sequential application of unsupervised learning (for phenotype discovery) and supervised learning (for index development), bridging the gap between holistic pattern identification and practical screening tool creation. The gradient in body shape across fitness clusters underscores the integrated nature of physical development. The logistic regression model provides a quantitative link, revealing that after accounting for overall body size (height and weight), specific circumferential, and skeletal breadth measures (waist circumference and pelvic width) are independently associated with fitness risk (17). This suggests that body proportions and fat distribution may be more sensitive morphological correlates of integrated fitness in young children than body size alone (18, 19), which aligns with and extends critiques of BMI, as it does not differentiate these dimensions (20, 21).
Compared to prior work focusing on single test correlations or long-term growth indices, our study shifts the application scenario toward immediate, cross-sectional risk screening (16, 22, 23). The BSI's discriminative ability (AUC = 0.779) and its statistically significant superiority over BMI (AUC = 0.54; p < 0.001 per DeLong's test) highlight its potential as a more informative morphological indicator in this context. Furthermore, the sex-stratified analysis revealed that the BSI performed consistently well for both boys (AUC = 0.87) and girls (AUC = 0.88), supporting its internal generalizability within the preschool age range of our study population. Taken together, these findings suggest that the BSI, based on simple anthropometric measures, could serve as a promising preliminary screening tool to identify children who may benefit from more comprehensive fitness assessments.
However, our interpretations are tempered by the study's design and methodological choices. We acknowledge that the cross-sectional data preclude causal inferences between morphology and fitness phenotypes. Furthermore, the decision not to include age, sex, and survey year as covariates in the final predictive model was based on statistical and conceptual grounds (i.e., prior control via Z-score standardization for age/sex, and non-significance of survey year), which we argue prevents over-adjustment. Nonetheless, this choice, along with the potential for unmeasured cohort effects from combining survey waves, should be considered when interpreting the model's coefficients and generalizing findings. Critically, the external validity of the BSI requires confirmation in independent and diverse populations, and its predictive utility over time warrants longitudinal investigation before it can be recommended for clinical or public health practice. The current findings primarily offer a methodological advancement and a proof-of-concept for an integrated, morphology-based screening approach.
Conclusion
5
This study identified three distinct physical fitness phenotypes among preschool children using a data-driven clustering approach. The derived composite Body Shape Index (BSI), integrating height, weight, waist circumference, and pelvic width, demonstrated good and consistent discriminative ability for identifying children at risk of low fitness (AUC = 0.779), significantly outperforming BMI alone. While promising as a practical screening tool for rapid risk stratification during routine health checks, its cross-sectional design and single-population origin necessitate future longitudinal and external validation. The methodological integration of unsupervised and supervised learning offers a novel framework for translating holistic fitness patterns into actionable screening indices.
The reference list from the paper itself. Each links out to its DOI / PubMed record.
- 1Chopra G. Development during the preschool years. In:Chopra G, editor. Systems Approach to Early Childhood Development: Bridging Theory, Policy and Practice. Singapore: Springer Nature Singapore (2025). p. 49–74.
- 2Tan JSY Lim CBS. The development of gross motor skills in children: insights from the motor assessment test for children. J Exp Child Psychol. (2025) 256:106255. doi: 10.1016/j.jecp.2025.10625540220729 · doi ↗ · pubmed ↗
- 3Dapp LC Gashaj V Roebers CM. Physical activity and motor skills in children: a differentiated approach. Psychol Sport Exerc. (2021) 54:101916. doi: 10.1016/j.psychsport.2021.101916 · doi ↗
- 4Capio CM Eguia KF. Movement skills, perception, and physical activity of young children: a mediation analysis. Pediatr Int. (2021) 63:442–7. doi: 10.1111/ped.1443632786106 · doi ↗ · pubmed ↗
- 5Migueles JH Solis-Urra P. Assessment of physical activity in children and adolescents. In:García-Hermoso A, editor. Promotion of Physical Activity and Health in the School Setting. Cham: Springer Nature Switzerland (2024). p. 89–105.
- 6Ke D Maimaitijiang R Shen S Kishi H Kurokawa Y Suzuki K. Field-based physical fitness assessment in preschool children: a scoping review. Front Pediatr. (2022) 10:2022. doi: 10.3389/fped.2022.93944235989998 PMC 9387554 · doi ↗ · pubmed ↗
- 7Valentini NC. Motor skill assessment in children and adolescents. In:García-Hermoso A, editor. Promotion of Physical Activity and Health in the School Setting. Cham: Springer Nature Switzerland (2024). p. 133–63.
- 8Bell KA Wagner CL Perng W Feldman HA Shypailo RJ Belfort MB. Validity of body mass index as a measure of adiposity in infancy. J Pediatr. (2018) 196:168–74. doi: 10.1016/j.jpeds.2018.01.02829551311 PMC 5924641 · doi ↗ · pubmed ↗