Nomogram model for predicting incomplete immune reconstitution in people living with HIV based on clinical characteristics
Yaqiong Zhang, Wenjia Hu, Xiaoxia Zhang, Yulin Zhang, Zhongwei Zhang, Qunqun Jiang, Shan Wang, Yong Nan, Shihui Song, Yong Xiong

TL;DR
This study creates a prediction model to identify people with HIV who may not fully recover their immune system despite treatment, helping doctors provide better care.
Contribution
A novel nomogram model is developed to predict incomplete immune reconstitution in HIV patients based on clinical characteristics.
Findings
Baseline CD4+ T cell count, age at ART initiation, and AST level were confirmed as independent predictors of immune non-response.
The nomogram achieved AUC values of 0.896 in training, 0.903 in internal validation, and 0.766 in external validation.
The model shows strong discrimination, calibration, and clinical utility for identifying immune non-responders.
Abstract
Despite the success of antiretroviral therapy (ART) for human immunodeficiency virus (HIV) in China, immune non-response (INR) remains critical for the long-term quality of life of people living with HIV (PLWH). Although the consensus on diagnosis and management of immunological non-responders in HIV infection (Version 2023) was published in China to standardize diagnostic criteria, prediction models for INR based on these criteria remain scarce. This study aims to develop and validate a nomogram model for early identification of INR risk based on the diagnostic criteria in this consensus, so as to facilitate clinical intervention. In this retrospective study, the primary cohort included 615 PLWH who initiated ART and completed over 4 years of follow-up at Zhongnan Hospital of Wuhan University (January 2016 to May 2025). They were randomly split into a training set (n=433) and an…
Genes, proteins, chemicals, diseases, species, mutations and cell lines named across the full text — each resolved to its canonical identifier and authoritative record.
Click any figure to enlarge with its caption.
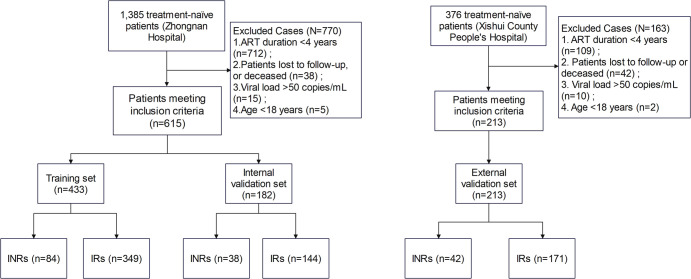 Figure 1
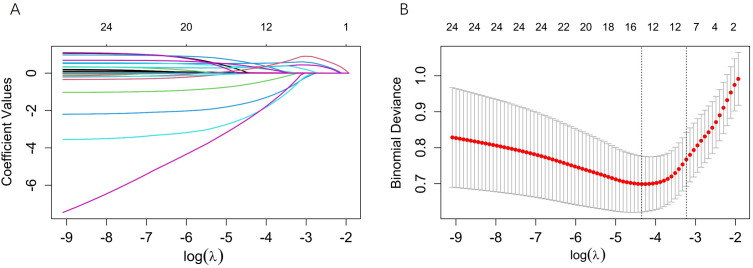 Figure 2
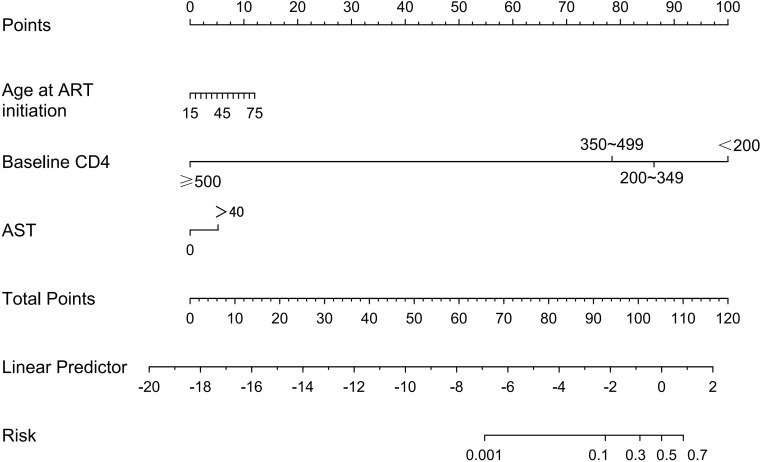 Figure 3
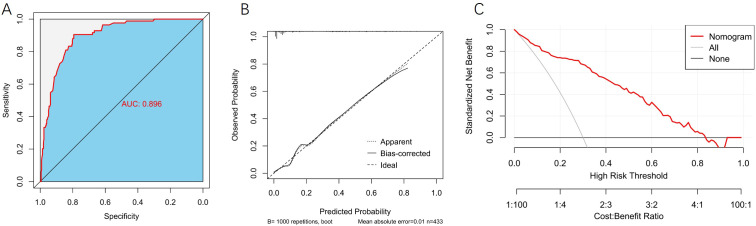 Figure 4
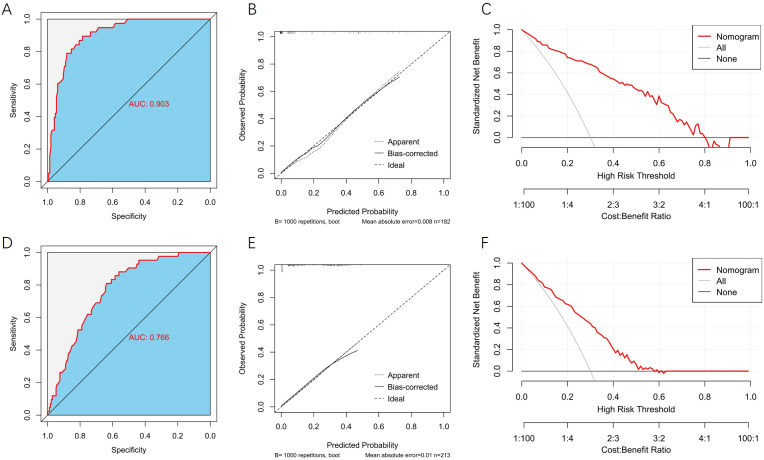 Figure 5
| Variable | Training set (N = 433) | Internal validation set (N = 182) | External validation set (N = 213) | P1-value | P2-value |
|---|---|---|---|---|---|
| Sex (%) | 0.454 | < 0.001 | |||
| Female | 22(5.08%) | 12(6.59%) | 56(26.29%) | ||
| Male | 411(94.92%) | 170(93.41%) | 157(73.71%) | ||
| Route of Infection (%) | 0.445 | < 0.001 | |||
| Heterosexual Transmission | 122(28.18%) | 43(23.63%) | 150(70.42%) | ||
| Homosexual Transmission | 306(70.67%) | 138(75.82%) | 44(20.66%) | ||
| Others | 5(1.15%) | 1(0.55%) | 19(8.92%) | ||
| ART Regimen (%) | 0.555 | < 0.001 | |||
| NRTI+NNRTI | 358(82.68%) | 145(79.67%) | 210(98.59%) | ||
| NRTI+INSTI | 68(15.70%) | 35(19.23%) | 3(1.41%) | ||
| Others | 7(1.62%) | 2(1.10%) | 0(0.00%) | ||
| HBsAg (%) | 0.688 | 0.628 | |||
| Negative | 403(93.07%) | 171(93.96%) | 196(92.02%) | ||
| Positive | 30(6.93%) | 11(6.04%) | 17(7.98%) | ||
| Anti-HCV (%) | 0.636 | 0.066 | |||
| Negative | 430(99.31%) | 180(98.90%) | 207(97.18%) | ||
| Positive | 3(0.69%) | 2(1.10%) | 6(2.82%) | ||
| Baseline CD4+ T Cell Count (%) | 0.785 | < 0.001 | |||
| <200 | 134(30.95%) | 63(34.62%) | 110(51.64%) | ||
| 200~349 | 139(32.10%) | 56(30.77%) | 71(33.33%) | ||
| 350~499 | 105(24.25%) | 39(21.43%) | 22(10.33%) | ||
| ≥500 | 55(12.70%) | 24(13.19%) | 10(4.69%) | ||
| BMI (%) | 0.416 | 0.069 | |||
| 18.5~23.9 | 278(64.20%) | 125(68.68%) | 142(66.67%) | ||
| <18.5 | 48(11.09%) | 21(11.54%) | 33(15.49%) | ||
| >23.9 | 107(24.71%) | 36(19.78%) | 38(17.84%) | ||
| WHO Clinical Stage (%) | 0.157 | 0.010 | |||
| I-II | 234(54.04%) | 87(47.80%) | 92(43.19%) | ||
| III-IV | 199(45.96%) | 95(52.20%) | 121(56.81%) | ||
| WBC (%) | 0.491 | 0.003 | |||
| ≥4 | 339(78.29%) | 147(80.77%) | 144(67.61%) | ||
| <4.0 | 94(21.71%) | 35(19.23%) | 69(32.39%) | ||
| PLT (%) | 0.859 | < 0.001 | |||
| ≥100 | 415(95.84%) | 175(96.15%) | 182(85.45%) | ||
| <100 | 18(4.16%) | 7(3.85%) | 31(14.55%) | ||
| Hb (%) | 0.712 | < 0.001 | |||
| ≥120 | 371(85.68%) | 158(86.81%) | 145(68.08%) | ||
| <120 | 62(14.32%) | 24(13.19%) | 68(31.92%) | ||
| Abnormal SCr (%) | 0.728 | < 0.001 | |||
| No | 427(98.61%) | 179(98.35%) | 198(92.96%) | ||
| Yes | 6(1.39%) | 3(1.65%) | 15(7.04%) | ||
| TG (%) | 0.949 | 0.136 | |||
| <1.70 | 327(75.52%) | 137(75.27%) | 172(80.75%) | ||
| ≥1.70 | 106(24.48%) | 45(24.73%) | 41(19.25%) | ||
| TC (%) | 0.466 | 0.367 | |||
| <5.18 | 398(91.92%) | 164(90.11%) | 200(93.90%) | ||
| ≥5.18 | 35(8.08%) | 18(9.89%) | 13(6.10%) | ||
| ALT (%) | 0.761 | 0.010 | |||
| ≤50 | 367(84.76%) | 156(85.71%) | 196(92.02%) | ||
| >50 | 66(15.24%) | 26(14.29%) | 17(7.98%) | ||
| AST (%) | 0.761 | 0.045 | |||
| ≤40 | 367(84.76%) | 156(85.71%) | 167(78.40%) | ||
| >40 | 66(15.24%) | 26(14.29%) | 46(21.60%) | ||
| Age at ART Initiation (years) | 29.00(24.00,39.50) | 29.00(23.00,42.00) | 45.00(35.00,54.00) | 0.816 | < 0.001 |
| Delay in ART Initiation (days) | 27.00(16.00,56.00) | 23.00(15.75,56.25) | 31.00(15.00,176.00) | 0.751 | 0.034 |
| Baseline HIV VL (lg (x+1)) | 4.46(3.63,4.99) | 4.52(3.89,5.00) | – | 0.346 | – |
| Variable | IR group (N = 349) | INR group (N = 84) | Statistic | P-value |
|---|---|---|---|---|
| Sex (%) | χ2 = 0.164 | 0.685 | ||
| Female | 17(4.87%) | 5(5.95%) | ||
| Male | 332(95.13%) | 79(94.05%) | ||
| Route of Infection (%) | χ2 = 7.750 | 0.017 | ||
| Heterosexual Transmission | 88(25.21%) | 34(40.48%) | ||
| Homosexual Transmission | 257(73.64%) | 49(58.33%) | ||
| Others | 4(1.15%) | 1(1.19%) | ||
| ART Regimen (n,%) | χ2 = 2.478 | 0.304 | ||
| NRTI+NNRTI | 293(83.95%) | 65(77.38%) | ||
| NRTI+INSTI | 51(14.61%) | 17(20.24%) | ||
| Others | 5(1.43%) | 2(2.38%) | ||
| HBsAg (%) | χ2 = 8.748 | 0.003 | ||
| Negative | 331(94.84%) | 72(85.71%) | ||
| Positive | 18(5.16%) | 12(14.29%) | ||
| Anti-HCV (%) | – | 0.477 | ||
| Negative | 347(99.43%) | 83(98.81%) | ||
| Positive | 2(0.57%) | 1(1.19%) | ||
| Baseline CD4+ T Cell Count (%) | χ2 = 136.515 | < 0.001 | ||
| <200 | 64(18.34%) | 70(83.33%) | ||
| 200~349 | 127(36.39%) | 12(14.29%) | ||
| 350~499 | 103(29.51%) | 2(2.38%) | ||
| ≥500 | 55(15.76%) | 0(0.00%) | ||
| BMI (%) | χ2 = 7.568 | 0.023 | ||
| 18.5~23.9 | 216(61.89%) | 62(73.81%) | ||
| <18.5 | 37(10.60%) | 11(13.10%) | ||
| >23.9 | 96(27.51%) | 11(13.10%) | ||
| WHO Clinical Stage (%) | χ2 = 58.615 | < 0.001 | ||
| I-II | 220(63.04%) | 14(16.67%) | ||
| III-IV | 129(36.96%) | 70(83.33%) | ||
| WBC (%) | χ2 = 45.034 | < 0.001 | ||
| ≥4 | 296(84.81%) | 43(51.19%) | ||
| <4.0 | 53(15.19%) | 41(48.81%) | ||
| PLT (%) | χ2 = 20.898 | < 0.001 | ||
| ≥100 | 342(97.99%) | 73(86.90%) | ||
| <100 | 7(2.01%) | 11(13.10%) | ||
| Hb (%) | χ2 = 43.334 | < 0.001 | ||
| ≥120 | 318(91.12%) | 53(63.10%) | ||
| <120 | 31(8.88%) | 31(36.90%) | ||
| Abnormal SCr (%) | – | 0.330 | ||
| No | 345(98.85%) | 82(97.62%) | ||
| Yes | 4(1.15%) | 2(2.38%) | ||
| TG (%) | χ2 = 0.943 | 0.331 | ||
| <1.70 | 267(76.50%) | 60(71.43%) | ||
| ≥1.70 | 82(23.50%) | 24(28.57%) | ||
| TC (%) | χ2 = 0.009 | 0.925 | ||
| <5.18 | 321(91.98%) | 77(91.67%) | ||
| ≥5.18 | 28(8.02%) | 7(8.33%) | ||
| ALT (%) | χ2 = 7.680 | 0.006 | ||
| ≤50 | 304(87.11%) | 63(75.00%) | ||
| >50 | 45(12.89%) | 21(25.00%) | ||
| AST (%) | χ2 = 19.909 | < 0.001 | ||
| ≤40 | 309(88.54%) | 58(69.05%) | ||
| >40 | 40(11.46%) | 26(30.95%) | ||
| Age at ART Initiation (years) | 27.00(23.00,35.00) | 37.00(29.00,50.00) | Z=6.060 | < 0.001 |
| Delay in ART Initiation (days) | 27.00(16.00,56.00) | 26.50(15.25,55.50) | Z=-0.123 | 0.902 |
| Baseline HIV VL (lg (x+1)) | 4.37(3.45,4.92) | 4.95(4.28,5.50) | Z=5.050 | < 0.001 |
| Variable | OR | 95%CI | P-value |
|---|---|---|---|
| Age at ART Initiation (years) | 1.038 | 1.015~1.062 | 0.001 |
| Baseline CD4+ T Cell Count (/μL) | < 0.001 | ||
| 200~349 | 0.124 | 0.053~0.287 | < 0.001 |
| 350~499 | 0.029 | 0.006~0.148 | < 0.001 |
| ≥500 | 0.000 | 0.000 | 0.997 |
| BMI(kg/m2) | 0.119 | ||
| <18.5 | 0.907 | 0.330~2.499 | 0.851 |
| >23.9 | 0.418 | 0.182~0.958 | 0.039 |
| WBC (<4.0) (109/L) | 1.792 | 0.925~3.471 | 0.084 |
| Hb (<120) (g/L) | 1.487 | 0.691~3.200 | 0.311 |
| AST (>40) (U/L) | 2.602 | 1.212~5.586 | 0.014 |
| WHO Clinical Stage (III-IV) | 0.885 | 0.368~2.124 | 0.784 |
Peer Reviews
No public reviews on file for this paper yet. If you reviewed it on a platform where reviews are public (OpenReview, ICLR, NeurIPS, ICML), you can paste yours below so the community can read it here.
Videos
No videos yet. Explain this paper in a talk, walkthrough, or lecture? Add one.
Taxonomy
TopicsHIV-related health complications and treatments · HIV Research and Treatment · HIV/AIDS Research and Interventions
Introduction
1
According to the latest report from the China Center for Disease Control and Prevention, as of December 31, 2024, there were 1,355,017 people living with human immunodeficiency virus (HIV)/acquired immunodeficiency syndrome (AIDS) in China, with 491,437 cumulative reported deaths (1). Current first-line antiretroviral therapy (ART) in China, typically consisting of nucleoside reverse transcriptase inhibitors (NRTIs) combined with non-nucleoside reverse transcriptase inhibitors (NNRTIs), protease inhibitors (PIs), or integrase strand transfer inhibitors (INSTIs), effectively suppresses viral replication (2). With the widespread application of ART, the viral load suppression rate among people living with HIV (PLWH) in China had risen to 95.4% by the end of 2021 (3). However, despite the significant overall effectiveness of AIDS antiviral therapy and the continuous decline in the population mortality rate, there remains a subset of patients who, despite achieving virological suppression (viral load < 50 copies/mL), experience difficulty in restoring their CD4^+^ T lymphocyte counts to a relatively satisfactory immune function level (≥350 cells/μL). This population is clinically defined as immunological non-responders (INRs) (4). INRs face a substantially higher risk of mortality and opportunistic infections compared to immunological responders (IRs), with non-AIDS-defining events becoming their leading cause of death, severely impacting long-term quality of life (5, 6).
In recent years, immune non-response (INR) has attracted increasing clinical attention, and its occurrence is closely associated with multiple risk factors. Previous studies have shown that advanced age and low pre-treatment CD4^+^ T cell count are major risk factors for INR (7–10). Other reported factors include the route of infection (11), ART regimen (12–14), delayed ART initiation (15), and World Health Organization (WHO) clinical stage (16) are also associated with poor prognosis in PLWH; however, the specific roles of these variables in immune reconstitution assessment remain controversial. Various laboratory parameters, such as white blood cell count (WBC) (17), platelet count (PLT) (18, 19), hemoglobin (Hb) (20, 21), alanine aminotransferase (ALT) (22), aspartate aminotransferase (AST) (16), and serum creatinine (SCr) (23), have also been linked to HIV disease progression and mortality. Furthermore, viral coinfections (e.g., hepatitis B and C) have been confirmed to impede immune recovery (24–26). The pathogenesis of INR has not been fully elucidated. Existing studies suggest that it is associated with an imbalance between T lymphocyte production and apoptosis caused by insufficient thymic output (27, 28), chronic immune activation and T-cell exhaustion (29, 30), intestinal flora disturbance and microbial translocation (31), as well as metabolic abnormalities such as ferroptosis and mitochondrial dysfunction in CD4^+^ T cells (32).
Following a systematic review of the existing literature on prediction models for INR in PLWH, we identified several limitations in current research. First, there is a lack of uniformity in the definition and diagnostic criteria for INR across different studies. This leads to heterogeneity in the outcome variables targeted by the prediction models, making direct comparison and integration of findings difficult and consequently limiting their clinical relevance (17). Second, regarding model development, existing studies have predominantly focused on predicting the risk of early INR after treatment initiation. For instance, although the study by Zhang et al. (16) incorporated a broad set of variables to enhance predictive comprehensiveness, some indicators (e.g., specific infection history) are not routinely available in clinical practice, which may compromise the model’s utility. Furthermore, the prediction time window of this model is primarily confined to the initial treatment phase (e.g., 2 years after treatment). Key performance metrics, such as discrimination and calibration, have not been adequately validated in patients receiving long-term virologically suppressive therapy. Therefore, its applicability for guiding INR management in individuals on extended treatment (e.g., beyond 4 years) remains limited.
Although China issued the consensus on diagnosis and management of immunological non-responders in HIV infection (Version 2023) in recent years to standardize diagnostic criteria (4), prediction models based on this consensus remain scarce. To fill this research gap, this study strictly adheres to the above consensus standards to develop and validate a risk prediction model for INR.
Machine learning algorithms have shown significant promise in disease diagnosis and prognosis prediction (33). As an intuitive risk visualization tool, the nomogram can integrate multiple predictive variables into an evaluation model for the probability of clinical events based on the results of multivariable regression analysis. Therefore, to improve the accuracy and clinical utility of INR risk identification, this study combines machine learning-based variable selection with nomogram model construction, aiming to provide an effective tool for the early identification of high-risk INR individuals for targeted intervention.
Methods
2
Study population and design
2.1
This study is a retrospective cohort study. The study cohort and flowchart are presented in Figure 1. The primary study subjects were derived from PLWH who initiated ART and were followed up at Zhongnan Hospital of Wuhan University between January 2016 and May 2025, serving as the development cohort. A total of 1385 cases were initially screened. The inclusion criteria were as follows: 1) HIV infection diagnosis conforming to the Chinese guidelines for the diagnosis and treatment of HIV/AIDS (2024 edition) (2); 2) Receipt of standardized ART for over 4 years; 3) Sustained HIV viral load (VL) < 50 copies/mL for 3 consecutive years; 4) Age ≥ 18 years. The exclusion criteria included: 1) Loss to follow-up or death during the study period; 2) Presence of other immunosuppressive conditions (e.g., hematological malignancies, organ transplantation, long-term immunosuppressant use, severe renal insufficiency, or liver cirrhosis); 3) Missing key follow-up laboratory data (e.g., CD4^+^ T cell count); 4) Pregnancy or lactation. Based on the above criteria, 615 patients were ultimately included. For model development and internal validation, this cohort was randomly divided into a training set (n=433) and an internal validation set (n=182) in a 7:3 ratio.
Flow diagram of screening and enrollment of study participants.
Subsequently, to evaluate the generalizability of the model, an independent cohort from Xishui County People’s Hospital was included. This cohort consisted of PLWH who initiated ART and were followed up between January 2012 and August 2025, with 376 cases initially screened. After applying the same inclusion and exclusion criteria as those used for the development cohort, 213 patients constituted the external validation cohort.
In this study, INR was defined per the 2023 consensus (4). PLWH who received standardized ART for more than 4 years, had a viral load confirmed to be < 50 copies/mL by high-sensitivity assay for 3 consecutive years, and maintained a CD4^+^ T cell count below 350 cells/μL during annual follow-up were defined as INRs. Correspondingly, IRs were patients with a CD4^+^ T cell count ≥ 350 cells/μL under the identical treatment and virological suppression conditions, serving as the control group in this study. The study was reviewed and approved by the Medical Ethics Committee of Zhongnan Hospital of Wuhan University and Xishui County People’s Hospital.
Data collection of candidate variables
2.2
Two trained physicians extracted data from electronic medical records using standardized Excel forms. Demographic variables included gender and age at ART initiation. Disease-related characteristics encompassed route of infection, ART regimen, WHO clinical staging, duration of delay in ART initiation, and comorbid infections. Comorbid infections were defined as positivity for hepatitis B surface antigen (HBsAg) or hepatitis C virus antibody (anti-HCV) at the time of HIV diagnosis. Laboratory and physical examination parameters (with normal reference ranges in parentheses) included: CD4^+^ T lymphocyte count, HIV VL (lower limit of detection < 20 copies per milliliter [cps/mL]), WBC (4–10 × 10^9^/L), PLT (100–300 × 10^9^/L), Hb (120–160 g/L), SCr, triglycerides (TG; < 1.7 mmol/L), total cholesterol (TC; < 5.18 mmol/L), ALT (9–50 U/L), AST (15–40 U/L), and body mass index (BMI) (18.5–23.9 kg/m^2^). All laboratory assays were performed by trained technicians in the hospital’s clinical laboratory, in strict compliance with established clinical guidelines.
Statistical analysis
2.3
All data analyses in this study were performed using SPSS (version 27.0) and R software (version 4.3.3). First, the extent of missing data was assessed for all variables included in the analysis. The missing rates for baseline laboratory variables (including WBC, PLT, Hb, SCr, TG, TC, AST, and ALT) were all below 5%. To evaluate the missing data mechanism, we compared the distribution of key baseline characteristics between patients with missing data and those with complete data. The results indicated no significant systematic differences between the groups (all p > 0.05), supporting the assumption that the data were missing at random, as detailed in the Supplementary Material. Given the low proportion of missingness, multiple imputation was employed to handle the missing data.
Categorical variables are presented as frequencies (percentages), while continuous variables with non-normal distributions are described as medians (interquartile ranges, IQRs). Comparisons of categorical variables between groups were conducted using the Chi-square test or Fisher’s exact test, and comparisons of continuous variables were performed using the Mann-Whitney U test.
First, least absolute shrinkage and selection operator (LASSO) regression was employed to screen for potential predictors of INR in HIV/AIDS patients. The analysis was conducted using the “glmnet” package in R language. This method introduces L1 regularization to penalize the absolute values of regression coefficients, shrinking coefficients of weakly correlated variables to zero, thereby achieving variable selection and model simplification while effectively mitigating multicollinearity. The optimal tuning parameter λ (lambda) was determined through ten-fold cross-validation to balance model complexity and goodness-of-fit, and predictor variables with non-zero coefficients were selected. Subsequently, the variables identified by LASSO regression were incorporated into a multivariable logistic regression model to ultimately determine the independent influencing factors of INR. Based on the above factors, a prognostic nomogram was constructed using the “rms” package, transforming the complex regression model into a visual clinical tool to facilitate individualized risk assessment.
The model’s performance was evaluated in the training and validation sets. The “pROC” package was employed to plot receiver operating characteristic (ROC) curves and calculate the area under the curve (AUC), assessing the model’s discriminative ability. Calibration curves were plotted using the “rms” package to examine the agreement between predicted probabilities and actual probabilities. Decision curve analysis (DCA) was performed using the “rmda” package to evaluate the model’s clinical net benefit. A two-tailed P value < 0.05 was considered statistically significant for all statistical analyses.
Results
3
Baseline characteristics of the study population
3.1
To assess the randomness of the missing data, a pooled analysis was conducted on all cases with missing laboratory indicators across both cohorts. The results showed that, compared to patients with complete data, those missing at least one laboratory value demonstrated no statistically significant differences in key baseline characteristics, including age at ART initiation, baseline CD4^+^ T-cell count, BMI, sex, WHO stage, ART regimen, and route of infection (all P > 0.05). This indicates that the data were missing at random, with no substantial selection bias introduced. The missing data were handled using the multiple imputation method described previously, and all subsequent analyses were performed on the imputed complete datasets.
Based on the predefined inclusion and exclusion criteria, a total of 615 patients were ultimately enrolled in the entire development cohort. INRs accounted for 19.84% (122/615). ART for all patients was initiated before May 2021, with a median follow-up time of 5 years (IQR: 4–5 years). For predictive model construction, the development cohort was randomly divided into a training set (n=433) and an internal validation set (n=182) in a 7:3 ratio. The proportions of INRs in the training and validation sets were 19.40% (84/433) and 20.88% (38/182), respectively. The external validation cohort ultimately included 213 patients (all of whom initiated ART before August 2021), among whom INRs accounted for 19.72% (42/213), with a median follow-up time of 8 years (IQR: 6–10 years).
Overall, 828 patients were included in the study. Comparisons between the internal validation set and the training set revealed no statistically significant differences in the observed indicators (all p > 0.05). In contrast, comparisons between the external validation set and the training set showed statistically significant differences in indicators such as sex, route of infection, ART regimen, baseline CD4^+^ T cell count, WHO stage, number of abnormal cases of WBC, PLT, Hb, and SCr, ALT, AST, age at ART initiation, and delay in ART initiation (p < 0.05). The baseline clinical characteristics are detailed in Table 1.
In the training set, comparisons of baseline characteristics between groups showed that route of infection (p = 0.017), HBsAg positivity (p = 0.003), baseline CD4^+^ T cell count (p < 0.001), BMI (p = 0.023), WHO clinical stage (p < 0.001), WBC (p < 0.001), PLT (p < 0.001), Hb (p < 0.001), ALT (p = 0.006), AST (p < 0.001), age at ART initiation (p < 0.001), and baseline HIV VL (p < 0.001) were statistically significant between the two groups (all p < 0.05). (Table 2).
Screening and identification of predictive factors
3.2
In the training set, we employed LASSO regression for initial variable screening, incorporating a total of 19 potential predictor variables. The optimal regularization parameter was determined via ten-fold cross-validation, and λ.1se (λ = 0.040) was selected to obtain a more parsimonious model, resulting in the identification of 7 variables: age at ART initiation, baseline CD4^+^ T cell count, BMI, WBC, Hb, AST, and WHO clinical stage (Figures 2A, B). Subsequently, all these variables were incorporated into a multivariable logistic regression model for further screening and confirmation.
Clinical feature selection using LASSO regression. (A) (Left panel) LASSO coefficient path plot; (B) (Right panel) Ten-fold cross-validation curve plot.
The final results indicated that baseline CD4^+^ T cell count (p < 0.001) was identified as a protective factor against INR in PLWH. Conversely, older age at ART initiation (p = 0.001) and elevated AST levels (> 40 U/L, p = 0.014) were determined to be independent risk factors for INR in this population. Only variables with independent predictive significance (p < 0.05) were retained to construct the Nomogram. (Table 3).
Construction and validation of the nomogram prediction model
3.3
Based on the results of LASSO regression and multivariable logistic regression analyses, a nomogram prediction model incorporating age at ART initiation, baseline CD4^+^ T cell count, and AST level was constructed (Figure 3). Taking baseline CD4^+^ T cell count as an example: locate the corresponding point on the “Baseline CD4” axis, draw a vertical line upward to the “Points” axis to obtain the corresponding score; repeat this process for other variables to get their respective scores. Sum these scores, find the total on the “Total Points” axis, and draw a vertical line downward to the “Risk” axis to obtain the individual risk estimate. A higher total score indicates a higher risk of developing INR.
Nomogram for predicting INR in PLWH after ART initiation.
Evaluation of the nomogram model
3.4
In the training set, we constructed a ROC curve, a calibration curve, and a DCA to evaluate the model. Results showed that the area under the ROC curve (AUC) of the model in the training set was 0.896 (95% confidence interval [CI]: 0.863–0.929; Figure 4A), with a sensitivity of 90.48% and a specificity of 79.37%. After internal bootstrap validation (1000 repetitions), the mean absolute error of the calibration curve was 0.010, indicating good stability of the model (Figure 4B). DCA demonstrated that the model yielded a favorable clinical net benefit across the threshold probability range of 0.1 to 0.8 (Figure 4C).
Evaluation of model performance in the training set. (A) ROC curve. (B) Calibration curve. (C) DCA.
In the internal validation set, the model exhibited excellent discriminative ability, with an AUC of 0.903 (95% CI: 0.856–0.950; Figure 5A), a sensitivity of 89.47%, and a specificity of 78.47%. In the external validation set, the model yielded an AUC of 0.766 (95% CI: 0.695–0.837; Figure 5D), with a sensitivity of 80.95% and a specificity of 63.74%. Calibration curves demonstrated low mean absolute errors of 0.008 and 0.010 for the two validation sets, respectively (Figures 5B, E). DCA further confirmed that the predictive nomogram model provides substantial clinical net benefit (Figures 5C, F).
Evaluation of the nomogram prediction performance in validation sets. (A) ROC curve of the internal validation set. (B) Calibration curve of the internal validation set. (C) DCA of the internal validation set. (D) ROC curve of the external validation set. (E) Calibration curve of the external validation set. (F) DCA of the external validation set.
Discussion
4
The significantly elevated risk of adverse events in INRs creates an urgent clinical need for early identification of high-risk individuals. To address the long-standing core issue of inconsistent diagnostic criteria in this research area, this study strictly defined outcome events according to the latest Chinese expert consensus, aiming to provide more reliable evidence for this field.
This study identified age at ART initiation, pre-treatment CD4^+^ T cell count, and AST level as independent predictors of INR and constructed a predictive model based on these three factors, which is consistent with numerous previous reports (17, 21, 34). Existing studies have shown a positive correlation between age at ART initiation and INR risk (8, 35), while a lower pre-treatment CD4^+^ T cell count is a strong predictor, demonstrating a significant negative correlation with INR occurrence (36, 37). Further research by Li et al. revealed that the CD4^+^ T cell count in individuals over 50 years old was significantly lower than in those under 35. Although ART helped restore CD4^+^ T cell counts to some extent across all age groups, younger patients exhibited significantly superior immune reconstitution rates and degrees of recovery compared to older patients. Moreover, the inhibitory effect of age on CD4^+^ T cell recovery became increasingly pronounced with longer treatment duration (38). Mechanistically, the thymus, as the primary site for generating immunocompetent T cells, undergoes progressive functional decline with age, leading to restricted nascent T cell output and consequently impairing CD4^+^ T cell recovery (39). Additionally, elderly patients have shortened T cell telomere lengths, weakened proliferation ability, and are prone to immunosenescence (40). This mechanistic understanding supports the negative impact of advanced age on INR observed in our study. Research indicates that advanced age and low CD4^+^ T cell count are major risk factors for significant clinical events such as cardiovascular events and non-AIDS-defining malignancies (5). Another study reported that the median age of the high-risk group for atherosclerotic cardiovascular disease among PLWH was 66 years, significantly higher than the 52 years in the low-risk group (41), underscoring the critical role of age in non-AIDS-related complications. Furthermore, a study observing immune recovery after one year of ART noted that patients with a baseline CD4^+^ T cell count <50/μL struggled to achieve a CD4^+^ T cell count above 200/μL despite standardized ART (42). Another study also emphasized that the baseline CD4^+^ T cell count is a sensitive indicator for predicting immune reconstitution outcomes (43).
AST serves as a crucial biomarker for liver function assessment. Relevant studies indicate that AST levels are closely and positively correlated with viral suppression and immune recovery in PLWH (16). As a sensitive indicator of hepatocellular damage, elevated AST levels reflect hepatic inflammation or necrosis. Impaired liver function subsequently reduces the capacity to clear toxins and inflammatory factors, leading to a systemic chronic low-grade inflammatory state and persistent immune activation. This pathological environment can accelerate functional exhaustion of CD4^+^ T cells, thereby impeding the immune reconstitution process (44). In our study, patients with AST levels >40 U/L exhibited a 2.60-fold higher risk of developing INR compared to those with AST ≤40 U/L, further supporting the value of incorporating AST levels as a predictive indicator for INR occurrence.
This study addresses the clinically relevant issue of CD4^+^ T cell recovery plateau following long-term viral suppression within the context of China’s predominant ART regimens, which primarily consist of two NRTIs combined with either one NNRTI, one PI, or one INSTI (45). This focus underscores the study’s significant practical relevance and research necessity. By tracking annual CD4^+^ T cell count changes from treatment initiation until the follow-up cutoff, and applying the INR diagnostic criteria recommended by the world’s first expert consensus on INR, we conducted a retrospective analysis of pre-ART clinical data from 615 PLWH at a single tertiary hospital in a major central Chinese city. We identified age, CD4^+^ T cell count, and AST level as baseline risk factors for INR and pioneered the development of a predictive nomogram model based on these three parameters. External validation was performed using a follow-up cohort from a primary hospital.
The model demonstrated exceptional discrimination in both the training set (AUC = 0.896) and internal validation set (AUC = 0.903), indicating excellent predictive performance. Notably, in the independent external validation set, the model achieved an AUC of 0.766, exceeding the empirical threshold of 0.75, which suggests reasonable generalizability. Furthermore, calibration curves and decision curve analysis confirmed the model’s satisfactory calibration and clinical applicability. This study facilitates early risk stratification and tailored follow-up management for PLWH at high risk of INR, ultimately aiming to improve patient prognosis and quality of life.
Furthermore, compared to the relatively lenient criteria used in earlier studies (46), the updated standards provide a more precise definition of INR. Previous criteria often suffered from limitations such as short observation periods and inconsistent thresholds. In contrast, the new standards not only require a sustained CD4^+^ T-cell count below a specific threshold but also emphasize evaluation under the condition of prolonged viral suppression (e.g., >3 years). This approach more accurately identifies the true “inadequate immune reconstitution” population and reduces misclassification due to incomplete viral suppression or other confounding factors. Consequently, the predictors identified in this context—such as baseline CD4^+^ T-cell count, AST level, and age—carry greater biological relevance and robustness.
In terms of clinical interpretation, models based on the updated criteria place greater emphasis on identifying high-risk individuals. Older criteria may have included many patients with relatively low long-term risk, whereas the predicted probabilities from our model better reflect a patient’s actual risk of long-term adverse outcomes, thereby offering a more reliable basis for clinical decision-making.
More importantly, the evolution of diagnostic consensus reflects a deepened understanding of disease prognosis management. Previously, inconsistent diagnostic criteria often led to unclear indications and necessity for clinical intervention. The predictive model constructed according to the new standards enables risk stratification and facilitates the early identification of patients who, despite successful virological control, remain in an immunodeficient state and thus require closer monitoring or consideration of adjunctive immune interventions. For example, in patients classified as high-risk by the model, clinicians may consider shortening follow-up intervals, enhancing screening for opportunistic infections, or more actively exploring opportunities for participation in immunotherapy clinical trials.
Several limitations warrant consideration. First, a degradation in model performance was observed in the external validation cohort, as indicated by a decrease in the AUC values. The observed decline in performance in the external validation set may stem from significant demographic and clinical differences between the tertiary and primary hospital cohorts. Specifically, notable disparities were identified: the male-to-female ratio was approximately 3:1 in the external cohort compared to about 19:1 in the training cohort. Furthermore, heterosexual transmission was predominant in the external cohort, whereas homosexual transmission was more common in the training cohort. Patients in the external cohort also had a higher overall age at ART initiation. In addition, marked differences existed in baseline laboratory indicators (e.g., WBC, PLT, Hb) between the two cohorts.
These discrepancies may affect the model’s generalizability through several mechanisms. Firstly, baseline immune status and laboratory profiles likely exhibit population-specific variations across different genders, transmission routes, and age groups. Consequently, a model developed on the training cohort may naturally show reduced predictive accuracy when applied to an external population with a different feature distribution. Secondly, these phenotypic characteristics could act as proxies for deeper, unmeasured biological factors—such as viral subtypes, specific inflammatory biomarkers, or host genetic variations—that may influence INR, potentially explaining part of the performance gap (29, 47). Thirdly, since our analysis confirmed that age at ART initiation is an independent predictor of incomplete immune reconstitution, the difference in age distribution between cohorts could directly impact the model’s calibration and discriminative ability. Finally, the retrospective design is susceptible to selection and attrition bias.
Future studies should aim to enhance the model’s robustness by expanding the sample size through the inclusion of patient cohorts from more diverse geographic regions and ethnic backgrounds. The consideration of more advanced machine learning algorithms may also be warranted to better adapt the tool to various clinical scenarios.
In summary, we have constructed a practical nomogram that effectively predicts the risk of incomplete immune reconstitution in virologically suppressed PLWH. By integrating age at ART initiation, baseline CD4^+^ T cell count, and AST level, this tool allows for early risk stratification. It can assist clinicians in identifying high-risk INR individuals who may benefit from more intensive monitoring, investigation of comorbidities, and personalized management strategies, ultimately aiming to improve long-term clinical outcomes.
The reference list from the paper itself. Each links out to its DOI / PubMed record.
- 1National Center for AIDS/STD Control and Prevention, China Center for Disease Control and Prevention . National AIDS and STD epidemic situation in December 2024. Chin J AIDS STD. (2025) 31:225. doi: 10.13419/j.cnki.aids.2025.03.01 · doi ↗
- 2Acquired Immunodeficiency Syndrome Professional Group, Society of Infectious Diseases, Chinese Medical Association . Chinese Center for Disease Control and Prevention. Chinese guidelines for the diagnosis and treatment of human immunodeficiency virus infection/acquired immunodeficiency syndrome (2024 edition). Chin Med J. (2024) 137:2654–80. doi: 10.1097/CM 9.0000000000003383, PMID: 39602327 PMC 11611241 · doi ↗ · pubmed ↗
- 3Gan X Zhao D Zhao Y Ma Y Wu Y Dou Z . Progress on national antiretroviral treatment program during 2003–2021 in China. Chin J AIDS STD. (2022) 28:642–6. doi: 10.13419/j.cnki.aids.2022.06.04 · doi ↗
- 4Li T Cao W Shen Y . Consensus on diagnosis and management of immunological non-responders in HIV infection(Version 2023). Infect Dis Inf. (2023) 36:481–91. doi: 10.3969/j.issn.1007-8134.2023.06.001, PMID: 35900448 · doi ↗
- 5Martínez-Sanz J Díaz-Álvarez J Rosas M Ron R Iribarren JA Bernal E . Expanding HIV clinical monitoring: the role of CD 4, CD 8, and CD 4/CD 8 ratio in predicting non-AIDS events. e Bio Medicine. (2023) 95:104773. doi: 10.1016/j.ebiom.2023.104773, PMID: 37639938 PMC 10474064 · doi ↗ · pubmed ↗
- 6Liu J Ding C Shi Y Wang Y Zhang X Huang L . Advances in mechanism of HIV-1 immune reconstitution failure: understanding lymphocyte subpopulations and interventions for immunological nonresponders. J Immunol. (2024) 212:1609–20. doi: 10.4049/jimmunol.2300777, PMID: 38768409 · doi ↗ · pubmed ↗
- 7Zhu K Xu Q Ma Y Li P Jia H Jiang Q . Suboptimal immune recovery and associated factors among people living with HIV/AIDS on second-line antiretroviral therapy in central China: A retrospective cohort study. J Med Virol. (2022) 94:4975–82. doi: 10.1002/jmv.27944, PMID: 35710693 · doi ↗ · pubmed ↗
- 8Chen J Titanji K Sheth AN Gandhi R Mc Mahon D Ofotokun I . The effect of age on CD 4+ T-cell recovery in HIV-suppressed adult participants: a sub-study from AIDS Clinical Trial Group (ACTG) A 5321 and the Bone Loss and Immune Reconstitution (BLIR) study. Immun Ageing. (2022) 19:4. doi: 10.1186/s 12979-021-00260-x, PMID: 34980186 PMC 8722153 · doi ↗ · pubmed ↗