Network connectome analysis of multi omics data identifies molecular markers of recurrence and grade progression in meningioma
Jeong-An Gim, Hyun Jun Jo, Woo Keun Kwon, Chang Hwa Ham, Hae Won Roh, Wonki Yoon, Jong Hyun Kim, Taek Hyun Kwon, Joonho Byun

TL;DR
This study uses multi-omics data to identify molecular markers that predict meningioma recurrence and grade progression, improving risk assessment beyond traditional methods.
Contribution
A novel network connectome framework integrating DNA methylation, RNA-seq, and proteomic data to identify molecular patterns linked to meningioma aggressiveness.
Findings
Distinct network clusters differentiate recurrent and higher-grade meningiomas from indolent ones.
29 methylation, 32 gene, and 33 protein features were significantly related to recurrence.
LINC01397 emerged as a potential unified biomarker across omic layers.
Abstract
Meningiomas are usually benign, but some behave aggressively with early recurrence. Histopathological grading alone often fails to predict outcomes. We developed a network connectome and clustering framework that integrates DNA methylation, RNA-seq, and proteomic data to identify molecular interaction patterns linked to recurrence and grade progression. Using genome-wide methylation, transcriptomic, and proteomic profiles, we constructed multi-layer connectome networks representing inter-omic correlations. Nodes and edges were analyzed by centrality and clustering metrics to detect key molecular modules associated with clinical outcomes. Distinct network clusters differentiated recurrent and higher-grade meningiomas from indolent ones. A total of 29 methylation, 32 gene, and 33 protein features were significantly related to recurrence; 70, 61, and 56 features were linked to grade…
Genes, proteins, chemicals, diseases, species, mutations and cell lines named across the full text — each resolved to its canonical identifier and authoritative record.
Click any figure to enlarge with its caption.
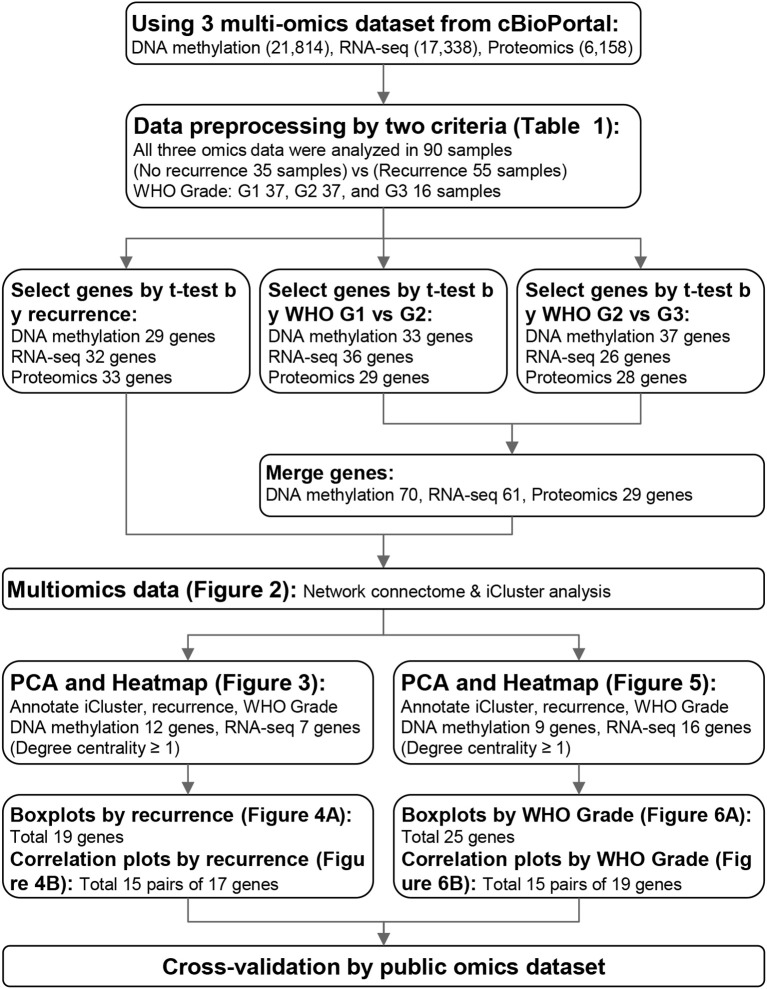 Figure 1
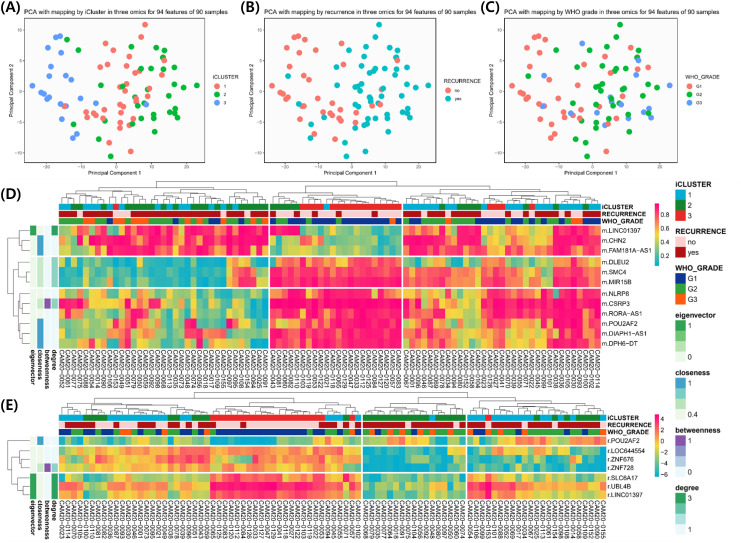 Figure 2
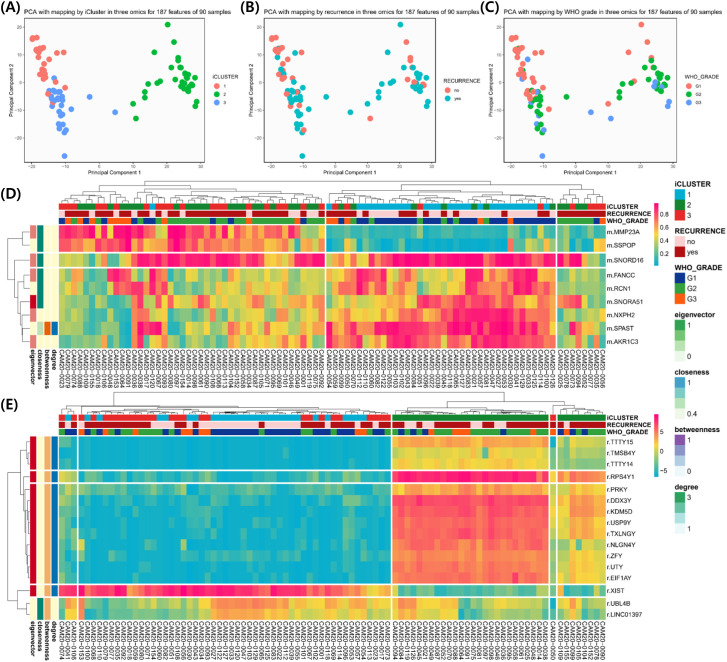 Figure 3
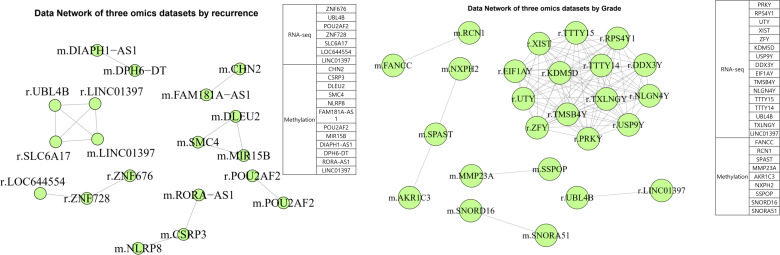 Figure 4
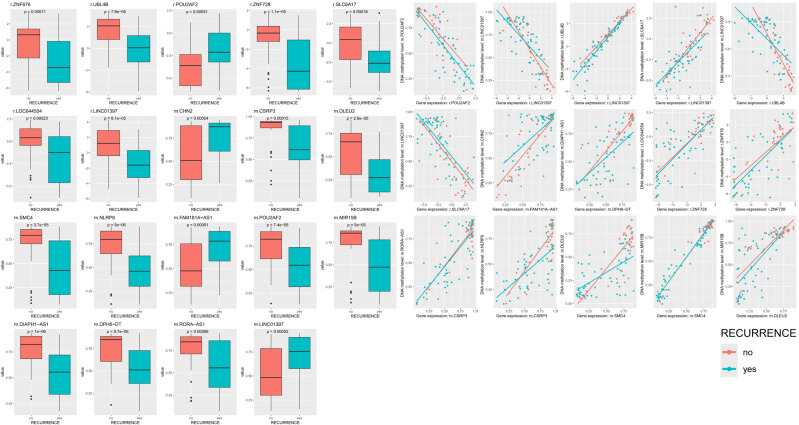 Figure 5
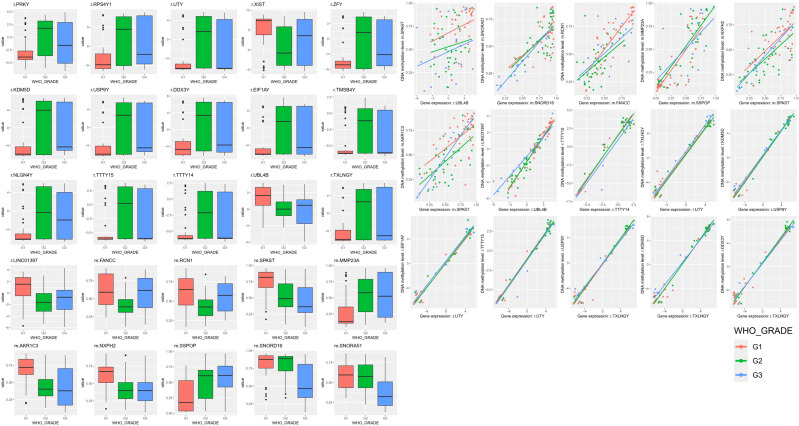 Figure 6
| Criteria | Recurrence | G1 vs G2 | G2 vs G3 | |||
|---|---|---|---|---|---|---|
| No | Yes | G1 | G2 | G2 | G3 | |
| Sample no. | 35 | 55 | 37 | 37 | 37 | 16 |
| Threshold |
|
|
|
|
|
|
| Methylation | 0.001 | 0.18 | 0.001 | 0.2 | 0.005 | 0.18 |
| RNA-seq | 0.001 | 1.7 | 0.001 | 1.8 | 0.01 | 1.6 |
| Proteomics | 0.001 | 1 | 0.001 | 1 | 0.01 | 1 |
| Class | Term | P-value | Combined score | Genes |
|---|---|---|---|---|
| Recurrence | striated muscle hypertrophy (GO:0014897) | 0.00509 | 1318.68 | CSRP3 |
| Recurrence | cardiac muscle hypertrophy (GO:0003300) | 0.006781 | 890.6522 | CSRP3 |
| Recurrence | alanine transport (GO:0032328) | 0.007625 | 760.9634 | SLC6A17 |
| Recurrence | proline transport (GO:0015824) | 0.007625 | 760.9634 | SLC6A17 |
| Recurrence | glycine transport (GO:0015816) | 0.007625 | 760.9634 | SLC6A17 |
| Recurrence | response to muscle stretch (GO:0035994) | 0.007625 | 760.9634 | CSRP3 |
| Recurrence | modification-dependent macromolecule catabolic process (GO:0043632) | 0.010155 | 520.8353 | UBL4B |
| Recurrence | mitotic chromosome condensation (GO:0007076) | 0.012679 | 389.3804 | SMC4 |
| Grade | histone H3-K4 demethylation (GO:0034720) | 0.008718 | 657.6336 | KDM5D |
| Grade | daunorubicin metabolic process (GO:0044597) | 0.009958 | 547.8577 | AKR1C3 |
| Grade | doxorubicin metabolic process (GO:0044598) | 0.009958 | 547.8577 | AKR1C3 |
| Grade | aminoglycoside antibiotic metabolic process (GO:0030647) | 0.009958 | 547.8577 | AKR1C3 |
| Grade | ketone biosynthetic process (GO:0042181) | 0.009958 | 547.8577 | AKR1C3 |
| Grade | protein hexamerization (GO:0034214) | 0.011196 | 467.165 | SPAST |
| Grade | postsynaptic membrane assembly (GO:0097104) | 0.011196 | 467.165 | NLGN4Y |
| Grade | axonal transport of mitochondrion (GO:0019896) | 0.011196 | 467.165 | SPAST |
| Grade | sequestering of actin monomers (GO:0042989) | 0.012433 | 405.5533 | TMSB4Y |
| Grade | quinone metabolic process (GO:1901661) | 0.012433 | 405.5533 | AKR1C3 |
| Grade | regulation of actin filament length (GO:0030832) | 0.012433 | 405.5533 | TMSB4Y |
| Grade | presynaptic membrane assembly (GO:0097105) | 0.012433 | 405.5533 | NLGN4Y |
| Grade | primary alcohol catabolic process (GO:0034310) | 0.012433 | 405.5533 | AKR1C3 |
| Grade | presynaptic membrane organization (GO:0097090) | 0.013668 | 357.1009 | NLGN4Y |
| Grade | positive regulation of endothelial cell apoptotic process (GO:2000353) | 0.013668 | 357.1009 | AKR1C3 |
| Grade | cyclooxygenase pathway (GO:0019371) | 0.013668 | 357.1009 | AKR1C3 |
| Grade | response to corticosteroid (GO:0031960) | 0.013668 | 357.1009 | AKR1C3 |
| Grade | cellular response to prostaglandin stimulus (GO:0071379) | 0.013668 | 357.1009 | AKR1C3 |
| Grade | postsynapse assembly (GO:0099068) | 0.013668 | 357.1009 | NLGN4Y |
| Grade | progesterone metabolic process (GO:0042448) | 0.013668 | 357.1009 | AKR1C3 |
| Grade | retinal metabolic process (GO:0042574) | 0.013668 | 357.1009 | AKR1C3 |
Peer Reviews
No public reviews on file for this paper yet. If you reviewed it on a platform where reviews are public (OpenReview, ICLR, NeurIPS, ICML), you can paste yours below so the community can read it here.
Videos
No videos yet. Explain this paper in a talk, walkthrough, or lecture? Add one.
Taxonomy
TopicsMeningioma and schwannoma management · Neurofibromatosis and Schwannoma Cases · Chromatin Remodeling and Cancer
Introduction
Meningiomas are the most common brain tumors in adults (1). Although many behave indolently, approximately 20% show aggressive features such as rapid growth, brain invasion, and a high likelihood of recurrence. Most of these clinically challenging cases fall within WHO grade 2 or 3, which remain difficult to predict accurately using histology alone (2).
Recent efforts have focused on identifying molecular alterations that improve prognostication. The 2021 WHO classification incorporated genetic features such as CDKN2A/B homozygous deletion and TERT promoter mutation, reflecting the growing recognition that molecular markers can refine grading and clinical decision making (3, 4). Advances in DNA methylation profiling have further improved risk stratification, supporting the development of integrated molecular–morphological classifications for more personalized management (5–9).
However, identifying disease-associated genes through large cohorts or laboratory experiments remains costly and time-consuming. Computational approaches therefore play an important role in prioritizing candidate genes. In this study, we applied a network connectome approach—originally developed to characterize connectivity patterns in neuroscience—to explore molecular interactions across DNA methylation, RNA expression, and protein expression using publicly available datasets from cBioPortal (10).
Previous studies of meningioma recurrence have mainly used dimensionality reduction and clustering to define molecular subgroups (5, 11). While informative, such methods do not capture system-level interactions. To address this limitation, we used network connectome analysis to integrate multi omics features and identify molecular modules associated with recurrence and WHO grade progression. Matched methylation, transcriptomic, and proteomic data from the same patients enabled a comprehensive assessment of differentially altered regions, genes, and proteins within a unified analytic framework.
Materials and method
Data acquisition
This study was approved by the Institutional Review Board of Soonchunhyang University (Approval Number: 202405-SB-049) and conducted in accordance with the Declaration of Helsinki. DNA methylation, RNA-seq, proteomic, and clinical datasets of intracranial meningiomas were obtained from cBioPortal. All analyses were performed in R version 4.4.1. The overall workflow is summarized in Figure 1.
Process of this study.
Identification of DMRs, DEGs, and DEPs
Normalized DNA methylation (21,814 CpG sites), RNA-seq (17,338 genes), and proteomic (6,158 proteins) data were analyzed. Ninety patients with matched multi-omics profiles were included. Patients were grouped by recurrence status and WHO grade (Grade 1 = 37, Grade 2 = 37, Grade 3 = 16). Differentially methylated regions (DMRs), differentially expressed genes (DEGs), and differentially expressed proteins (DEPs) were identified using two-group t-tests, and significant features were visualized with volcano plots and heatmaps. Selection thresholds for each omics layer are summarized in Table 1.
Network connectome and clustering analysis
The identified DMRs, DEGs, and DEPs were integrated into a unified multi-omics matrix. Principal component analysis (PCA) and multi-omics clustering were performed to explore overall data structure. For connectome construction, Pearson correlation matrices were constructed, and features with correlation coefficients ≥ 0.7 (p = 1.63 × 10^−14^) for recurrence analysis or ≥ 0.75 (p = 1.79 × 10^−17^) for WHO grade analysis were retained for connectome generation. Node importance was evaluated by degree, betweenness, closeness, and eigenvector centralities, and connectome maps were visualized to highlight molecular interaction hubs. Gene Ontology enrichment was performed to explore biological processes related to significant modules.
Cross-validation with public datasets
Independent public datasets were retrieved from the NCBI GEO database using the keyword “meningioma.” Datasets containing methylation, transcriptomic, or proteomic profiles were processed using the same analytic pipeline to validate DMRs, DEGs, and DEPs associated with recurrence and grade. Overlapping genes between discovery and validation sets are listed in Supplementary Table 1.
Results
Feature selection from DMRs, DEGs, and DEPs
From the multi-omics datasets, 21,814 CpG sites, 17,338 genes, and 6,158 proteins were analyzed. Based on the selection criteria summarized in Table 1, 29 DMRs, 32 DEGs, and 33 DEPs were identified as significantly associated with recurrence (p < 0.001). These features were visualized using volcano plots and heatmaps (Supplementary Figure 1).
For WHO grade progression, differential analyses between Grades 1–2 and 2–3 revealed 70 DMRs, 61 DEGs, and 56 DEPs meeting the same statistical thresholds (Table 1; Supplementary Figure 2). Distinct hypo- and hypermethylation as well as expression patterns were observed across grades, reflecting progressive molecular changes related to tumor aggressiveness.
Network connectome analysis
To characterize molecular interactions underlying these features, we integrated DMRs, DEGs, and DEPs into multi-layer networks. The recurrence network consisted of 94 features (29 DMRs, 32 DEGs, 33 DEPs), and the grade network included 187 features (70 DMRs, 61 DEGs, 56 DEPs). Pearson correlation matrices were constructed, and features with correlation coefficients ≥ 0.7 (recurrence) or ≥ 0.75 (grade) were retained for connectome generation. Graph-based analysis revealed seven distinct molecular clusters for recurrence and six for WHO grade (Figure 2). Centrality mapping identified key network hubs, with LINC01397 emerging as a recurrent central node across omics layers. Gene ontology enrichment indicated involvement of extracellular matrix organization, cell adhesion, and signal transduction pathways (Table 2).
(A–C) Principal component analysis (PCA) plots showing sample distribution according to iCluster, recurrence status, and WHO grade. (D, E) Heatmaps displaying hierarchical clustering of molecular features across samples with associated annotations.
Clustering and multi-omics integration
PCA and iCluster analyses were performed using integrated methylation, transcriptomic, and proteomic data from 90 patients. Three molecular clusters were identified (Figure 3A). Recurrence status showed clear separation along the first principal component (PC1; Figure 3B), while WHO grade separation was less distinct (Figure 3C). Cluster 3 predominantly represented nonrecurrent tumors and was characterized by hypomethylation of LINC01397, CHN2, and FAM181A-AS1 with corresponding upregulation of LINC01397 and UBL4B (Figures 3D, E). Boxplots demonstrated hypermethylation and reduced expression of LINC01397 in recurrent tumors (Figure 4). In contrast, cluster 2 was enriched for recurrent and Grade 2 tumors, showing hypomethylation of MMP23A and SSPOP. Progressive methylation and expression shifts of SPAST, NXPH2, SNORD16, and SNORA51 were associated with increasing WHO grade (Figures 5, 6).
Principal component analysis (PCA) results for 90 samples and heatmap for 19 features used in network connectome analysis. As a result of PCA, annotation according to iCluster (A), recurrence (B), and WHO Grade (C) for each 90 plots. A total of 19 features were used in the network connectome analysis according to recurrence, and two heatmaps were presented for each of 12 CpG sites (D) and seven genes (E).
Among 90 patient samples, statistical significance is presented for 37, 37 and 16 Grade 1, 2 and 3 patients, and all satisfied p-value < 0.05. In the network connectome, 15 correlation plots between two features with the same gene symbol and genes belonging to both DEG and DMR and nodes connected to each other was presented. Red points and lines mean no recurrence, and jade points and lines mean recurrence group.
Boxplot according to recurrence for 25 features analyzed in the network connectome. Among 90 patient samples, statistical significance is presented for 37, 37 and 16 Grade 1, 2 and 3 patients, and all satisfied p-value < 0.05. In the network connectome, 15 correlation plots between two features with the same gene symbol and genes belonging to both DEG and DMR and nodes connected to each other was presented. Red points and lines mean no recurrence, and jade points and lines mean recurrence group.
Among 90 patient samples, statistical significance is presented for 37, 37 and 16 Grade 1, 2 and 3 patients, and all satisfied p-value < 0.05. In the network connectome, 15 correlation plots between two features with the same gene symbol and genes belonging to both DEG and DMR and nodes connected to each other was presented. Red points and lines mean no recurrence, and jade points and lines mean recurrence group.
Cross-validation with public omics datasets
Thirteen public omics datasets were analyzed for validation, including five DNA methylation, seven transcriptomic, and one proteomic dataset. DMRs, DEGs, and DEPs associated with recurrence and grade were reanalyzed using the same thresholds, and overlapping genes with our discovery set were summarized (Supplementary Table 1). Consistent differential patterns were observed for several key genes, including CHN2 (methylation), SYNPO2, GSTM5, TCEAL2, MRAP2, SOX11 (gene expression), and KCNMA1, ALPL, SYNPO2, LEPR, GSTM5 (protein expression). Boxplots demonstrated concordant expression or methylation trends across datasets (Supplementary Figure 5), supporting the reproducibility of our findings.
Discussion
Genomic and epigenomic studies have repeatedly shown that meningiomas with the same WHO grade can still behave very differently in the clinic. Well known markers such as SMARCE1, BAP1, KLF4/TRAF7, TERTpromoter mutations, and loss of CDKN2A/B with reduced H3K27me3 expression illustrate how molecular alterations can refine prognostic assessment beyond traditional histology (3, 4, 12). With this in mind, our study set out to explore whether publicly available multi omics data could be reexamined through a different analytical lens, using a network connectome approach to identify signals related to recurrence and grade progression.
The intention was not simply to list differentially expressed or methylated genes, but to understand how these alterations might relate to one another across methylation, transcription, and protein expression. Although connectome analysis has traditionally been used in neuroscience to map connectivity between brain regions, we adapted the concept to examine correlations among molecular features at the genomic and proteomic level. By doing so, we were able to highlight clusters of coordinated changes that would have been difficult to appreciate with single omics analyses alone.
Among the features uncovered, LINC01397, CHN2, and FAM181A-AS1 consistently appeared in central positions within the connectome. LINC01397 showed clear hypermethylation together with reduced expression in recurrent tumors, a pattern that raises the possibility of a tumor suppressive function. CHN2 and FAM181A-AS1 demonstrated similarly structured epigenetic and transcriptional changes, and although these genes have been discussed in other diseases, their relevance to meningioma has not been described before (13–16).
Additional genes such as KCNMA1 and LEPR, which have known links to more aggressive tumor biology, showed concordant trends in external datasets, adding confidence to their relevance (17, 18).
Taken together, these findings suggest that the molecular changes associated with recurrence and grade advancement are not isolated events. Instead, they may represent interconnected shifts involving chromatin regulation, signaling pathways, and cytoskeletal organization, echoing mechanisms proposed in earlier studies. In this sense, the connectome provides a starting point for future mechanistic research that examines not only individual genes but also the relationships among them.
Implications for future research and clinical practice
The patterns observed here point to several directions for future work. First, larger and independently collected multi omics cohorts will be needed to confirm whether the signatures identified in this study are robust and reproducible. Genes such as LINC01397, CHN2, and FAM181A-AS1 are particularly strong candidates for further investigation, given their consistent associations with recurrence and grade.
From a clinical perspective, the integration of genomic and epigenomic profiling into routine assessment may eventually help refine diagnosis and guide individualized management. Methylation based markers are especially appealing because of their biological stability and the practicality of incorporating them into clinical workflows. Nevertheless, translating these findings into clinical practice will require validation in more diverse populations and prospective studies that assess their predictive value in real time.
Overall, the present study demonstrates that examining multi omics data through a network connectome framework can reveal patterns that remain hidden when each dataset is analyzed independently. This approach offers a broader view of tumor biology and may ultimately contribute to more precise risk stratification and improved outcomes for patients with meningioma.
This study has several limitations. Survival analysis and formal predictive performance metrics were not performed, reflecting the exploratory design and reliance on publicly available multi-omics datasets with limited longitudinal clinical information. In addition, recurrence and WHO grade were used as surrogate clinical endpoints, which may not fully capture patient outcomes. Validation in larger, well-annotated cohorts and prospective studies will be necessary to confirm the biological and clinical relevance of the identified molecular features.
Conclusion
This study shows that meningioma recurrence and grade progression arise from coordinated molecular shifts across methylation, transcription, and protein expression. Using a network connectome approach, we identified integrative molecular patterns and several promising biomarker candidates. These findings point toward the value of multi omics analyses in refining prognosis and may support future efforts to develop more precise, personalized strategies for managing meningioma.
The reference list from the paper itself. Each links out to its DOI / PubMed record.
- 1Wiemels J Wrensch M Claus EB . Epidemiology and etiology of meningioma. J Neurooncol. (2010) 99:307–14. doi: 10.1007/s 11060-010-0386-3, PMID: 20821343 PMC 2945461 · doi ↗ · pubmed ↗
- 2James Z Makwana M Hayhurst C . De novo skull base atypical meningioma: incidence and outcome. J Neurol Surg B Skull Base. (2023) 84:113–8. doi: 10.1055/a-1757-3212, PMID: 36895814 PMC 9991523 · doi ↗ · pubmed ↗
- 3Franca RA Della Monica R Corvino S Chiariotti L Del Basso De Caro M . WHO grade and pathological markers of meningiomas: Clinical and prognostic role. Pathol Res Pract. (2023) 243:154340. doi: 10.1016/j.prp.2023.154340, PMID: 36738518 · doi ↗ · pubmed ↗
- 4Louis DN Perry A Wesseling P Brat DJ Cree IA Figarella-Branger D . The 2021 WHO classification of tumors of the central nervous system: a summary. Neuro Oncol. (2021) 23:1231–51. doi: 10.1093/neuonc/noab 106, PMID: 34185076 PMC 8328013 · doi ↗ · pubmed ↗
- 5Bayley JCT Hadley CC Harmanci AO Harmanci AS Klisch TJ Patel AJ . Multiple approaches converge on three biological subtypes of meningioma and extract new insights from published studies. Sci Adv. (2022) 8:eabm 6247. doi: 10.1126/sciadv.abm 6247, PMID: 35108039 PMC 11313601 · doi ↗ · pubmed ↗
- 6Berghoff AS Hielscher T Ricken G Furtner J Schrimpf D Widhalm G . Prognostic impact of genetic alterations and methylation classes in meningioma. Brain Pathol. (2022) 32:e 12970. doi: 10.1111/bpa.12970, PMID: 35213082 PMC 8877750 · doi ↗ · pubmed ↗
- 7Chen WC Choudhury A Youngblood MW Polley MC Lucas CG Mirchia K . Targeted gene expression profiling predicts meningioma outcomes and radiotherapy responses. Nat Med. (2023) 29:3067–76. doi: 10.1038/s 41591-023-02586-z, PMID: 37944590 PMC 11073469 · doi ↗ · pubmed ↗
- 8Choudhury A Magill ST Eaton CD Prager BC Chen WC Cady MA . Meningioma DNA methylation groups identify biological drivers and therapeutic vulnerabilities. Nat Genet. (2022) 54:649–59. doi: 10.1038/s 41588-022-01061-8, PMID: 35534562 PMC 9374001 · doi ↗ · pubmed ↗