Vascular Reconstruction in Extremity Soft Tissue Sarcomas: A Systematic Review and Single‐Arm Meta‐Analysis
Lucas Monteiro Delgado, Bernardo Fontel Pompeu, Vinícius dos Santos Macedo, Gabriel Henrique Acedo Martins, Eric Pasqualotto, Matheus Reginato Araujo, Julia Hoici Brunini, Victor Andrade Nunes, Cláudia Theis, Samuel Aguiar Junior

TL;DR
This study reviews outcomes of limb-sparing surgery with vascular reconstruction for soft tissue sarcomas in limbs, finding high limb salvage rates but significant complications.
Contribution
A systematic review and meta-analysis of vascular reconstruction outcomes in extremity soft tissue sarcomas.
Findings
Limb salvage rate was 89% with a 10% amputation rate.
One- and five-year survival rates were 89% and 62%, respectively.
Major complications included graft thrombosis, wound complications, and infections.
Abstract
The management of extremity soft tissue sarcomas (STS) involving major vessels presents unique challenges, historically leading to amputation. Advances in vascular reconstruction have enabled limb‐sparing surgery (LSS), but outcomes and perioperative risks remain uncertain. This systematic review and meta‐analysis aimed to evaluate oncologic results following LSS with vascular reconstruction in extremity STS. A systematic review and single‐arm meta‐analysis were performed according to PRISMA guidelines, with registration in PROSPERO. PubMed, Embase, and Cochrane Library were searched from inception to June 2025 for studies reporting outcomes in patients with extremity STS undergoing LSS with vascular reconstruction. Pooled analyses estimated limb salvage, survival, and complication rates using random‐effects models. Thirty‐one studies comprising 520 patients were included.…
Genes, proteins, chemicals, diseases, species, mutations and cell lines named across the full text — each resolved to its canonical identifier and authoritative record.
Click any figure to enlarge with its caption.
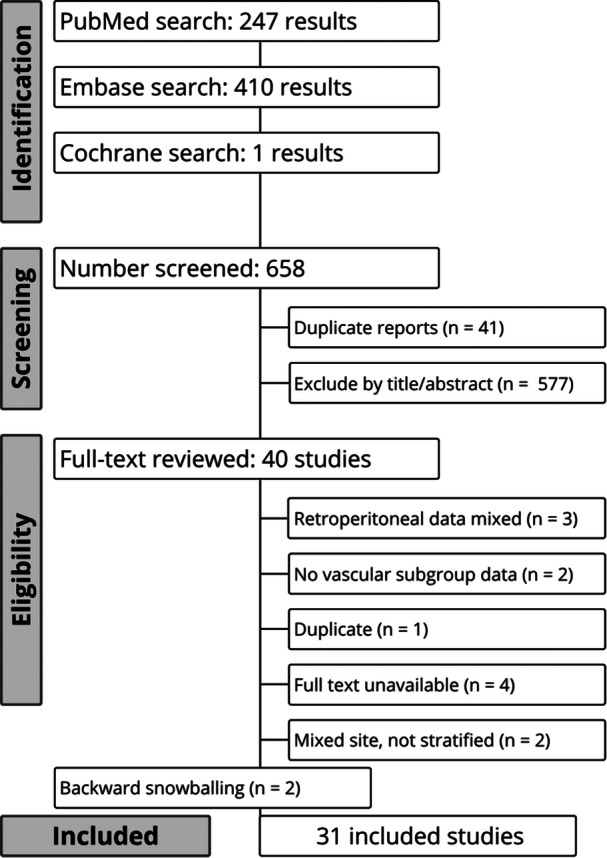 Figure 1
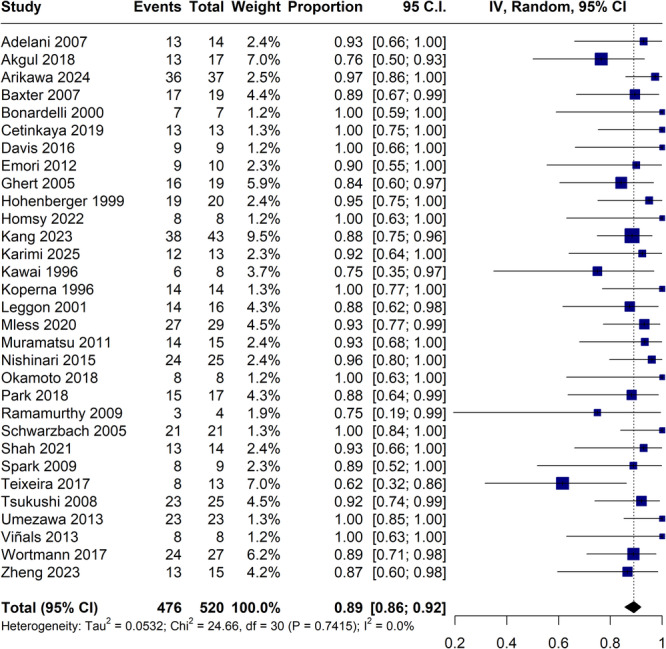 Figure 2
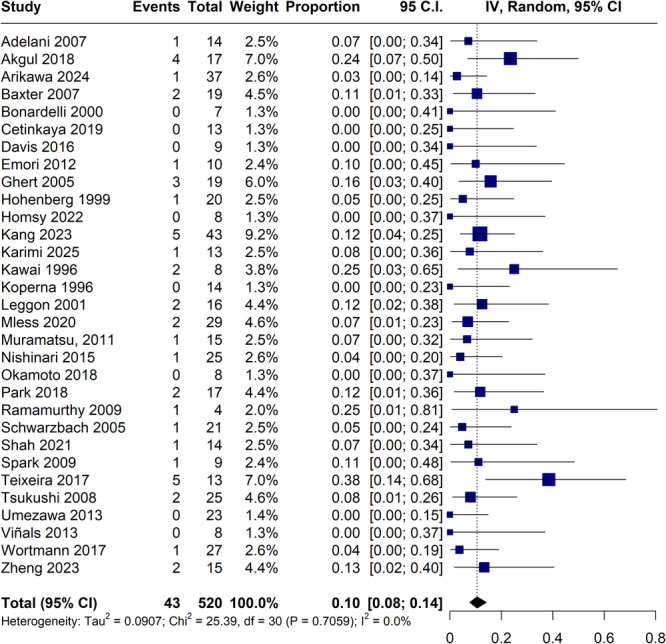 Figure 3
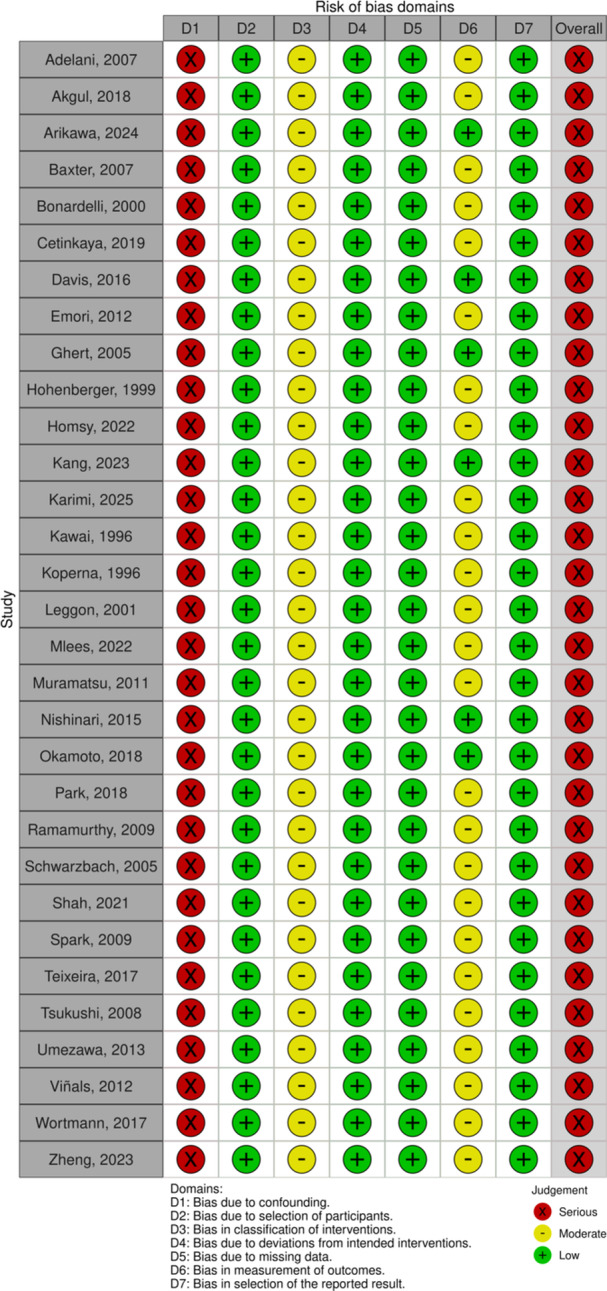 Figure 4
| First author, year | Country | Study design | Study period | No. of patients | Pediatric patients, | Female, | Mean age, years | Neoadjuvant treatment, % | Adjuvant treatment, | Follow‐up time, months |
|---|---|---|---|---|---|---|---|---|---|---|
| Adelani, 2007 | United States, single‐center | Retrospective | 1990–2005 | 14 | 1 (7.14) [17] | 6 (42.9) | 54 | NA |
RT: 6 (42.9) CT: 1 (7.1) RT + CT: 5 (35.7) None: 1 (7.1) | 19 (12–83) |
| Akgul, 2018 | Turkey, single‐center | Retrospective | 2004–2007 | 17 | 1 (5.88) [14] | 8 (47.1) | 37.8 | NA | NA | 39 (3–120) |
| Arikawa, 2024 | Japan, single‐center | Retrospective | 2010–2023 | 37 | 0 | 17 (45.9) | 50.8 |
RT: 15 (40.5) CT: 17 (46.0) | NA | 38 (3–161) |
| Baxter, 2007 | United States, single‐center | Retrospective | 1991–2004 | 19 | 9 (47.4) [6–17] | 1 (10) | 45.2 |
CT: 12 (63.2) CT + RT: 4 (21.1) CT + intraoperative RT: 3 (15.8) | NA | 68.5 |
| Bonardelli, 2000 | Italy, single‐center | Retrospective | 1995–1999 | 7 | 0 | 2 (28.6) | 56.7 | RT: 1 (14.3) | NA | 30.9 |
| Cetinkaya, 2019 | Turkey, single‐center | Retrospective | 2002–2014 | 13 | 0 | 7 (53.8) | 47.2 | CT: 3 (23.1) |
RT: 6 (46.1) CT: 2 (15.4) RT + CT: 4 (30.8) None: 1 (7.2) | 80.6 |
| Davis, 2017 | Canada, single‐center | Retrospective | 2005–2013 | 9 | 0 | 5 (55.6) | 50.3 |
CT: 3 (33.3) RT: 6 (66.7) |
RT: 4 (44.4) CT: 2 (22.2) None: 3 (33.3) | 74.7 |
| Emori, 2012 | Japan, single‐center | Retrospective | 1997–2009 | 10 | 2 (20) [12–16] | 5 (62.5) | 38.8 | CT: 5 (62.5) | RT: 2 (25) | 39 |
| Ghert, 2005 | Canada, single‐center | Retrospective | 1989–2000 | 19 | 0 | 7 (36.8) | 48.3 | RT: 14 (74) |
CT: 1 (6) RT: 4 (24) | 47 |
| Hohenberger, 1999 | Germany, multicenter | Retrospective | 1989–1992 | 20 | 0 | 6 (30) | 47 | NA | CT: 1 (2) | 29 |
| Homsy, 2022 | Finland, single‐center | Retrospective | 2014–2020 | 8 | 0 | 2 (25) | 54.6 | NA |
RT: 6 (75) None: 2 (25) | 35.3 |
| Kang, 2023 | South Korea, multicenter | Retrospective | 2005–2020 | 43 | 0 | 21 (k48.8) | 53 | NA |
CT: 34 (79.1) RT: 23 (53.5) | 23.8 |
| Karimi, 2025 | Iran, single‐center | Prospective | 2018–2020 | 13 | 0 | 4(30.8) | 41.54 |
RT: 8 (61.5) CT: 5 (38.5) | CT: 2 (15.4) | 20(12–24) |
| Kawai, 1996 | Japan, single‐center | Retrospective | 1982–1994 | 8 | 0 | 6 (75) | 47,5 | CT + RT: 6 (80) | NA | 30 |
| Koperna, 1996 | Austria, single‐center | Retrospective | 1984–1992 | 14 | 4 (35) [16–17] | 5 (35.7) | 30 |
CT: 10 (71.4) RT: 1 (7.1) |
CT + RT: 2 (14.3) RT: 1 (7.1) | 55 |
| Leggon, 2001 | United States, single‐center | Retrospective | 1969–1996 | 16 | 1 (6.25) [17] | 8 (50.0) | 45 | NA |
CT: 8 (50) RT: 4 (25) | 56 |
| Mlees, 2020 | Egypt, single‐center | Prospective | 2017–2019 | 29 |
| 13 (44.8) | 43.5 | NA | NA | 12 |
| Muramatsu, 2011 | Japan, single‐center | Retrospective | 1995–2010 | 15 | 1 (6.66) [17] | 4 | 54 |
CT: 13 (86.7) RT:4 (26.7) | NA | 69 |
| Nishinari, 2015 | Brazil, single‐center | Retrospective | 1995–2010 | 25 |
| 13 (52) | 38 |
Surgery + RT + CT: 7 (28) CT: 6 (24) CT + RT: 5 (20) Surgery + CT: 3(12) Surgery + RT: 1(4) | NA | 65.5 |
| Okamoto, 2018 | Japan, single‐center | Retrospective | 2006–2018 | 8 | 1 (12.5) [16] | 2 (25.0) | 59 | CT + RT: 1 (12.5) | NA | 24j |
| Park, 2018 | South Korea, single‐center | Retrospective | 2009–2015 | 17 |
| 9 (52.9) | 47 | NA | NA | 23.3 |
| Ramamurthy, 2009 | India, single‐center | Retrospective | 2004–2008 | 4 | 0 | 2 (50.0) | 36 | NA |
RT: 2 (50.0) RT + CT: 1 (25.0) | NA |
| Schwarzbach, 2005 | Germany, single‐center | Prospective | 1998–2003 | 21 | 0 | 11 (52.0) | 56 | NA |
RT: 13 (61.9) None: 8 (38.1) | 34 |
| Shah, 2021 | India, single‐center | Retrospective | 1995–2019 | 14 |
| 8 (57.1) | 33 | NA |
CT + RT: 4 (28.6) CT: 6 (42.9) RT: 1 (7.1) None: 3 (21.4) | NA |
| Spark, 2009 | Australia, single‐center | Retrospective | 2002–2006 | 9 |
| 4 (44.4) | 32 | CT: 1 (11.1) | RT: 2 (22.2) | 5‐48e |
| Teixeira, 2017 | Brazil, single‐center | Retrospective | 2002–2015 | 13 | 3 (23.1) [12–16] | 4 (30.7) | 36.4 |
CT: 7 (53.85) RT: 1 (7.6) | RT: 6 (46.1) | NA |
| Tsukushi, 2008 | Japan, single‐center | Retrospective | 1990–2004 | 25 | 0 | 10 (40) | 46 |
CT: 10 (40) RT: 2 (8) IORT: 2 (8) | 14 (56) | 70 |
| Umezawa, 2013 | Japan, single‐center | Retrospective | 1996–2010 | 23 | 2 (8.7) [16–17] | 7 (30.4) | 44.3 |
CT 5 (21.7) CT + RT 3 (13.0) RT 5 (21.7) |
CT: 3 (13.0) RT: 1 (4.3) | 2–240 |
| Viñals, 2013 | Spain, single‐center | Retrospective | 2003–2010 | 8 | 0 | 5 (62.5) | 34.9 | NA |
RT: 4 (50) CT: 1 (12.5) RT + CT: 3 (37.5) | 34.8 |
| Wortmann, 2017 | Germany, single‐center | Retrospective | 1990–2014 | 27 | NA | NA | NA | NA | NA | 24.5 |
| Zheng, 2023 | China, single‐center | Retrospective | 2016–2021 | 15 | 1 (6.66) [15] | 5 (66.6) | 36 |
CT: 11 (73.3) RT: 1 (6.7) None: 3 (20) |
CT: 12 (80) RT: 3 (20) | 12.5 |
| First author, year | Tumor site, | Tumor localization, | Tumor type, | Mean tumor size, cm | Surgical margin | Presentation status, |
|---|---|---|---|---|---|---|
| Adelani, 2007 | Lower extremity: 14 (100) |
Thigh, 6 (42.9) Groin, 7 (50) Popliteal fossa, 1 (7.1) |
Synovial sarcoma: 5 (35.7) Malignant fibrous histiocytoma: 4 (28.6) Liposarcoma: 4 (28.6) Leiomyosarcoma: 1 (7.1) | 12 | NA |
Primary tumor: 11 (79,7) Local recurrence: 2 (14,2) Metastatic tumors: 1 (7,1) |
| Akgul, 2018 |
Upper extremity: 2 (11.8) Lower extremity: 15 (88.2) |
Popliteal fossa: 6 (35.3) Distal femur: 3 (17.6) Proximal tibia: 3 (17.6) Thigh: 3 (17.6) Shoulder: 1 (5.9) Wrist: 1 (5.9) |
Osteosarcoma: 4 (23.5) Ewing′s sarcoma: 3 (17.6) Chondrosarcoma: 2 (11.8) Fusiform cell sarcoma: 2 (11.8) Fibrosarcoma: 1 (5.9) Rhabdomyosarcoma: 1 (5.9) Desmoid tumor: 1 (5.9) Pleomorphic sarcoma: 1 (5.9) Giant cell tumor of tendon sheath: 1 (5.9) Synovial sarcoma: 1 (5.9) | NA | R0 (100%) |
Primary tumor: 9 (56) Local recurrence: 7 (44) |
| Arikawa, 2024 | Lower extremity: 37 (100) |
Thigh 33 (89) Genicular Region 4 (11) |
Myxofibrosarcoma 7 (18.9) Pleomorphic sarcoma 4 (10.8) Leiomyosarcoma 2 (5.4) Solitary fibrous tumor 2 (5.4) Myxoid liposarcoma 3 (8.1) Pleomorphic rhabdomyosarcoma 1 (2.7) Synovial Sarcoma 2 (5.4) Parosteal osteosarcoma 1 (2.7) Extraskeletal myxoid chondrosarcoma 1 (2.7) Synovial sarcoma 3 (8.1) Angiomatoid fibrous histiocytoma 2 (5.4) Liposarcoma 1 (2.7) Alveolar soft part sarcoma 1 (2.7) Extraskeletal osteosarcoma 1 (2.7) Pleomorphic spindle cell sarcoma 1 (2.7) Angiosarcoma 1 (2.7) Mesenchymal chondrosarcoma 1 (2.7) Unclassifiable sarcoma 1 (2.7) | NA | NA | NA |
| Baxter, 2007 | Lower extremity: 19 (100) |
Distal femur: 7 (36.8) Groin: 3 (15.8) Posterior compartment distal thigh: 2 (10.5) Groin and proximal medial thigh compartment: 1 (5.3) Anterior thigh compartment: 1 (5.3) Medial thigh compartment: 1 (5.3) Proximal fibula: 1 (5.3) Knee: 1 (5.3) Proximal tibia: 1 (5.3) |
Osteosarcoma: 8 (42.1) Leiomyosarcoma: 2 (10.5) Angiosarcoma: 1 (5.3) Malignant fibrous histiocytoma: 1 (5.3) Fibrous histiocytoma: 1 (5.3) Myxoid liposarcoma: 1 (5.3) Extraskeletal Ewing's sarcoma: 1 (5.3) Chondrosarcoma: 1 (5.3) Osteoblastic osteosarcoma: 1 (5.3) Synovial sarcoma: 1 (5.3) | NA | NA | Primary 19 (100) |
| Bonardelli, 2000 | Lower extremity: 7 (100) |
Anterior thigh: 2 (28.6) Medial thigh: 4 (57.1) Posterior thigh: 1 (14.3) |
Malignant fibrous histiocytoma: 6 (85.7) Myxoid liposarcoma: 1 (14.3) | NA | Wide surgical margin by Enneking′s criteria |
Primary tumor: 5 (72) Residual: 2 (28) |
| Cetinkaya, 2019 |
Upper extremity: 1 (7.7) Lower extremity: 12 (92.3) |
Forearm: 1 (7.7) Inguinal: 2 (15.4) Thigh: 8 (61.5) Popliteal: 2 (15.4) |
Synovial sarcoma: 3 (23.1) Pleomorphic sarcoma: 3 (23.1) Liposarcoma: 2 (15.4) Leiomyosarcoma: 2 (15.4) Undifferentiated sarcoma: 1 (7.7) Intramuscular lipoma: 1 (7.7) Osteosarcoma: 1 (7.7) | 9.1 | R0 (100%) |
Primary tumor: 12 (92.3) Local recurrence: 1 (7.7) |
| Davis, 2017 | Lower extremity: 9 (100) |
Distal thigh: 2 (22.2) Proximal thigh: 77.8) |
Leiomyosarcoma: 3 (33.3) Epithelioid sarcoma: 1 (11.1) Malignant peripheral nerve sheath tumor: 1 (11.1) Liposarcoma: 1 (11.1) Sclerosing epithelioid fibrosarcoma: 1(11.1) Synovial sarcoma: 2 (22.2) | NA | NA | NA |
| Emori, 2012 | Lower extremity: 10 (100) | Inguinal: 10 (100) |
Synovial sarcoma: 4 (40) Leiomyosarcoma: 3 (30) Malignant fibrous histiocytoma: 1 (10) Extraskeletal mesenchymal chondrosarcoma: 1 (10) Ewing′s sarcoma: 1 (10) | 7.0 | R0 (100%) |
Primary tumor: 6 (60) Local recurrence: 2 (20) Residual tumors: 2 (20) |
| Ghert, 2005 | Lower extremity: 19 (100) | NA |
Myxoid liposarcoma: 3 (15.8) Hemangiopericytoma: 1 (5.3) Malignant peripheral nerve sheath tumor: 2 (10.6) Malignant fibrous histiocytoma: 4 (21.2) Other: 9 (47.4) | 10.9 | R0 (84%); R1 (16%) |
Primary tumor: 18 (94.7) Local recurrence: 1 (5.3) |
| Hohenberg, 1999 | Lower extremity: 20 (100) |
Hunter's canal: 7 (35) Groin: 4 (20) Thigh: 2 (10) Popliteal fossa: 4 (20) Small pelvis and groin: 1 (5) Quadriceps and adductor muscle: 1 (5) Flexor group lower limb: 1 (5) |
Malignant fibrous histiocytoma: 6 patients (30) Leiomyosarcoma: 5 patients (25) Liposarcoma: 4 patients (20) Alveolar type: 2 patients (10) Mesenchymoma: 1 patient (5) Embryonal type: 1 patient (5) Synovial sarcoma: 1 patient (5) | NA | R0 (100%) |
Primary 10 (50) Local Recurrence 5 (25) Residual 5 (25) |
| Homsy, 2022 | Lower extremity: 8 (100) | Proximal thigh or inguinal: 8 (100) |
Leiomyosarcoma: 4 (50) Myoepithelioma: 1 (12.5) Myxoid lipossarcoma: 1 (12.5) Alveolar soft tissue sarcoma: 1 (12.5) Synovial sarcoma: 1 (12.5) | NA | NA |
Primary tumor: 6 (75) Local recurrence: 2 (25) |
| Kang, 2023 |
Upper extremity: 7 (16.3) Lower extremity: 36 (83.7) | NA |
Osteosarcoma: 8 (18.6) Pleomorphic sarcoma: 6 (14) Liposarcoma: 6 (14) Leiomyosarcoma: 5 (11.6) Myxofibrosarcoma: 4 (9.3) Synovial sarcoma: 4 (9.3) Ewing sarcoma: 2 (4.7) Chondrosarcoma: 1 (2.3) Epithelioid sarcoma: 2 (4.7) Fibromatosis: 2 (4.7) Other: 3 (7) | 7.9 and 4.5 | R0 (69,8%); R1 (23,3%); R2 (7%) |
Primary tumor: 26 (60.5) Local recurrence: 17 (39.5) |
| Karimi, 2025 |
Upper extremity: 1 (7,7) Lower extremity: 12 (92,3) | NA |
Chondrosarcoma: 1 (7.7). Liposarcoma: 2 (15.4) Osteosarcoma: 4 (30.8) Synovial sarcoma: 3 (23.1) Undifferentiated Pleomorphic Sarcoma: 3 (23.1) | 10.92 | R0 (69,2%); R1 (30,8%) |
Primary tumor: 8 (61.5) Local recurrence: 5 (38.5) |
| Kawai, 1996 | Lower extremity: 8 (100) |
Thigh: 6 (75) Popliteal fossa: 2 (25) |
Synovial sarcoma: 3 patients Malignant fibrous histiocytoma: 1 patient Malignant schwannoma: 1 patient Desmoid: 1 patient Liposarcoma: 1 patient Clear cell sarcoma: 1 patient | NA | NA | NA |
| Koperna, 1996 | Lower extremity: 15 (100) |
Femur: 9 (64.3) Pelvic bone: 2 (14.3) Proximal tibia: 2 (14.3) Distal femur: 1 (7.1) Pubic bone: 1 (7.1) |
Osteosarcoma: 8 (57.1) Liposarcoma: 2 (14.3) Ewing sarcoma: 1 (7.1) Malignant fibrous histiocytoma: 1 (7.1) Synovial sarcoma: 1 (7.1) Fibrosarcoma: 1 (7.1) | NA | R0 (100%) | NA |
| Leggon, 2001 |
Lower Extremity: 14 (87.5) Upper Extremity: 2 (12.5) |
Thigh: 6 (40) Groin: 2 (13.33) Proximal Tibia: 1 (6.67) Pelvis: 1 (6.67) Calf: 1 (6.67) Knee: 1 (6.67) Arm: 1 (6.67) Proximal fibula and anterior tibia: 1 (6.67) Distal femur: 1 (6.67) |
Liposarcoma: 3 (21.43) Malignant fibrous histiocytoma: 2 (14.29) Fibrosarcoma: 1 (7.14) Rhabdomyosarcoma: 1 (7.14) Synovial sarcoma: 1 (7.14) Spindle cell sarcoma: 1 (7.14) Osteogenic sarcoma: 3 (21.43) Dedifferentiated parosteal osteosarcoma: 1 (7.14) Chondrosarcoma: 1 (7.14) | 9.5 | NA |
Primary tumor: 7 (43) Local recurrence: 2 (14) Residual 7 (43) |
| Mlees, 2020 |
Upper extremity: 7 (24.2) Lower extremity: 22 (75.8) |
Arm: 5 (17.2) Forearm: 2 (6.8) Inguinal: 2 (6.8) Thigh: 19 (65.8) Infragenicular: 1 (3.4) |
Rhabdomyosarcoma: 10 (34.4) Well‐differentiated liposarcoma: 6 (20.6) Myxoid liposarcoma: 2 (7.1) High‐grade pleomorphic sarcoma:: 11 (37.9) | 12.34 | R0 (100%) | Primary tumor 29 (100) |
| Muramatsu, 2011 | Lower extremity: 14 (100) |
Proximal: 7 (46.67) Distal: 4 (26.67) Middle: 2 (13.33) Groin: 2 (13.33) |
Malignant fibrous histiocytoma: 5 (33.33) Synovial sarcoma: 4 (26.67) Liposarcoma: 2 (13.33) Osteosarcoma: 2 (13.33) Chondrosarcoma: 1 (6.67) Leiomyosarcoma: 1 (6.67) | 16 | NA | Primary tumor 14 (100) |
| Nishinari, 2015 | Lower extremity: 25 (100) |
Tight: 20 (80) Inguinal region: 4 (16) Infrageniculate region: 1 (4) |
Synovial sarcoma: 8 (32) Liposarcoma: 3 (12) Fibrosarcoma: 2 (8) Pleomorphic sarcoma: 2 (8) Leiomyosarcoma: 2 (8) Fibromyxoid tumor: 1 (4) Fibrohistiocytoma: 1 (4) Myxofibrosarcoma: 1 (4) Malignant peripheral nerves sheath tumor: 1 (4) Chondrosarcoma: 1 (4) Hemangiopericytoma: 1 (4) High‐grade fusocellular sarcoma: 1 (4) Ewing Sarcoma: 1 (4) | NA | R0 (72%); R1 (28%) | NA |
| Park, 2018 |
Upper extremity: 2 (11.9) Lower extremity: 15 (88.2) |
Tight: 12 (70.6) Calf: 2 (11.7) Inguinal: 1 (5.9) Axilla: 1 (5.9) Upper arm: 1 (5.9) |
Osteosarcoma: 3 (17.7) Synovial sarcoma: 2 (11.7) Chondrosarcoma: 2 (11.7) Fibromatosis: 2 (11.7) Ewing sarcoma: 1 (5.9) Pleomorphic spindle cell sarcoma: 1 (5.9) Angiosarcoma: 1 (5.9) Myxoid malignant fibrous histocytoma: 1 (5.9) Undifferentiated sarcoma: 1 (5.9) Malignant hemangiopericytoma: 1 (5.9) Fibrohistiocytoma: 1 (5.9) Hemangioendoendothelioma: 1 (5.9) | NA | NA |
Primary tumor: 11 (64.7) Local recurrence: 6 (35.3) |
| Ramamurthy, 2009 | Lower extremity: 4 (100) | Tight: 4 (100) |
Synovial Sarcoma: 1 (25.0) Rhabdomyosarcoma: 1 (25.0) Malignant peripheral nerve sheath tumor: 1 (25.0) MFH: 1 (25.0) | 13.5 | NA | NA |
| Schwarzbach, 2005 | Lower extremity: 21 (100) |
Tight: 16 (76.0) Groin: 5 (24.0) |
Liposarcoma: 11 (52.0) Leiomyosarcoma: 4 (19.0) Malignant fibrous histiocytoma: 3 (14.0) Synovial sarcoma: 2 (10.0) Angiosarcoma: 1 (6.0) | NA | R0 (100%) |
Primary tumor: 15 (71.0) Local recurrence: 6 (29.0) |
| Shah, 2021 |
Upper extremity: 2 (16.6) Lower extremity: 12 (83.4) |
Tight: 11 (78.5) Leg: 1 (7.1) Arm: 2 (14.4) |
Osteosarcoma 5 (35.7) Synovial sarcoma 4 (28.6) Fibromatosis: 2 (14.3) Liposarcoma: 1 (7.1) Malignant peripheral nerve sheath tumor: 1 (7.1) Giant cell tumor: 1 (7.1) | NA | R0 (74%) R1 (26%) | NA |
| Spark, 2009 | Lower extremity: 8 (100) |
Popliteal fossa: 4 (50) Groin or medial thigh: 4 (50) |
Leiomyosarcoma: 4 (57) Synovial chondrosarcoma: 1 (14) Synovial sarcoma: 1 (14) Liposarcoma: 1 (14) Malignant peripheral nerve sheath tumour: 1 (14) | NA | R0 (100%) |
Primary tumor: 7 (87.5) Local recurrence: 1 (12.5) |
| Teixeira, 2017 |
Upper extremity: 1 (7.7) Lower extremity: 12 (92.3) |
Popliteal: 3 (23.5) Femur: 2 (15.3) Tibia: 4 (30.7) Thigh: 1 (7.6) Arm: 1 (7.6) Inguinal: 2 (15.3) |
Malignant fibrous histiocytoma: 4 (30.7) Osteosarcoma: 3 (20.3) Fibrosarcoma: 1 (7) Ewing's sarcoma: 1 (7) Synovial sarcoma: 1 (7) Pleomorphic sarcoma: 1 (7) Chondrosarcoma: 1 (7) Hemangiopericytoma: 1 (7) Hemangiopericytoma: 1 (7) | NA | NA | NA |
| Tsukushi, 2008 | Lower extremity: 25 (100) |
Groin 6 (24) Thigh 17 (68) Popliteal 2 (8) |
Liposarcoma 9 (36) Synovial sarcoma 5 (20) Malignant fibrous histiocytoma 3 (12) Leiomyosarcoma 2 (8) Rhabdomyosarcoma 2 (8) Epithelioid sarcoma 1 (4) Extraskeletal myxoid chondrosarcoma 1 (4) Extraskeletal osteosarcoma 1 (4) Malignant peripheral nerve sheath tumor 1 (4) | NA | NA | NA |
| Umezawa, 2013 | Lower extremity: 23 (100) |
Thigh: 15 (65.2) Groin: 5 (21.7) Popliteal: 2 (8.7) Lower leg: 1 (4.2) |
Liposarcoma: 9 (39.1) Osteosarcoma: 4 (17.4) Myxofibrosarcoma: 3 (13.0) Synovial sarcoma: 3 (13.0) Chondrosarcoma: 2 (8.7) Angiomatoid fibrous histiocytoma: 2 (8.7) | NA | R0 (100%) | Primary tumor: 21 (100) |
| Viñals, 2013 |
Upper extremity: 2 (25) Lower extremity: 6 (75) |
Thigh: 6 (75) Axilla: 1 (12.5) Forearm: 1 (12.5) |
Leiomyosarcoma: 1 (12.5) Synovial sarcoma: 5 (62.5) Malignant peripheral nerves sheath tumor: 1 (12.5) Extraskeletal osteosarcoma: 1 (12.5) | NA | R0 (98%) R1 (2%) |
Primary tumor: 2 (25) Local recurrence: 6 (75) |
| Wortmann, 2017 | Lower extremity: 27 (100) | NA | NA | 10.5 | R0 (88%); R1 (12%) |
Primary tumor: 18 (66.6) Local recurrence: 9 (33.3) |
| Zheng, 2023 | Lower extremity: 15 (100) |
Groin: 4 (26.7) Thigh: 7 (46.7) Popliteal: 3 (20) Lower leg: 1 (6.7) |
Liposarcoma: 3 (20.0) Synovial sarcoma: 3 (20.0) Undifferentiated pleomorphic sarcoma: 3 (20.0) Leiomyosarcoma: 1 (6.7) Osteosarcoma: 5 (33.3) |
≤ 10 cm: 5 (33.3) > 10 cm: 10 (66.7) | R0 (49%); R1 (32%); R2 (6%); Rx (13%) |
Primary tumor: 11 (73.3) Local recurrence: 4 (26.7) |
| Okamoto 2018 | Lower extremity: 8 (100) |
Thigh: 6 (75) Groin: 2 (25) |
Liposarcoma: 3 (37) Myxofibrosarcoma: 2 (25) Synovial sarcoma: 1 (12.5) Leiomyosarcoma: 1 (12.5) | 9 | R0 (100%) | Primary 8 (100) |
| First author, year | Arterial reconstruction, | Venous reconstruction, | Average graft length, cm | Anticoagulation therapy | Reconstructed artery by location | ||||||
|---|---|---|---|---|---|---|---|---|---|---|---|
| Autologous graft | Synthetic graft | Primary anastomosis | Other | Autologous graft | Synthetic graft | Primary anastomosis | Other | ||||
| Adelani, 2007 | 7 (50) | 7 (50) | 0 | 0 | 6 (100) | 0 | 0 | 0 | 16.9 | Warfarin or aspirin |
EIA—SFA DFA EIA—CFA EIA—PopA CFA—SFA SFA SFA—PopA DFA PopA |
| Akgul, 2018 | 15 (88.2) | 0 | 2 (11.8) | 0 | 0 | 2 (11.8) | 0 | 0 | NA | Warfarin or aspirin |
FA PopA PTA AX RAD UL |
| Arikawa, 2024 | 37 (100) | 0 | 0 | 0 | 10 (27.0) | 0 | 0 | 0 | 14.2 | None | NA |
| Baxter, 2007 | 9 (47.4) | 0 | 10 (52.6) | 0 | 9 (47.4) | 2 (10.5) | 10 (52.6) | 0 | NA | NA |
CFA SFA PopA |
| Bonardelli, 2000 | 2 (28.6) | 2 (28.6) | 0 | 2 (28.6) | 5 (71.4) | 0 | 0 | 2 (28.6) | NA | Dicumarolic drugs | NA |
| Cetinkaya, 2019 | 11 (84.6) | 1 (7.7) | 0 | 0 | 12 (92.3) | 0 | 0 | 0 | 25.7 | Heparin and warfarin |
BRA FA PopA |
| Davis, 2017 | 8 (88.9) | 0 | 1 (11.1) |
| 0 | 0 | 1 (11.1) | 0 | NA | NA |
EIA—SFA CFA—PopA FA—PopA SFA—SFA SFA—PopA |
| Emori, 2012 | 0 | 5 (50) | 0 | 5 (50) | 0 | 9 (90.0) | 0 | 0 | 13.6 | Cilostazol, heparin, and warfarin |
EIA—SFA + DFA EIA—SFA CFA—SFA CFA—SFA + DFA |
| Ghert, 2005 | 12 (63.2) | 4 (21.1) | 2 (10.5) | 0 | 11 (57.9) | 0 | 1 (5.3) | 1 | NA | Heparin and warfarin |
EIA—FA FA PopA PTA |
| Hohenberger, 1999 | 10 (52.6) | 9 (47.4) | 0 | 0 | 6 (54.5) | 4 (36.4) | 1 (9.1) | 0 | NA | NA |
SFA PopA PopA—ATA FA FA—PopA |
| Homsy, 2022 | 6 (37.5) | 0 | 0 | 10 (62.5) | 6 (37.5) | 0 | 0 | 10 (62.5) | NA | Aspirin, clopidogrel, and heparin |
EIA—SFA SFA SFA DFA |
| Kang, 2023 | 28 (65.1) | 10 (23.3) | 0 | 5 (11.6) | 12 (57.1) | 5 (23.8) | 0 | 4 (19.0) | NA | NA |
EIA—FA EIA—PopA FA FA—PopA PopA PopA—PTA AX BRA RAD |
| Karimi, 2025 | 3 (23.1) | 0 | 0 | 0 | 0 | 0 | 0 | 0 | NA | NA | NA |
| Kawai, 1996 | 4 (50) | 4 (50) | 0 | 0 | 2 (28.6) | 5 (71.4) | 0 | 0 | 12.5 | Warfarin |
PopA 2 SFA 6 |
| Koperna, 1996 | 9 (60.0) | 3 (20.0) | 0 | 0 | 6 (40.0) | 2 (13.3) | 0 | 0 | NA | Heparin, antiplatelet therapy, and oral anticoagulants |
PopA FA—PopA FA |
| Leggon, 2001 | 13 (81.3) | 1 (6.3) | 2 (12.5) | 0 | 10 (71.4) | 0 | 2 (14.3) | 0 | 14,00 | NA |
FA PopA EIA—FA PTA PTA/ATA |
| Mlees, 2020 | 16 (55.2) | 13 (44.8) | 0 | 0 | 4 (57.1) | 3 (42.9) | 0 | 0 | 12 (autologous)/15 (synthetic) | Novel oral anticoagulants and antiplatelet therapy |
EIA—FA FA FA—PopA Pop A—PTA AX—BRA BRA |
| Muramatsu, 2011 | 12 (85.7) | 2 (14.3) | 0 | 0 | 10 (83.3) | 2 (16.7) | 0 | 0 | 21,00 | Warfarin and panalzine | FA |
| Nishinari, 2015 | 17 (81.0) | 4 (19.0) | 0 | 0 | 18 (78.3) | 5 (21.7) | 0 | 0 | NA | NA |
EIA—SFA EIA—DFA PopA CFA—SFA FA—PopA SFA—SFA DFA—PopA Pop A—PTA |
| Okamoto 2018 | 6 (85.7) | 1 (14.3) | 0 | 0 | 8 (100) | 0 | 0 | 0 | NA | NA |
EIA—SFA DFA 1 CFA—SFA DFA 4 SFA 2 |
| Park, 2018 | 11 (78.6) | 3 (21.4) | 0 | 0 | 10 (77.0) | 3 (23.0) | 0 | 0 | NA | Heparin plus others (according to surgeon′s preference) |
FA PopA PopA—PTA AX—BRA BRA |
| Ramamurthy, 2009 | 3 (100) | 0 | 0 | 0 | 2 (100) | 0 | 0 | 0 | NA | Heparin and warfarin | SFA |
| Schwarzbach, 2005 | 8 (40.0) | 12 (60) | 0 | 0 | 2 (16.7) | 10 (83.3) | 0 | 0 | NA | Heparin and phenprocoumon |
EIA—FA EIA—CRU FA—FA FA—PopA DFA |
| Shah, 2021 | 7 (50.0) | 7 (50.0) | 0 | 0 | 5 (50.0) | 5 (50.0) | 0 | 0 | NA | Heparin, aspirin, and acenocoumarol |
FA 7 PopA 4 BRA 2 PTA 1 |
| Spark, 2009 | 8 (100) | 0 | 0 | 0 | 8 (100) | 0 | 0 | 0 | NA | Clexane for 48 h, then standard DVT prophylaxis |
CFA SFA SFA—PopA PopA |
| Teixeira, 2017 | 12 (92.3) | 1 (7.7) | 0 | 0 | NA | NA | NA | NA | NA | NA |
EIA—FA FA—PopA PopA BRA |
| Tsukushi, 2008 | 20 (80.0) | 5 (20.0) | 0 | 0 | 7 (58.3) | 5 (41.7) | 0 | 0 | 12.8 | Warfarin | NA |
| Umezawa, 2013 | 22 (95.7) | 1 (4.3) | 0 | 0 | 13 (100) | 0 | 0 | 0 | 13 | Heparin (given to one patient only) |
EIA FA PopA ATA |
| Viñals, 2013 | 8 (100) | 0 | 0 | 0 | 1 (100) | 0 | 0 | 0 | NA | NA |
EIA—FA SFA CUB AX |
| Wortmann, 2017 | 23 (49) | 24 (51) | 0 | 1 | 2 (18) | 9 (82) | 0 | 0 | NA | NA |
EIA—FA FA SFA FA—PopA PopA PopA—CRU |
| Zheng, 2023 | 0 | 15 (100) | 0 | 0 | 0 | 3 (100) | 0 | 0 | NA | Enoxaparin until oral anticoagulation was feasible |
FA SFA PopA PTA |
| Study | Total patients | Amputation events | Cause(s) of amputation | Time interval to amputation |
|---|---|---|---|---|
| Adelani, 2007 | 14 | 1 | Acute arterial graft occlusion | Not reported |
| Akgul, 2018 | 17 | 4 | Two due to thrombosis and wound infection; two due to local recurrence | Perioperative period (wound infection cases) |
| Arikawa, 2024 | 37 | 1 | Graft occlusion | Postoperative day 1 |
| Baxter, 2007 | 19 | 2 | One due to unrecognized anterior compartment syndrome; one due to arterial thrombosis | Eight months postoperatively (thrombosis case) |
| Bonardelli, 2000 | 7 | 0 | NA | NA |
| Cetinkaya, 2019 | 13 | 0 | NA | NA |
| Davis, 2016 | 9 | 0 | NA | NA |
| Emori, 2012 | 10 | 1 | Graft occlusion | Not reported |
| Ghert, 2005 | 19 | 3 | One due to wound infection; one due to rupture of iliofemoral repair; one due to vascular anastomosis breakdown | Not reported |
| Hohenberg, 1999 | 20 | 1 | Graft failure | Postoperative day 17 |
| Homsy, 2022 | 8 | 0 | — | — |
| Kang, 2023 | 43 | 5 | Not reported | Not reported |
| Karimi, 2025 | 13 | 1 | Graft failure | Not reported |
| Kawai, 1996 | 8 | 2 | One due to graft infection; one due to acute occlusion of the infrapopliteal arteries | Not reported |
| Koperna, 1996 | 14 | 0 | NA | NA |
| Leggon, 2001 | 16 | 2 | One due to local recurrence; one due to acute vascular occlusion | Not reported |
| Mless, 2020 | 29 | 2 | Local recurrence | Eight and 20 months postoperatively, respectively |
| Muramatsu, 2011 | 15 | 1 | Gradual deterioration with ischemic pain | Seven months postoperatively |
| Nishinari, 2015 | 25 | 1 | Local recurrence | Eight months postoperatively |
| Okamoto, 2018 | 8 | 0 | NA | NA |
| Park, 2018 | 17 | 2 | Local recurrence | Not reported |
| Ramamurthy, 2009 | 4 | 1 | Limb gangrene | Not reported |
| Schwarzbach, 2005 | 21 | 1 | Local recurrence | Twelve months postoperatively |
| Shah, 2021 | 14 | 1 | Full‐thickness muscle necrosis | Not reported |
| Spark, 2009 | 9 | 1 | Local recurrence | Ten months postoperatively |
| Teixeira, 2017 | 13 | 5 | Not reported | Not reported |
| Tsukushi, 2008 | 25 | 2 | Postoperative complications | Not reported |
| Umezawa, 2013 | 23 | 0 | NA | NA |
| Viñals, 2013 | 8 | 0 | NA | NA |
| Wortmann, 2017 | 27 | 1 | Life‐threatening bleeding events | Not reported |
| Zheng, 2023 | 15 | 2 | Local recurrence | Not reported |
Peer Reviews
No public reviews on file for this paper yet. If you reviewed it on a platform where reviews are public (OpenReview, ICLR, NeurIPS, ICML), you can paste yours below so the community can read it here.
Videos
No videos yet. Explain this paper in a talk, walkthrough, or lecture? Add one.
Taxonomy
TopicsReconstructive Surgery and Microvascular Techniques · Sarcoma Diagnosis and Treatment · Surgical site infection prevention
Introduction
1
Soft tissue sarcomas (STS) of the extremities are a heterogeneous group of malignant mesenchymal tumors that often pose a therapeutic challenge when adjacent to or infiltrating major vascular structures. Since 1989, limb‐sparing surgery (LSS) has been favored over amputation, as studies have shown that achieving negative margins (R0) is the key determinant of outcomes. Amputation is reserved for cases where R0 resection or satisfactory function cannot be achieved [1, 2].
En bloc resection of tumors with vascular involvement followed by immediate vascular reconstruction enables limb preservation without compromising oncologic outcomes, provided that negative margins are achieved [3]. Autologous vein grafts, especially the great saphenous vein (GSV), remain the conduit of choice due to superior patency and lower infection rates compared to prosthetic alternatives [4, 5, 6]. Nevertheless, vascular reconstruction in this setting is technically demanding and associated with significant morbidity, including graft thrombosis, deep wound infections, and local recurrence. Furthermore, the need for venous reconstruction remains controversial, with some authors advocating selective reconstruction based on venous caliber and intraoperative findings [7, 8].
Recent institutional experiences have underscored the critical role of a multidisciplinary approach, integrating orthopedic, vascular, and plastic surgery teams, in reducing complications and optimizing both functional and oncologic outcomes [9]. However, most available evidence is limited to small retrospective cohorts, and there is no consensus on optimal reconstruction techniques, graft types, or perioperative management. Therefore, we conducted a systematic review and single‐arm meta‐analysis to synthesize existing data on vascular reconstruction in extremity STS. Our objectives were to estimate limb salvage rates, graft patency, and perioperative complication profiles, and to provide evidence to guide clinical decision‐making in this complex surgical population.
Methods
2
We performed the systematic review and meta‐analysis according to the Cochrane Handbook for Systematic Reviews of Interventions and structured it according to the Preferred Reporting Items for Systematic Reviews and Meta‐Analysis (PRISMA) guidelines, presented in Supplementary Table S1 [10, 11]. The study protocol was registered in the International Prospective Register of Systematic Reviews (PROSPERO) under registration number CRD420251082601 [12].
Outcomes and Subgroup Analysis
2.1
The outcomes of interest were: (1) overall survival (OS); (2) disease‐free survival (DFS); (3) local recurrence; (4) distant metastasis; (5) limb salvage; (6) amputation; (7) early (≤ 6 months) and late (> 6 months) graft thrombosis; (8) graft patency; (9) reperfusion injury; (10) compartment syndrome; (11) any wound‐related complication (including dehiscence, infection, necrosis, delayed healing, seroma, and hematoma); (12) wound infection; and (13) mortality due to disease at any follow‐up time point.
We conducted subgroup analyses to explore potential sources of heterogeneity, stratifying studies by follow‐up duration (short‐term < 24 months, mid‐term 24–60 months, and long‐term > 60 months), graft type (arterial autologous, arterial prosthetic, venous autologous, venous prosthetic, arterial and venous autologous, arterial autologous with venous prosthetic, arterial prosthetic with venous autologous, and arterial and venous prosthetic grafts), and reconstruction type (arterial‐only vs combined arterial and venous reconstruction) for limb salvage. For the graft‐type subgroup analysis, studies in which no interposition graft was used (primary anastomosis) and those using allografts were excluded to preserve consistent classification of conduit material. We additionally performed a cause‐specific subgroup analysis for amputation outcomes, categorizing events according to the reported indication (vascular complications, local tumor recurrence, or postoperative infection) when such information was available and at least one event was observed.
Eligibility Criteria
2.2
Inclusion in this meta‐analysis was limited to studies that met all of the following eligibility criteria: (1) enrolled patients with resectable STS or osteosarcoma of the extremities; (2) included patients undergoing LSS with planned vascular reconstruction; and (3) reported at least one of the outcomes of interest.
Studies were excluded if they met any of the following criteria: (1) included retroperitoneal or trunk sarcomas without stratified outcome reporting; (2) involved patients undergoing amputation; (3) lacked full‐text availability; or (4) were case reports, trial registrations without available results, meta‐analyses, reviews, or animal studies.
Search Strategy and Study Selection
2.3
We systematically searched PubMed, Embase, and Cochrane Library databases from inception to June 20th, 2025. The search strategy was (“Soft Tissue Sarcoma” OR “Sarcoma Of The Extremities” OR “Extremity Sarcoma”) AND (“Vascular Reconstruction” OR “Reconstructive Surgical Procedures” OR “Revascularization” OR “Limb‐Sparing” OR “Vessel Reconstruction”). We also searched the references of the included studies and previous systematic reviews and meta‐analyses aiming for the inclusion of additional studies [13].
Two authors (L.M.D. and V.S.M.) independently conducted the search, imported results into Rayyan, a web‐based systematic review tool, and triaged the studies. After the exclusion of duplicates and titles/abstracts unrelated to the clinical question, the eligibility of each remaining study was assessed based on the review of the full‐text articles. Disagreements were solved by consensus.
Data Extraction
2.4
Two authors (V.S.M. and G.H.A.M) independently extracted data from the included studies using a standardized form. Extracted information included: (1) general study data (first author, year of publication, country, study design, and study period); (2) sample characteristics (number of patients, number and percentage of females, mean age, neoadjuvant treatment use, adjuvant treatment use, and follow‐up time in months); (3) tumor characteristics (tumor site, localization, histological type, mean tumor size in centimeters, and presentation status); and (4) vascular resection and reconstruction details (type of materials used for arterial and venous reconstruction, mean graft length, anticoagulation regimen, and the number and anatomical identity of arteries resected and reconstructed).
Risk of Bias and Quality Assessment
2.5
Two independent reviewers (L.M.D and V.S.M.) assessed the Risk of Bias In Non Randomized Studies of Interventions (ROBINS‐I V2) tool [14]. Disagreements were resolved through consensus. Funnel plots were not performed because they are not recommended for single‐arm meta‐analyses, as the relationship between study size and effect is unclear and these methods are unreliable for detecting publication bias in meta‐analyses of proportions [15, 16].
Statistical Analysis
2.6
Pooled proportions of outcomes were calculated using the inverse variance method with logit transformation. Between‐study heterogeneity was assessed using the Cochran Q test and the I² statistic, with heterogeneity considered significant when p < 0.10 and I² > 25%. In the presence of significant heterogeneity, leave‐one‐out sensitivity analysis was performed by sequentially excluding each study from the meta‐analysis to assess the stability of the results and ensure that findings were not driven by any single study. We regarded a p value < 0.10 as statistically significant for subgroup interaction, as per Cochrane guidelines. All statistical analyses were performed using R statistical software (version 4.5; R Foundation for Statistical Computing, Vienna, Austria).
Results
3
Study Selection
3.1
As detailed in Figure 1, the initial search identified 658 results. After removal of duplicate records and assessment of the studies based on title and abstract, 42 full‐text studies remained for full review according to prespecified criteria. Of these, 31 studies were included [2, 4, 5, 6, 7, 8, 17, 18, 19, 20, 21, 22, 23, 24, 25, 26, 27, 28, 29, 30, 31, 32, 33, 34, 35, 36, 37, 38, 39, 40, 41]. Supplementary Table S2 lists the excluded studies from the full‐text screening stage and the reasons for their exclusion.
Preferred reporting items for systematic reviews and meta‐analysis (PRISMA) flow diagram of study screening and selection.
Patient Characteristics
3.2
The cohort comprised 520 patients with STS of the extremities who underwent LSS with vascular reconstruction. Approximately 40.4% of the patients were female, and the mean age across studies ranged from 29.3 to 59 years. Pediatric patients were uncommon: at least 26 participants aged 6–17 years were identified among 520 total patients (5%); 14 studies reported none, and six studies did not provide sufficient data to quantify pediatric cases.
Neoadjuvant therapy was not consistently reported across studies; only 17 studies provided these data, encompassing a total of 282 patients. Among studies reporting neoadjuvant treatment, chemotherapy was the most common modality (108 patients, 38.3%), followed by radiotherapy alone (61 patients, 21.6%) and chemoradiotherapy (19 patients, 6.7%). Similarly, adjuvant therapy was inconsistently reported, with data available from 20 studies including 311 patients. Within this subset, radiotherapy was the most frequently used modality (88 patients, 28.3%), followed by chemotherapy (73 patients, 23.5%) and chemoradiotherapy (19 patients, 6.1%). General study characteristics and patient demographics are summarized in Table 1.
The most frequently reported tumor localizations were the thigh (285 patients; 59.5%), inguinal region (76 patients; 15.9%), and popliteal fossa (41 patients; 8.6%), highlighting the predominance of sarcomas in the lower extremities. The most frequently reported histological subtypes were liposarcoma (115 patients; 24.0%), synovial sarcoma (94 patients; 19.6%), and osteosarcoma (71 patients; 14.8%). The vast majority of studies reported performing en bloc resection. Among studies that contained surgical resection margin analysis, most included only patients with negative margins, although one study reported positive margins in up to 51% of patients [41]. Furthermore, minimum margin sizes were mentioned in only nine studies, ranging between 2 and 3 centimeters. Anatomopathological features and tumor profiles of included patients are summarized in Table 2.
Autologous grafts were predominantly used for both arterial (347 patients, 72.1%) and venous (214 patients, 64.8%) reconstructions. Average graft lengths ranged from 12.5 to 25.7 centimeters. While many authors did not report postoperative anticoagulation regimens, heparin and warfarin were the most commonly used agents among those who did. Further details on vascular reconstruction procedures and postoperative anticoagulation are presented in Table 3.
Pooled Analyses
3.3
Limb Salvage and Amputation
3.3.1
The limb salvage rate was 89% (95% CI, 86%–92%; I² = 0%; Figure 2), while the amputation rate was 10% (95% CI, 8%–14%; I² = 0%; Figure 3). Amputations, although infrequent, occurred in diverse clinical contexts across the 31 studies. The main causes were vascular complications such as graft thrombosis or occlusion, as well as local tumor recurrence and postoperative infections. Timing varied from immediate postoperative loss to delayed amputations occurring several months after surgery. While many studies reported no amputations, others lacked detailed reporting on causality or timing. Details are summarized in Table 4.
Forest plot for limb salvage. CI, confidence interval; IV, inverse variance.
Forest plot for amputation. CI, confidence interval; IV, inverse variance.
Survival and Oncologic Outcomes
3.3.2
The pooled proportion of OS was 89% at 1 year (95% CI, 82%–94%; I² = 56.5%; Supplementary Figure 1), 78% at 2 years (95% CI, 71%–83%; I² = 29.6%; Supplementary Figure 2), 71% at 3 years (95% CI, 58%–81%; I² = 65.4%; Supplementary Figure 3), and 62% at 5 years (95% CI, 51%–72%; I² = 61.8%; Supplementary Figure 4).
The pooled proportion of DFS was 74% at 1 year (95% CI, 60%–84%; I² = 58.3%; Supplementary Figure 5), 56% at 2 years (95% CI, 44%–68%; I² = 45.3%; Supplementary Figure 6), 42% at 3 years (95% CI, 25%–62%; I² = 65.4%; Supplementary Figure 7), and 55% at 5 years (95% CI, 34%–74%; I² = 79.7%; Supplementary Figure 8).
The pooled proportion of mortality related to the disease at any follow‐up was 35% (95% CI, 30%–43%; I² = 21.0%; Supplementary Figure 9); local recurrence, 14% (95% CI, 10%–19%; I² = 10.1%; Supplementary Figure 10); and distant metastasis, 31% (95% CI, 25%–37%; I² = 21.9%; Supplementary Figure 11).
Graft‐Related Outcomes
3.3.3
Overall graft thrombosis rate was 19% (95% CI, 13%–26%; I² = 56.5%; Supplementary Figure 12 ); early graft thrombosis, 14% (95% CI, 9%–21%; I² = 408%; Supplementary Figure 13 ), and late graft thrombosis, 7% (95% CI, 4%–14%; I² = 41.4%; Supplementary Figure 14 ).
The pooled proportion of graft patency was 81% at 1 year (95% CI, 74%–87%; I² = 21.1%; Supplementary Figure 15), 72% at 2 years (95% CI, 66%–77%; I² = 1.1%; Supplementary Figure 16), 72% at 3 years (95% CI, 65%–79%; I² = 26.2%; Supplementary Figure 17), and 69% at 5 years (95% CI, 58%–78%; I² = 52.7%; Supplementary Figure 18). We observed only one reperfusion injury and four compartment syndrome events in the entire cohort.
Wound‐Related Outcomes
3.3.4
Wound complications rate was 29% (95% CI, 19%–40%; I² = 66.6%; Supplementary Figure 19); and wound infection was 22% (95% CI, 15%–30%; I² = 37.5%; Supplementary Figure 20).
Sensitivity Analysis
3.4
For 1‐year OS, the exclusion of the study by Ghert et al. eliminated heterogeneity and increased the pooled proportion to 90%. The removal of the study by Kang et al. significantly reduced heterogeneity for DSF at years 1, 2, and 3, resulting in a corresponding increase in the pooled proportions at each time point. For early and late thrombosis events, the exclusion of the studies by Shah et al. and Homsy et al., respectively, eliminated heterogeneity. For the remaining outcomes, the exclusion of any single study did not significantly alter heterogeneity. The sensitivity analyses are detailed in Supplementary Figures S21‐S36.
Subgroup Analyses
3.5
Supplementary Figure S37 shows amputation rates by cause, including 16/186 amputations due to vascular complications, 4/34 due to postoperative infection, and 12/129 due to local recurrence, with no significant differences between subgroups (χ² = 0.11, p = 0.95). Supplementary Figure S38 shows limb salvage rates by follow‐up duration, with pooled limb salvage of 0.90 in short‐term (118/131), 0.89 in mid‐term (203/220), and 0.93 in long‐term studies (100/106), with no significant differences between subgroups (χ² = 1.35, p = 0.509).
Supplementary Figure S39 shows limb salvage rates stratified by graft type. Most patients underwent reconstruction with autologous grafts, which showed consistently high limb salvage rates. Prosthetic and mixed graft subgroups were small and demonstrated wider confidence intervals. No statistically significant differences were observed between graft‐type subgroups (χ² = 5.54, p = 0.698). This subgroup analysis differed slightly from the primary analysis because the logit transformation did not converge due to the number of subgroups and the limited number of studies within each subgroup; therefore, we used the Freeman–Tukey double arcsine transformation for this analysis. Supplementary Figure S40 shows limb salvage rates stratified by reconstruction type. Combined arterial and venous reconstruction demonstrated numerically higher limb salvage rates compared with arterial‐only and venous‐only reconstruction; however, subgroup differences were not statistically significant (χ² = 1.59, p = 0.45).
Risk of Bias Assessment
3.6
All included non‐randomized studies were assessed using the ROBINS‐I V2 tool. Across the cohort, the overall risk of bias was considered serious, primarily due to the presence of uncontrolled confounding. Other domains, such as classification of interventions, deviations from intended interventions, and missing data, were consistently rated as low risk. Most studies exhibited moderate risk for selection of participants and measurement of outcomes, reflecting retrospective designs and subjective outcome assessments. The risk of bias assessment is detailed in Figure 4.
Risk of bias assessment.
Discussion
4
In this systematic review and single‐arm meta‐analysis of 31 studies including 520 patients with extremity soft tissue sarcomas undergoing limb‐sparing surgery with vascular reconstruction, we found a limb salvage rate of 89% and an amputation rate of 11%. Pooled overall survival was 89% at 1 year, 78% at 2 years, 70% at 3 years, and 60% at 5 years, while disease‐free survival was 74%, 56%, 42%, and 55% at the same time points, respectively. Disease‐related mortality occurred in 36% of patients, with local recurrence in 14% and distant metastasis in 31%. The overall graft thrombosis rate was 19%, with early and late thrombosis rates of 14% and 8%. Graft patency was 81% at 1 year, 72% at 2 and 3 years, and 69% at 5 years. Wound complications and wound infections occurred in 29% and 22% of patients, respectively.
The high limb salvage rate observed in our study is consistent with rates reported in previous series of limb‐sparing resections [42]. This suggests that the necessity for vascular reconstruction does not substantially compromise the ability to preserve the limb when compared to less complex resections. The observed amputation rate of 11% in this meta‐analysis, although relatively low, underscores the ongoing challenges of limb‐sparing surgery with vascular reconstruction in patients with extremity soft tissue sarcomas. Amputations were primarily related to vascular complications, local tumor recurrence, and postoperative infections. Achieving radical excision is often difficult due to anatomical constraints, tumor size, and proximity to major neurovascular structures, which can increase the risk of inadequate margins and local recurrence, ultimately leading to limb loss. Notably, soft tissue sarcomas have a recognized propensity for local recurrence when margins are insufficient, further complicating limb preservation efforts [43].
Overall survival declined from 89% at 1 year to 60% at 5 years, while disease‐free survival decreased from 74% to 55%. This substantial decrease over time underscores the continued impact of early recurrence and distant relapse on long‐term outcomes in extremity soft tissue sarcomas, as also demonstrated by a large, prospective, multicenter study, which demonstrated that recurrence and metastatic spread are the main factors limiting long‐term survival in patients with extremity soft tissue sarcomas [43].
The significant rates of local recurrence (14%) and distant metastasis (31%) in our cohort underscore the aggressive behavior of extremity soft tissue sarcomas and the persistent challenge of achieving durable oncologic control. While recent studies have suggested that routine imaging may have limited utility in detecting local recurrence, chest imaging remains essential for the identification of pulmonary metastases, especially in high‐grade sarcomas. This approach aligns with evidence supporting the role of lung surveillance as a critical component in managing these patients [44].
Although most vascular reconstructions remain patent in the first year after surgery, there is a gradual decline in patency over time, largely attributable to both early and late thrombotic events. Vigilant postoperative monitoring and long‐term antithrombotic strategies can minimize graft failure and its associated complications. We observed only one reperfusion injury and four compartment syndrome events in the entire cohort, indicating that these serious complications were rare. Additionally, wound complications occurred in 29% of patients, with wound infections affecting 22% of the patients. Notably, neoadjuvant radiotherapy is a recognized risk factor for wound infection, as preoperative radiation can impair tissue healing [45]. A considerable proportion of patients in our sample underwent this treatment modality, which may have contributed to the observed rates of wound morbidity.
This study has several major limitations. First, the included studies span a wide time period, during which significant advances in surgical technique, perioperative management, and oncologic therapies likely occurred, introducing substantial temporal and methodological heterogeneity. There was marked inconsistency in the use and reporting of adjuvant and neoadjuvant treatments, with little to no information on specific drugs, regimens, or dosages, making it impossible to analyze the impact of these therapies. Critically, data on surgical margin status were frequently absent or incompletely reported, precluding any meaningful pooled analysis or robust assessment of the fundamental oncologic principle of margin negativity, which remains one of the strongest predictors of local recurrence and long‐term survival in sarcoma care.
Follow‐up duration was highly variable both within and between studies, further complicating interpretation of survival and recurrence outcomes. Several pooled outcomes showed substantial heterogeneity despite the use of random‐effects models and sensitivity and subgroup analyses. This residual variability likely reflects intrinsic clinical and methodological differences among studies. Therefore, pooled estimates should be interpreted as indicative of a range of effects, and conclusions should focus on overall consistency and feasibility rather than precise effect sizes. Importantly, high I² values reduce confidence in the precision of individual pooled estimates and indicate that true effects may differ substantially across clinical settings. Most included studies were retrospective, single‐center series subject to selection and reporting biases. The lack of standardized definitions for complications, recurrence, and other key outcomes also contributed to inconsistent data capture. Finally, the risk of publication bias remains high in this literature, and conventional tools for assessing it are unreliable in single‐arm meta‐analyses. Together, these limitations significantly restrict the strength and generalizability of our conclusions, highlighting the urgent need for high‐quality, prospective multicenter research with comprehensive and standardized data collection.
Conclusion
5
In conclusion, limb‐sparing surgery with vascular reconstruction appears to be a feasible and reasonable option for selected patients with extremity soft tissue sarcomas involving major vessels. This strategy may achieve high limb salvage and encouraging long‐term survival rates, while maintaining oncologic rigor. Although perioperative morbidity remains a concern, outcomes can be optimized through careful patient selection, surgical expertise, and multidisciplinary management. Moving forward, high‐quality, multicenter prospective studies are needed to address the limitations of the current evidence base, with standardized reporting of data, follow‐up, and outcomes. In particular, future studies should consistently report surgical margin status, neoadjuvant and adjuvant treatment regimens, and patient‐reported quality‐of‐life outcomes, and should apply uniform definitions for complications, recurrence, and survival to enable robust comparisons and strengthen clinical guidance for this challenging population.
Conflicts of Interest
The authors declare no conflicts of interest.
Synopsis
This systematic review and single‐arm meta‐analysis evaluated outcomes of limb sparing surgery with vascular reconstruction in patients with extremity soft tissue sarcomas involving major vessels. Across 31 studies and 520 patients, limb salvage was achieved in 89%, with acceptable long‐term survival and manageable morbidity. The findings support vascular reconstruction as a safe and effective strategy to preserve limb function without compromising oncologic outcomes.
Supporting information
Supplementary Table S1. Preferred Reporting Items for Systematic Reviews and Meta‐Analysis (PRISMA) checklist. Supplementary Table S2. List of excluded studies at the full‐text screening stage and the reasons for exclusion.
The reference list from the paper itself. Each links out to its DOI / PubMed record.
- 1A. Angelini , M. Piazza , E. Pagliarini , G. Trovarelli , A. Spertino , and P. Ruggieri , “The Orthopedic‐Vascular Multidisciplinary Approach Improves Patient Safety in Surgery for Musculoskeletal Tumors: A Large‐Volume Center Experience,” Journal of Personalized Medicine 11, no. 6 (2021): 462.34073954 10.3390/jpm 11060462 PMC 8225121 · doi ↗ · pubmed ↗
- 2T. Akgül , İ. Cem Sormaz , M. Aksoy , A. Uçar , H. Özger , and L. Eralp , “Results and Functional Outcomes of en‐Bloc Resection and Vascular Reconstruction in Extremity Musculoskeletal Tumors,” Acta Orthopaedica et Traumatologica Turcica 52, no. 6 (2018): 409–414.30274704 10.1016/j.aott.2018.08.004PMC 6318543 · doi ↗ · pubmed ↗
- 3A. Mahendra , Y. Gortzak , P. C. Ferguson , B. M. Deheshi , T. F. Lindsay , and J. S. Wunder Management of Vascular Involvement in Extremity Soft Tissue Sarcoma. In: P. U. Tunn , editor. Treatment of Bone and Soft Tissue Sarcomas [Internet]. Berlin, Heidelberg: Springer; 2009 [cited 2025 June 23]. p. 285–99. Available from: 10.1007/978-3-540-77960-5_18.19230547 · doi ↗ · pubmed ↗
- 4M. Arikawa , S. Akazawa , D. Kageyama , et al., “Nonreversed Great Saphenous Vein Grafts for Vascular Reconstruction After Resection of Lower‐Limb Sarcoma,” Journal of Plastic, Reconstructive & Aesthetic Surgery 97 (2024): 65–70.10.1016/j.bjps.2024.07.06939146907 · doi ↗ · pubmed ↗
- 5D. Park , S. Cho , A. Han , et al., “Outcomes After Arterial or Venous Reconstructions in Limb Salvage Surgery for Extremity Soft Tissue Sarcoma,” Journal of Korean Medical Science 33, no. 40 (2018): e 265.30275808 10.3346/jkms.2018.33.e 265PMC 6159105 · doi ↗ · pubmed ↗
- 6M. A. Mlees , A. H. Elbarbary , and E. M. Sallam , “Vascular Reconstruction Using Autologous vs Synthetic Graft for Patients With Extremity Soft‐Tissue Sarcoma Involving the Major Vessels,” Journal of Surgical Oncology 121, no. 2 (2020): 272–278.31749182 10.1002/jso.25775 · doi ↗ · pubmed ↗
- 7S. Tsukushi , Y. Nishida , H. Sugiura , H. Nakashima , and N. Ishiguro , “Results of Limb‐Salvage Surgery With Vascular Reconstruction for Soft Tissue Sarcoma in the Lower Extremity: Comparison Between Only Arterial and Arterovenous Reconstruction,” Journal of Surgical Oncology 97, no. 3 (2008): 216–220.18161869 10.1002/jso.20945 · doi ↗ · pubmed ↗
- 8J. Kang , K. W. Choi , A. Han , et al., “Venous Reconstruction in Extremity Soft Tissue Sarcoma is Not Essential,” Vascular and Endovascular Surgery 57, no. 4 (2023): 365–372.36592476 10.1177/15385744221150737 · doi ↗ · pubmed ↗