Association between left ventricular longitudinal function and left atrial strain in left ventricular dysfunction
Björn Östenson, Elsa Bergström, Katarina Steding-Ehrenborg, Ashwin Venkateshvaran, Marcus Carlsson, Håkan Arheden, Ellen Ostenfeld

TL;DR
This study finds that left atrial strain is closely linked to left ventricular longitudinal function in patients with heart issues, suggesting it may not be an independent marker of heart health.
Contribution
The study uses CMR feature-tracking to show that left atrial strain is largely determined by left ventricular longitudinal function in patients with LV dysfunction.
Findings
LA-GLS was significantly lower in patients with LV dysfunction compared to healthy controls.
LV-GLS and LA-GLS showed a moderate association with a coefficient of determination of 0.40.
LA function may not be an independent marker of cardiac function in certain patient groups.
Abstract
Left ventricular (LV) longitudinal function is a prognostic marker of hospitalization and mortality in LV dysfunction. Recently, left atrial (LA) reservoir and conduit strain have also been presented as independent prognostic markers. However, the atria and ventricles are coupled in the fibrous atrioventricular plane (LA–LV coupling). The degree to which the LA strain is affected, or even determined, by the LV longitudinal function in LV dysfunction has been explored by echocardiography, but not by cardiac magnetic resonance imaging (CMR). Therefore, we aimed to quantify the association between LV longitudinal ventricular function and LA strain using CMR feature-tracking. Three hundred and forty-two patients with LV dysfunction (including heart failure with reduced ejection fraction (HFrEF), candidates for cardiac resynchronization therapy (CRT) implantation, and ischaemic heart…
Genes, proteins, chemicals, diseases, species, mutations and cell lines named across the full text — each resolved to its canonical identifier and authoritative record.
Click any figure to enlarge with its caption.
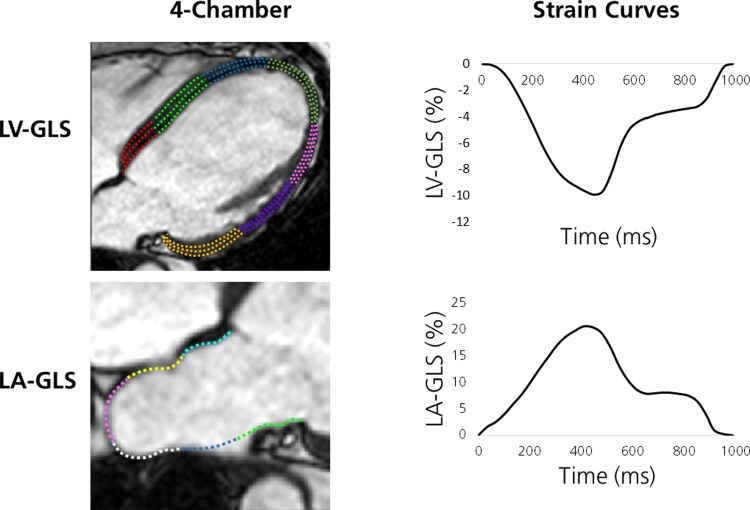 Figure 1
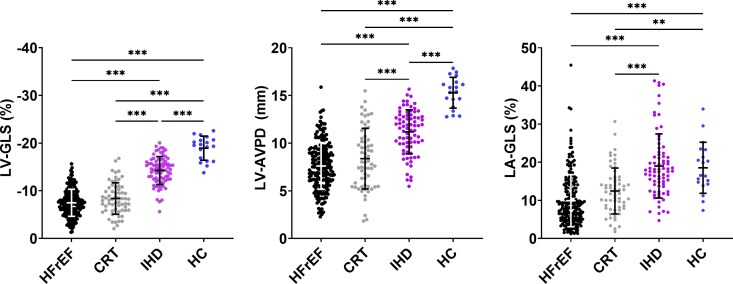 Figure 2
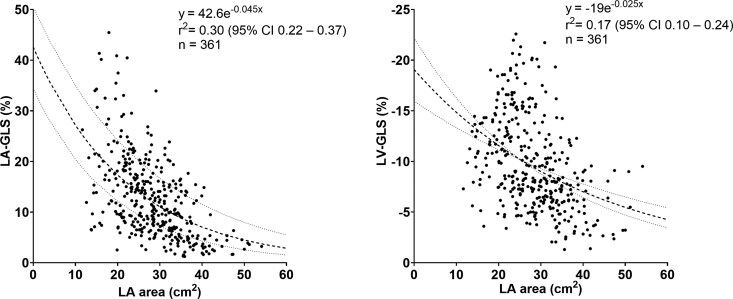 Figure 3
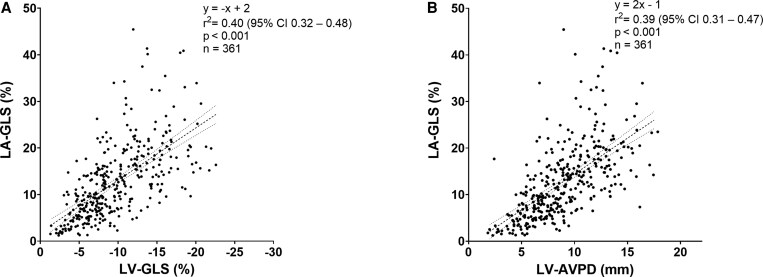 Figure 4
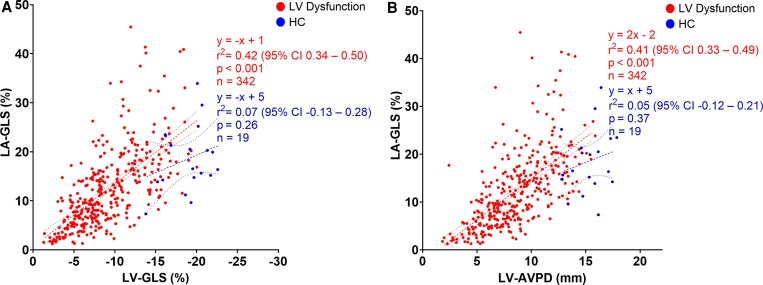 Figure 5
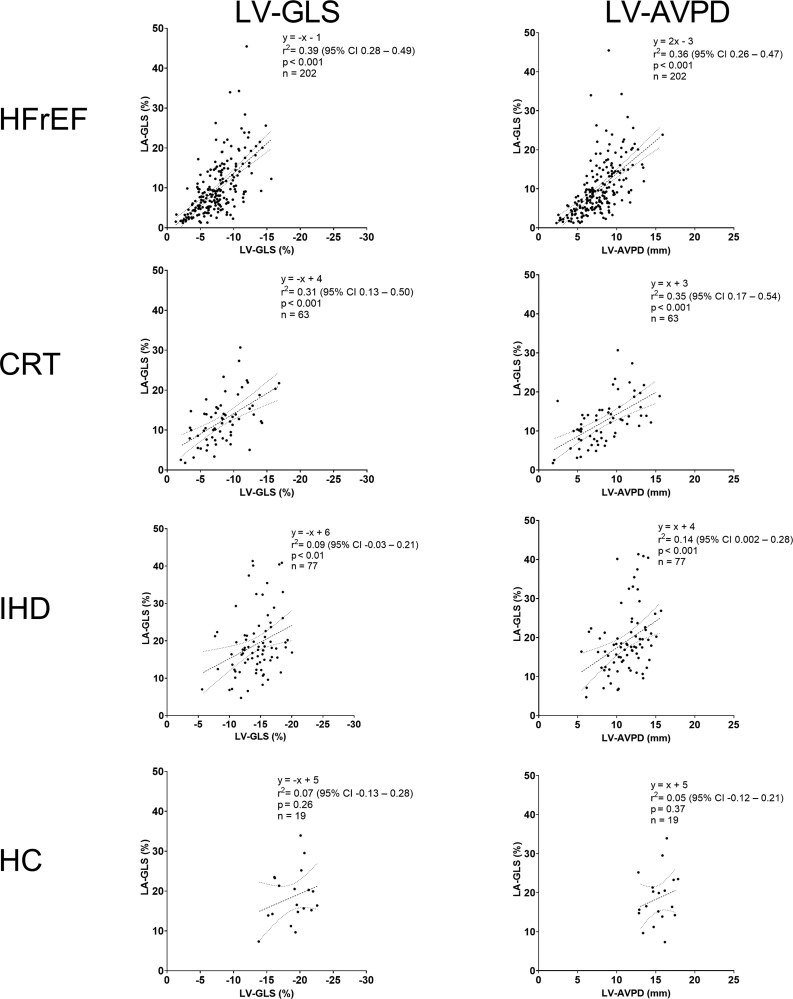 Figure 6
| HFrEF | CRT | IHD | All LV dysfunction | HC | |
|---|---|---|---|---|---|
| Female | 40 (20) | 18 (29) | 9 (12) | 67 (20)* | 8 (42) |
| Age (years) | 60 ± 12 | 67 ± 9 | 59 ± 10 | 61 ± 12 | 63 ± 11 |
| Height (cm) | 175 ± 9 | 174 ± 9 | 176 ± 7 | 175 ± 9 | 173 ± 9 |
| Weight (kg) | 83 ± 16 | 85 ± 18 | 82 ± 11 | 83 ± 15* | 75 ± 14 |
| BMI (kg/m2) | 26.8 ± 4.3 | 28.0 ± 5.2 | 26.7 ± 3.3 | 27.0 ± 4.3* | 25.0 ± 3.2 |
| BSA (m2) | 1.98 ± 0.21 | 2.00 ± 0.22 | 1.98 ± 0.15 | 1.98 ± 0.20* | 1.88 ± 0.21 |
| HR (beats/min) | 74 ± 16 | 68 ± 13 | 62 ± 10 | 70 ± 15*** | 62 ± 7 |
| Morbidity | |||||
| History of IHD | 118 (58) | 32 (51) | 77 (100) | 227 (66) | n/a |
| HTN | 52 (29)a | 40 (64) | 22 (29) | 114 (36)b | n/a |
| DM | 41 (23)c | 9 (14) | 8 (10) | 58 (18)d | n/a |
| HFrEF | CRT | IHD | All LV dysfunction | HC | |
|---|---|---|---|---|---|
| Left ventricle | |||||
| LVEDV (ml) | 298 ± 92 | 327 ± 115 | 190 ± 43 | 279 ± 101*** | 161 ± 38 |
| LVESV (ml) | 224 ± 87 | 248 ± 110 | 93 ± 35 | 199 ±101*** | 65 ± 21 |
| LVEF (%) | 26 ± 8 | 26 ± 8 | 52 ± 10 | 32 ± 14*** | 60 ± 5 |
| LV-GLS (%) | −7 ± 3 | −8 ± 3 | −14 ± 3 | −9 ± 4*** | −19 ± 3 |
| LV-AVPD (mm) | 8 ± 2 | 8 ± 3 | 11 ± 2 | 9 ± 3*** | 15 ± 2 |
| Left atrium | |||||
| LA area (cm2) | 31 ± 8 | 28 ± 7 | 23 ± 5 | 28 ± 8* | 26 ± 3 |
| LA-GLS (%) | 10 ± 7 | 12 ± 6 | 19 ± 8 | 12 ± 8*** | 19 ± 7 |
| Dependent variable: LA-GLS | ||||
|---|---|---|---|---|
| Univariable | Multivariable | |||
| β |
| β |
| |
| LVEDV | −0.03 |
| 0.003 | .72 |
| LV-GLS | −1.12 |
| −0.07 | .84 |
| LVEF | 0.30 |
| 0.32 | . |
| LA area | −0.58 |
| −0.09 | .47 |
| HR | −0.18 |
| 0.07 | .90 |
| SBP | 0.08 | . | 0.08 | .05 |
| Age | −0.03 | .49 | ||
| Sex | 2.63 | . | 2.27 | .14 |
| BMI | −0.004 | .97 | ||
| IHD | 1.26 | . | −3.67 | . |
| HTN | 0.17 | .85 | ||
| DM | −1.71 | . | −1.12 | .17 |
- —Swedish Research Council10.13039/501100004359
- —Swedish Society of Medicine10.13039/501100007687
- —Swedish Heart and Lung Foundation10.13039/501100003793
- —Crafoord Foundation10.13039/501100003173
- —Southern Healthcare Region of Sweden
- —Lund University Faculty of Medicine
- —Skåne University Hospital Foundations10.13039/501100011077
Peer Reviews
No public reviews on file for this paper yet. If you reviewed it on a platform where reviews are public (OpenReview, ICLR, NeurIPS, ICML), you can paste yours below so the community can read it here.
Videos
No videos yet. Explain this paper in a talk, walkthrough, or lecture? Add one.
Taxonomy
TopicsCardiovascular Function and Risk Factors · Cardiac pacing and defibrillation studies · Cardiac Imaging and Diagnostics
Introduction
Patients with heart failure (HF) with and without preserved ejection fraction (EF) have an increased risk of hospitalization and death.^1,2^ Left ventricular (LV) EF is routinely assessed using multiple imaging modalities and is a ubiquitous measure of ventricular dysfunction for clinical decision making and prognostication.^3^ Recently, atrial strain derived from cardiac magnetic resonance (CMR) has been proposed as a novel marker of outcome.^4,5^ However, the atria are physically connected to the ventricles by the fibrous atrioventricular plane and are therefore affected by ventricular longitudinal function.^6,7^ This physiological interaction between the left atrium (LA) and LV, often referred to as left atrioventricular coupling (LA–LV coupling),^8^ suggests an interdependence between the atria and ventricles. The association between LA and LV function has been explored using speckle-tracking echocardiography (STE), supporting moderate-to-strong LA–LV coupling,^9–11^ varying by phenotype. To the best of our knowledge, the degree to which LA function is affected by LV longitudinal function in patients with LV dysfunction has not been explored by CMR feature-tracking.
The aim of this study was therefore to quantify the association between LV and LA longitudinal function using CMR feature-tracking, in patients with different degrees of LV dysfunction, compared with healthy controls (HC).
Methods
All study participants provided signed informed consent to participate in research, and the original studies were approved by the regional ethics committee in Lund, Sweden (Dnr 741/2004, Dnr 2010/380, Dnr 2011/668) and followed the Declaration of Helsinki. This retrospective, exploratory study included CMR examinations previously used in research,^12–15^ and complies with STROBE guidelines for reporting observational studies.^16^
Study population
The study population was divided into the following groups: patients with HF with reduced EF (HFrEF), candidates for cardiac resynchronization therapy (CRT) implantation, ischaemic heart disease (IHD), and HC. Adult (≥18 years of age) patients with LV dysfunction who underwent CMR examination between 2003 and 2017 were included in the current study. Patients with HFrEF had a diagnosis of HF and LVEF ≤40%. Patients indicated for CRT fulfilled the class 1 recommendation according to guidelines.^3^ IHD was defined as first-time ST-elevation myocardial infarction (STEMI) with successful reperfusion after percutaneous coronary intervention and underwent CMR examination 6 months after intervention. HC with no previous known cardiovascular disease, normal blood pressure, and without ECG abnormalities were included as controls. Participants were excluded in the case of poor image quality, significant arrhythmia, including atrial fibrillation, or if the LA was not visible in a 4ch view. Complete inclusion and exclusion criteria were described in the respective study protocols^12–15^ (Appendix 1).
Cardiac magnetic resonance imaging
CMR was performed on Philips Intera 1.5 T, Philips Achieva 3.0 T (Philips Medical System, Best, The Netherlands), or Siemens Aera 1.5 T scanner (Siemens Healthineers, Forchheim, Germany). Standard balanced steady-state free precession (bSSFP) cine images in short- and long-axis planes were acquired during end-expiratory breath-hold. Typical image parameters were as follows: temporal resolution: 30 ms; in-plane resolution: 1.5 × 1.5 mm^2^; slice thickness: 8 mm; slice gap: 0 mm; flip angle: 64°; echo time: 1.2 ms.
Image analysis
Image analysis was performed using the freely available software Segment v4.0 R12067 (Medviso AB, Lund, Sweden, http://segment.heiberg.se).^17^ LV end-diastolic volume, end-systolic volume, and LV mass were calculated by delineating the endocardium and epicardium in short-axis images at end diastole and end systole. LV atrioventricular plane displacement (LV-AVPD) was measured as previously described.^18,19^ In brief, the atrioventricular plane was defined by eight input points that were manually marked in the 2-, 3-, and 4-chamber long-axis views in end diastole. An automatic algorithm tracked the input points through the cardiac cycle, and the input points were thereafter manually adjusted if needed. The mean perpendicular distance of the atrioventricular plane towards the apex in the three long-axis views is reported as LV-AVPD.
Feature-tracking myocardial strain was used to assess GLS in the LV and LA. LV-GLS was measured by end-diastolic delineation of the endocardium and epicardium in the 2-, 3-, and 4-chamber bSSFP cine images. LA-GLS was measured by delineation of the LA endocardial border in the 4-chamber view at ventricular end diastole. Atrial appendages and pulmonary veins were excluded from delineation. Delineations were automatically propagated by the algorithm throughout the cardiac cycle (Figure 1). In case of inadequate tracking, a new propagation was repeated after readjustments of the end-diastolic delineation. LA size was determined as the largest LA area from the propagated delineations.
Example of left ventricular global longitudinal strain (LV-GLS) and left atrial GLS (LA-GLS) analysis. Top row: cardiac magnetic resonance (CMR) 4-chamber view with myocardial strain delineations superimposed (left) and LV-GLS curve during one cardiac cycle (right). Bottom row: CMR 4-chamber view with LA endocardial delineation superimposed (left) and LA-GLS curve during one cardiac cycle (right). Note that the two strain curves partly mirror each other
Statistical analysis
Statistical analyses were conducted using the software IBM SPSS version 25 (SPS inc., Chicago, Illinois, USA) and GraphPad Prism v10.0.2 for Windows (GraphPad Software, Boston, Massachusetts, USA). Continuous variables are expressed as means ± standard deviation or median and interquartile range according to normal distribution. Normal distribution was assessed graphically from histograms and Q–Q plots. Discrete variables are expressed as frequencies and proportions in percentages. Categorical data were compared using the Chi-square test. Patients with LV dysfunction (HFrEF, CRT, and IHD) were compared with HC using Student’s t-test for independent samples for continuous data. The four different study groups (HFrEF, CRT, IHD, and HC) were compared with each other using one-way ANOVA with post hoc Tukey’s HSD test for single dependent variables. Coefficient of determination (r^2^) analysis was conducted to analyse associations between LV longitudinal function (LV-GLS or LV-AVPD) and LA-GLS. Simple linear regression with interaction effect was used to compare group interaction regarding associations between LV longitudinal function and LA-GLS. Non-linear regression was conducted to investigate the relationship between LA area and LA-GLS, and between LA area and LV-GLS, using an exponential decay model. Univariable and multivariable linear regression analyses of LA-GLS were conducted to determine the independent effects of LV longitudinal function and confounders. Independent variables in the univariable linear regression analysis with a P value <.25 were included in the multivariable analysis. Intra- and inter-observer variability of LV-GLS and LA-GLS were assessed using Bland–Altman analysis and intraclass correlation coefficients in ten subjects. A two-tailed P-value of <.05 was defined as statistically significant.
Results
Three hundred and sixty-one study participants (HFrEF, CRT, IHD, and HC) were included in the final data analysis, as eight were excluded due to poor image quality (n = 3), arrhythmia (n = 4), and LA not visible in 4ch view (n = 1). Table 1 displays the characteristics of the study participants and Supplementary Table S1 displays available data on medication in the study participants. The patient group included a larger proportion of male participants and had a higher BMI and heart rate than HC. Patients had typical comorbidities and medication for a HF population.
Left ventricular size and function
Left ventricular volumes were larger in patients with LV dysfunction (HFrEF, CRT, and IHD) than in HC (Table 2). Patients with LV dysfunction had impaired LV-GLS and LV-AVPD compared with HC (Table 2, Figure 2).
*Left ventricular longitudinal and atrial function. Left: left ventricular global longitudinal strain (LV-GLS); Middle: left ventricular atrioventricular plane displacement (LV-AVPD). Right: left atrial global longitudinal strain (LA-GLS). Error bars denote mean ± SD. CRT: candidates for cardiac resynchronization therapy; HC: healthy controls; HFrEF: heart failure with reduced ejection fraction; IHD: ischaemic heart disease. *P < .05, **P < .01, **P < .001
LV-GLS differed among the study groups, except for HFrEF vs CRT (P = .15). Similarly, LV-AVPD differed among groups except for HFrEF vs CRT (P = .16) (Table 2, Figure 2).
Left atrial size and function
Patients with LV dysfunction had lower LA-GLS compared with HC (Table 2, Figure 2). LA-GLS differed among the four study groups, except for HFrEF vs CRT (P = .06) and IHD vs HC (P = .99) (Table 2, Figure 2).
Patients with LV dysfunction had a larger LA area compared with HC (Table 2, Figure 2). Non-linear regressions of the relationships between LA area and LA-GLS, and between LA area and LV-GLS are depicted in Figure 3. The r^2^ value of the non-linear relationship between LA area and LA-GLS was 0.30 (95% CI 0.22–0.37), and the r^2^ value between LA area and LV-GLS was 0.17 (95% CI 0.10–0.24), indicating that LA area explains 30% of the variance in LA-GLS and 17% of the variance in LV-GLS according to the exponential decay models.
Relationship between left atrial (LA) area and LA global longitudinal strain (GLS) to the left, and between LA area and left ventricular (LV) GLS to the right, in the whole study population. The regression lines with 95% confidence bands are indicated with dashed lines
Association between ventricular and atrial function
A linear association between LV-GLS and LA-GLS, and LV-AVPD and LA-GLS in the whole study cohort is shown in Figure 4. LV longitudinal function determined about 40% of the variance in LA-GLS in the whole study population. Univariable and multivariable analyses in the whole study population showed that LVEF and IHD are independently associated with LA-GLS when adjusting for confounders (P < .05, Table 3).
Relationship between left ventricular and atrial function in the whole study cohort. A: correlation between left ventricular global longitudinal strain (LV-GLS) and left atrial GLS (LA-GLS). B: correlation between LV atrioventricular plane displacement (LV-AVPD) and LA-GLS). The regression lines with 95% confidence bands are indicated with dashed lines
When comparing patients with LV dysfunction to HC, 42% (95% CI 34%—50%) of the variance in LA-GLS was determined by LV-GLS in patients with LV dysfunction, with an inconclusive association (P = .26) in HC (Figure 5). Regarding LV-AVPD, there was a similar association to LA-GLS in patients with LV dysfunction (r^2^ = 0.41, 95% CI 0.33–0.49), yet an inconclusive association in HC (P = .37) (Figure 5). Simple linear regression with group interaction was not statistically significant for LV-GLS (P = .33) nor LV-AVPD (P = .36), indicating that the association between LV longitudinal function and LA-GLS did not conclusively differ between patients with LV dysfunction and HC.
Relationship between left ventricular and atrial function in patients with left ventricular (LV) dysfunction (HFrEF, CRT, and IHD; red) and healthy controls (HC; blue) separated. A: correlation between LV global longitudinal strain (LV-GLS) and left atrial GLS (LA-GLS). B: correlation between LV atrioventricular plane displacement (LV-AVPD) and LA-GLS). The regression lines with 95% confidence bands are indicated with dashed lines
On a subgroup level, comparing the four study groups with each other, LA-GLS was determined by both LV-GLS and LV-AVPD in HFrEF, CRT, and IHD, but not for HC (Figure 6). Simple linear regression with group interaction was not statistically significant for LV-GLS (P = .08) nor LV-AVPD (P = .26), indicating that the association between LV longitudinal function and LA-GLS did not conclusively differ between groups. Additionally, subgroup analysis was done dividing study participants into the following groups: LVEF < median vs LVEF ≥ median, hypertension vs normotension, and diabetes mellitus vs non-diabetes mellitus (Supplementary Figure S1). Simple linear regression with group interaction was statistically significant in the LVEF < median vs LVEF ≥ median analysis for LV-GLS (P = .016), indicating that the association between LV-GLS and LA-GLS is dependent on LVEF. There was a stronger relationship between LV-GLS and LA-GLS in the group with LVEF < median (r^2^ = 0.29, 95% CI 0.18–0.40) compared with the group with LVEF ≥ median (r^2^ = 0.18, 95% CI 0.08–0.28).
Association between left ventricular global longitudinal strain (LV-GLS) and left atrial GLS (LA-GLS) (left column) and left ventricular atrioventricular plane displacement (LV-AVPD) and LA-GLS (right column) in study groups. The regression lines are indicated with dashed lines. CRT: candidates for cardiac resynchronization therapy; HC: healthy controls; HFrEF: heart failure with reduced ejection fraction; IHD: ischaemic heart disease
Intra- and inter-observer variability
Intra- and inter-observer analyses of LV-GLS and LA-GLS showed excellent reliability in measurements with ICC >0.96 for the measurements. Absolute biases for intra-observer variability were ≤1% and <4% for LV-GLS and LA-GLS, respectively. Inter-observer variability was <8% for LV-GLS and <14% for LA-GLS (Supplementary Table S2, Supplementary Figures S2 and S3).
Discussion
In this large, heterogeneous, real-world population comprising HC and patients presenting with varying grades of LV dysfunction, LA function was to a large extent determined by LV longitudinal function. In the patient group alone, just above 40% of LA function was determined by LV longitudinal function, with large variations among subgroups. In HC, LA function was not significantly associated with LV longitudinal function. LA size, however, for the whole study population, can explain 30% of LA function. This CMR feature-tracking study demonstrates LA–LV coupling in a large cohort of patients with varying degrees of LV dysfunction and HC. Hence, LA function may not offer additional diagnostic or prognostic value to LV longitudinal function for certain patient groups when assessed in isolation.
Clinical significance
LVEF is routinely utilized as a measure of cardiac function during clinical decision-making.^20^ However, due to high variability, modest reproducibility, and limited ability to assess preclinical dysfunction, more sophisticated measures of cardiac function are necessary. LA-GLS has been shown in isolation to be a prognostic marker for mortality and hospitalization,^4,5^ albeit using a simplified method of LA longitudinal function. The results from this study using the more detailed method of feature-tracking strain indicate that the association between LV longitudinal function, expressed as LV-GLS and LV-AVPD, and LA-GLS is not the same in all patient populations. Even among the patients with LV dysfunction in the present study, the explanatory value between LV-GLS or LV-AVPD and LA-GLS ranged from 9% to 39%. This suggests that LA-GLS is partly driven by LV longitudinal function, but to varying degrees in different patient populations depending on aetiology and LV function.
Patients with LV dysfunction had impaired LV volume and function compared with HC. However, when comparing the three subgroups of patients with LV dysfunction, IHD was less affected in LV volume and function than HFrEF and CRT, with less dilated LVEDV and better LVEF and LV-GLS, albeit with a mildly reduced LV systolic function justifying representation in the LV dysfunction cohort. Furthermore, IHD had preserved LA function with LA-GLS similar to HC (P = .99), in contrast to HFrEF and CRT who had impaired LA function with decreased LA-GLS compared with HC. Previous studies on patients with STEMI have reported preserved LA function at follow-up when atrial remodelling is absent, but diminished LA function in the case of atrial enlargement.^21,22^ It can be hypothesized from this observation that LA function is preserved for longer and does not decrease in parallel as LV function deteriorates in IHD. The point where LA function starts to decrease may be of important prognostic value, and it could be speculated that the mechanism of LA function impairment may be partially independent of LV function and differ between patient groups. For instance, the STE-derived LA strain has been shown to be impaired before LA and LV remodelling, and LV dysfunction in patients with hypertension.^23^
In general, stronger associations between LV and LA function were observed within larger study groups, encompassing both the entire study population and all patients with LV dysfunction. When considering all study participants irrespective of LV function, the explanatory value between LV-GLS or LV-AVPD and LA-GLS ranged from 39% to 40%. Conversely, HC did not demonstrate a linear relationship between LV longitudinal function (neither GLS nor AVPD) and LA-GLS. This discrepant observation between patients with LV dysfunction and HC may be explained by a small variance in LV-GLS in HC. Thus, it can be speculated that when LV longitudinal function is diminished due to pathology, LA dysfunction follows, indicating a close relationship.
The statistical analysis of the study groups regarding the relationship between LV longitudinal function and LA function did not reveal significant differences, apart from a subgroup analysis of study participants with LVEF < median vs LVEF ≥ median. These results from the present study combined with findings from previous studies showing differences in LA–LV coupling across phenotypes, e.g. in hypertrophic cardiomyopathy^24^ and dilated cardiomyopathy,^25^ suggest that LV function has a relatively stronger influence on LA function, and thereby LA–LV coupling, compared with other pathological changes of the LA and LV, e.g. fibrosis and compliance.
The findings from the present CMR study are in line with previous STE studies exploring the association between LA and LV function, indicating a significant but not universal LV-driven determinant of LA strain.^9–11^ Methodologically, CMR-FT measures myocardial borders while STE tracks myocardial speckles. The methods are not interchangeable due to modest correlation and suboptimal agreement,^26^ and they have inherent differences in spatial and temporal resolution. Thus, in addition to phenotype, modality may influence the correlation between LA and LV functions.
Left ventricular longitudinal function
Length deformation in the longitudinal plane can be measured either in relative terms, such as LV-GLS, or in absolute terms as LV-AVPD. As the LA and LV have a common atrioventricular plane, it could be hypothesized that LV dysfunction with impaired LV longitudinal function would have a direct effect on LA-GLS. The results from the present study support this hypothesis, as ∼40% of the variation in LA-GLS was explained by LV-GLS and LV-AVPD in the whole cohort, and there was a positive correlation between LV-GLS or LV-AVPD and LA-GLS.
LA-GLS was to a large degree dependent on atrioventricular structural mechanics as there was an independent association with LV-GLS after adjusting for confounders. However, LA function was not fully explained by LV longitudinal function when analysing the explanatory values. The remaining explanatory variables need to be determined in future studies, but it could be suggested that atrial contractility, preload, and afterload each contribute to the variation in LA-GLS.
Cardiac loading conditions
Beta-adrenergic antagonists, calcium channel antagonists, diuretics, and medications targeting the renin-angiotensin-aldosterone system are medications known to lower pre- and afterload conditions of the heart. Unfortunately, data on medication were not available for all study participants and may have affected the results since GLS is a load-dependent measure of myocardial function.^27^ It is expected that a reduction in afterload has a positive effect on GLS and LV-AVPD, while a reduction in preload has a negative effect.^28^ On the same note, increased heart rate affects preload by reducing filling time,^29^ and that could be affecting GLS negatively.^30^ Heart rate differed amongst groups, and increased heart rate may, in part, lower LV-GLS and LA-GLS as seen in patients with LV dysfunction compared with HC.
In the current study, 33% of patients with LV dysfunction had hypertension. Hypertension is a state of increased systemic vascular resistance and thereby increased myocardial wall tension during systole. This elevated afterload can be propagated back towards the LA and hypertension therefore has a negative effect on LA-GLS,^31^ causing alterations in LA–LV coupling.^32^ Furthermore, 17% of patients had a history of diabetes and 66% of IHD, both affecting strain. Diabetes has independently been associated with reduced LA strain^33^ and IHD affects LV-GLS.^34^ Thus, medication and cardiovascular risk factors in the present study may interact, affecting preload and afterload and thereby influencing LV- and LA-GLS.
Limitations
Some limitations of this study need to be noted. The retrospective, single-centre study design introduces potential risks for selection bias, and the conclusions drawn from the findings may only be hypothesis-generating for future, prospective studies.
Data acquisition from study participants used different vendors (Philips and Siemens) with different magnetic field strengths (1.5 and 3.0 T), introducing technical heterogeneity in the data acquisition phase of the study. Thus, the comparability of images may be affected.^35^ However, it should be emphasized that the data analysis of volumes and function, including myocardial feature-tracking strain analysis, was performed in the same version of the image analysis software and intra- and inter-observer analysis showed excellent reliability in measurements.
Data on medications affecting preload and afterload, such as beta-adrenergic antagonists, renin-angiotensin-aldosterone system inhibitors, calcium channel antagonists, and diuretics, were not available for all patients. These medications may influence atrial and ventricular parameters and would ideally be included among the other confounding factors in the analyses.
Study groups differed in demographic and cardiovascular risk factors that may confound the results of this observational study, e.g. age, sex, history of hypertension, diabetes, and IHD. However, the association between LV and LA longitudinal function remained even after adjusting for confounders. The group of LV dysfunction consisted of more men compared with the HC group, echoing the known problem of unequal representation between sexes in cardiovascular research.^36^ The generalizability is limited as some cardiovascular disorders and risk factors, such as arrhythmia were not represented in the study population.
The heterogeneous group of patients with LV dysfunction (HFrEF, CRT, and IHD) consisted of three subgroups with different pathophysiology, introducing variation in the degree and duration of LV dysfunction. This may in turn affect atrial and ventricular strain to varying degrees, even in the same subgroup of patients with LV dysfunction. Future studies may implement strict group stratification to achieve homogenous groups and thereby reduce variance. Stricter group stratification may additionally enable investigation of the effect of phenotype-specific pathophysiological changes, e.g. fibrosis and compliance, on LA–LV coupling.
Study groups were unbalanced in sample sizes, ranging from n = 19 (HC) to n = 202 (HFrEF), primarily affecting statistical power and variance. Results, especially when comparing patients with LV dysfunction with HC, should consequently be interpreted with caution.
Conclusion
About 40% of LA function was most likely determined by LV longitudinal function in this large, heterogeneous patient cohort with LV dysfunction, as well as in HC. The LA–LV coupling was less pronounced within specific subgroups, yet these results suggest LA function is dependent on LV longitudinal function. Furthermore, LV and LA size, and LV longitudinal function were independently associated with LA-GLS (reservoir strain). Consequently, LA function may not be an independent marker of cardiac health for certain patient groups where a loss of LA function is a reflection of LV dysfunction.
Supplementary Material
xvag046_Supplementary_Data
The reference list from the paper itself. Each links out to its DOI / PubMed record.
- 1Jackson SL, Tong X, King RJ, Loustalot F, Hong Y, Ritchey MD. National burden of heart failure events in the United States, 2006 to 2014. Circ Heart Fail 2018;11:e 004873. 10.1161/CIRCHEARTFAILURE.117.00487330562099 PMC 6424109 · doi ↗ · pubmed ↗
- 2Carson PE, Anand IS, Win S, Rector T, Haass M, Lopez-Sendon J, et al The hospitalization burden and post-hospitalization mortality risk in heart failure with preserved ejection fraction: results from the I-PRESERVE trial (irbesartan in heart failure and preserved ejection fraction. JACC Heart Fail 2015;3:429–41. 10.1016/j.jchf.2014.12.01725982110 · doi ↗ · pubmed ↗
- 3Ponikowski P, Voors AA, Anker SD, Bueno H, Cleland JGF, Coats AJS, et al 2016 ESC Guidelines for the diagnosis and treatment of acute and chronic heart failure. Eur Heart J 2016;37:2129–200. 10.1002/ejhf.592. Epub 201627206819 · doi ↗ · pubmed ↗
- 4Leng S, Ge H, He J, Kong L, Yang Y, Yan F, et al Long-term prognostic value of cardiac MRI left atrial strain in ST-segment elevation myocardial infarction. Radiology 2020;296:299–309. 10.1148/radiol.202020017632544032 · doi ↗ · pubmed ↗
- 5Li Y, Xu Y, Tang S, Jiang X, Li W, Guo J, et al Left atrial function predicts outcome in dilated cardiomyopathy: fast long-axis strain analysis derived from MRI. Radiology 2022;302:72–81. 10.1148/radiol.202121080134698565 · doi ↗ · pubmed ↗
- 6Barbier P, Solomon SB, Schiller NB, Glantz SA. Left atrial relaxation and left ventricular systolic function determine left atrial reservoir function. Circulation 1999;100:427–36. 10.1161/01.cir.100.4.42710421605 · doi ↗ · pubmed ↗
- 7Bowman AW, Kovács SJ. Left atrial conduit volume is generated by deviation from the constant-volume state of the left heart: a combined MRI-echocardiographic study. Am J Physiol Heart Circ Physiol 2004;286:2416–24. 10.1152/ajpheart.00969.200314751859 · doi ↗ · pubmed ↗
- 8Pezel T, Venkatesh BA, De Vasconcellos HD, Kato Y, Shabani M, Xie E, et al Left atrioventricular coupling index as a prognostic marker of cardiovascular events: the MESA study. Hypertension 2021;78:661–71. 10.1161/HYPERTENSIONAHA.121.1733934225471 PMC 8363553 · doi ↗ · pubmed ↗