Prognostic significance of CUX1 genomic deletion in myelodysplastic neoplasms
Mohamed M. Khamis, Aleksandar Babic, Aref Al-Kali, Omar Alkharabsheh

TL;DR
This study finds that CUX1 genomic deletion in myelodysplastic neoplasms is strongly linked to chromosome 7 abnormalities and high-risk features but does not independently predict survival beyond existing molecular scores.
Contribution
The study clarifies that CUX1 deletion reflects chromosome 7 biology and does not add independent prognostic value beyond current molecular scoring systems in MDS.
Findings
CUX1 loss occurs in 26% of MDS patients and is nearly always associated with chromosome 7 abnormalities.
CUX1 loss correlates with higher blast counts, worse IPSS-R and IPSS-M scores, and co-occurrence with EZH2 alterations.
After adjusting for IPSS-M, CUX1 loss does not independently predict survival outcomes.
Abstract
Molecular profiling has transformed risk stratification in myelodysplastic neoplasms (MDS). However, the independent prognostic value of specific genomic alterations beyond comprehensive molecular scoring remains unclear. We investigated whether CUX1 copy-number loss (haploinsufficiency) adds prognostic value and its association with other mutations. Given its correlation with chromosome 7 abnormality, we examined its independent significance within the current MDS molecular framework. A cohort of 501 MDS patients with available CUX1 copy-number data (CNACS gene-level calls) and complete clinical follow-up was analyzed from cBioPortal. We assessed associations with clinical characteristics, co-occurring alterations, and survival. Cox proportional hazards models evaluated independence adjusting for IPSS-R and IPSS-M. CUX1 loss occurred in 129/501 patients (26%), nearly always with −…
Genes, proteins, chemicals, diseases, species, mutations and cell lines named across the full text — each resolved to its canonical identifier and authoritative record.
Click any figure to enlarge with its caption.
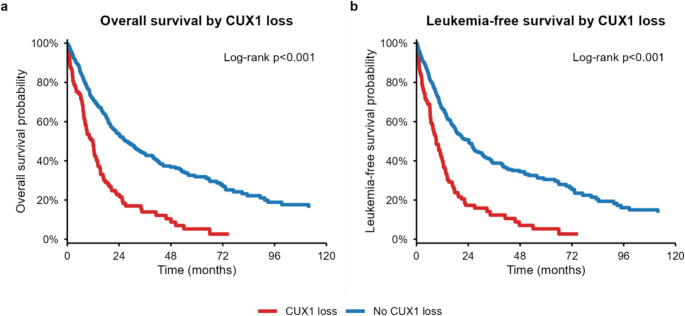 Figure 1
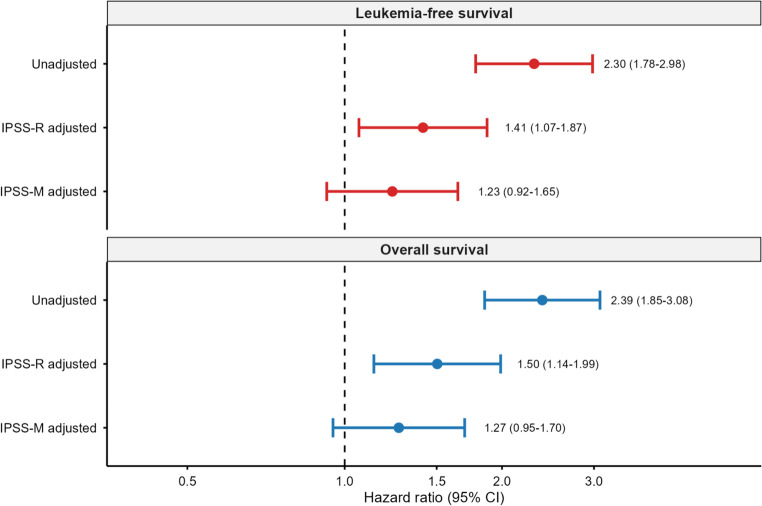 Figure 2
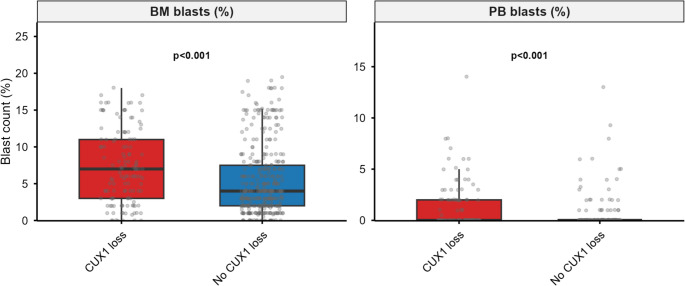 Figure 3
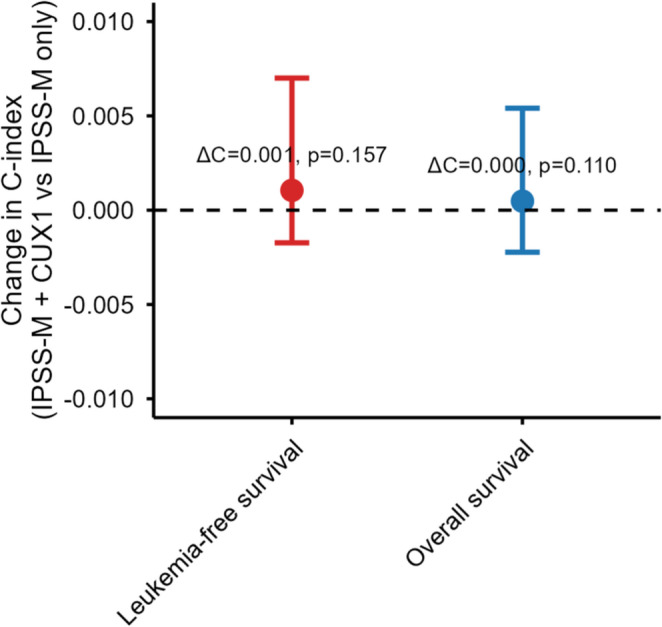 Figure 4
Peer Reviews
No public reviews on file for this paper yet. If you reviewed it on a platform where reviews are public (OpenReview, ICLR, NeurIPS, ICML), you can paste yours below so the community can read it here.
Videos
No videos yet. Explain this paper in a talk, walkthrough, or lecture? Add one.
Taxonomy
TopicsAcute Myeloid Leukemia Research · Myeloproliferative Neoplasms: Diagnosis and Treatment · Genetic factors in colorectal cancer
Introduction
Myelodysplastic neoplasms (MDS) are clonal bone marrow disorders characterized by ineffective hematopoiesis, peripheral blood cytopenias, and variable risk of progression to acute myeloid leukemia (AML) [1]. Clinical outcomes range from indolent disease requiring minimal intervention to rapidly progressive leukemia requiring intensive therapy. This heterogeneity has driven the development of prognostic scoring systems, including the Revised International Prognostic Scoring System (IPSS-R) [2], and more recently, the Molecular International Prognostic Scoring System (IPSS-M) [3]. IPSS-M incorporates somatic mutations alongside cytogenetic and clinical variables.
Risk stratification has evolved substantially. The original IPSS (1997) categorized patients into four groups with median overall survival (OS) ranging from 0.4 to 5.7 years [4]. IPSS-R (2012) introduced a five-tiered scheme with OS ranging from 0.8 to 8.8 years and refined cytopenia/blast scoring [2]. IPSS-M (2022) integrates clinical variables, cytogenetics, and 31 recurrently mutated genes, yielding six risk categories.
Within IPSS-M, − 7 and del(7q) are encoded as distinct cytogenetic variables [3]. Polycomb Repressive Complex 2 (PRC2) component mutations (e.g., EZH2) receive gene-specific adverse weights [3]. CUX1, located at 7q22, is not separately encoded because its loss almost always occurs within broader − 7/del(7q) lesions [5, 6].
The 7q region harbors several genes implicated in myeloid neoplasia, including CUX1 (Cut Like Homeobox 1), EZH2, SAMD9, and SAMD9L [7]. Contemporary genomic studies support a contiguous haploinsufficiency model [7–9]. Cumulative loss of multiple 7q tumor suppressors (CUX1, EZH2, LUC7L2, KMT2C/MLL3, among others) drives disease pathogenesis through impaired hematopoietic stem-cell function, defective DNA repair, and epigenetic dysregulation. A recent multinational analysis of 519 AML patients with chromosome 7 aberrations identified KMT2C as one of the most frequently mutated genes (16%), alongside EZH2 (10%), with mutations often subclonal and enriched in del(7q) [10]. These findings underscore the importance of coordinated 7q gene dysregulation in myeloid transformation.
CUX1 encodes a transcription factor with roles in cell proliferation, differentiation, and tumor suppression [11]. Several studies have demonstrated the prognostic relevance of CUX1 due to its role in DNA repair and tumor suppression [12, 13]. CUX1 loss leads to reduced gene expression, promoting tumorigenesis [11]. CUX1 alterations occur across myeloid neoplasms, including AML, chronic myelomonocytic leukemia (CMML), and MDS [7, 12].
The prognostic significance of CUX1 alterations in MDS has been inconsistent across studies: some reports demonstrate an association with inferior survival [12], while others have not found a significant independent prognostic effect [14]. These contradictory findings may reflect differences in the type of CUX1 alteration examined (point mutations versus copy-number loss), variation in cohort characteristics, or incomplete adjustment for established prognostic factors.
Recent work from the Cleveland Clinic has highlighted distinct patterns associated with CUX1 mutations versus deletions, with mutations primarily associated with high-risk MDS and deletions correlating with increased blast counts [12]. Co-alteration analyses have revealed associations with TET2, U2AF1, PRC2 complex members (EZH2, EED, SUZ12), and RAS family genes (NRAS, KRAS) [12].
In this study, we examined a large cohort of patients with MDS from cBioPortal [15]. We focused on CUX1 copy-number loss, as determined by CNACS (Copy Number Alteration Calling System) gene-level analysis, to address the contradictory survival findings and assess the incremental prognostic value of CUX1 loss beyond IPSS-M. We also characterized the co-alteration landscape and phenotypic associations of CUX1 loss.
Methods
Study design and data source
We conducted a retrospective cohort study using the publicly available MDS dataset curated in cBioPortal. We extracted 3,466 unique patients and restricted survival analyses to those with available overall survival (OS) or leukemia-free survival (LFS) information. Patients with available CNACS gene-level calls for CUX1 copy-number status comprised the primary analysis cohort (n = 501; 129 with loss, 372 without loss).
Ethics and approvals
This study used only de-identified, publicly available data from cBioPortal. No additional ethics approval was required, as the original source studies had obtained appropriate ethics approvals and informed consent.
Additional data integration
To address treatment and molecular characterization, we cross-referenced our cohort with the source IPSS-M repository (Bernard et al. [3]), matching 497 of 501 patients by anonymized identifiers. This provided treatment annotations (hypomethylating agents ^HMA^, allogeneic hematopoietic stem cell transplantation ^HSCT^, lenalidomide, intensive chemotherapy), TP53 allelic state (monoallelic versus multi-hit, as defined by Bernard et al. [16]), and point mutation data for 130 recurrently mutated genes. The IPSS-M source repository is publicly available at: https://github.com/papaemmelab/IPSSMstudy.
Variables and exposures
CUX1 alterations were derived from CNACS gene-level copy-number calls: cux1_loss (copy-number deletion), cux1_upd (uniparental disomy), and cux1_any (any structural alteration). del7q_any was defined as either CNACS-reported arm-level loss involving 7/7q or karyotype patterns of − 7/del(7q).
Co-alteration analyses included both copy-number alterations (loss/gain/UPD) inferred by CNACS and point-mutation data from the IPSS-M source repository. Copy-number co-alterations were assessed for genes on chromosome 7q and selected PRC2 components (EZH2, EED, SUZ12), TP53, TET2, ASXL1, and RAS pathway genes. Point-mutation co-alterations were assessed for recurrently mutated genes (EZH2, TP53, KRAS, NRAS, RUNX1, U2AF1, SF3B1, TET2, ASXL1, DNMT3A, SRSF2) using Fisher’s exact test with Benjamini-Hochberg false discovery rate (FDR) correction.
WHO 2022 classification mapping
WHO 2022 classification was retrospectively approximated from WHO 2016 categories, SF3B1 mutation status, and TP53 allelic state using the following hierarchy: (1) patients with TP53 multi-hit were classified as MDS with biallelic TP53 inactivation (MDS-biTP53); (2) remaining patients were mapped as MDS-EB1 → MDS-IB1, MDS-EB2 → MDS-IB2, MDS-del5q → MDS-5q, MDS-RS subtypes or SF3B1-mutated low-blast MDS → MDS-LB-SF3B1, other low-blast MDS → MDS-LB, and MDS-U → MDS-U/NOS. Hypoplastic MDS could not be identified from available data.
Outcomes
Overall survival (OS) was measured from diagnosis to death from any cause, censoring at last follow-up for survivors. Leukemia-free survival (LFS) was defined from diagnosis to AML transformation or death, whichever occurred first, censoring otherwise.
Statistical analyses
Kaplan–Meier curves with log-rank tests compared OS and LFS between CUX1 loss vs. no loss (Fig. 1). Cox proportional hazards models estimated hazard ratios (HRs) for CUX1 loss: (1) unadjusted; (2) adjusted for age, sex, IPSS-R cytogenetic risk, complex karyotype, and MDS type; and adjusted for age, sex, IPSS-M molecular score, complex karyotype, and MDS type. Proportional hazards assumptions were evaluated using Schoenfeld residuals. Variance inflation factors (VIF) were calculated for to assess collinearity.
Fig. 1. Overall survival and leukemia-free survival by CUX1 copy-number loss
To assess whether CUX1 improves risk prediction beyond IPSS-M, we compared nested Cox models with and without CUX1 loss, computing likelihood ratio (LR) tests, and Harrell’s concordance (ΔC) via bootstrap resampling (1,000 replicates). Survival within the − 7/del(7q) subgroup was analyzed separately. Fisher’s exact tests produced odds ratios (ORs) and 95% CIs for co-alteration analyses. FDR correction (Benjamini–Hochberg) was applied to co-alteration analyses. All analyses were performed using R, version 4.4.1.
Results
Cohort overview
The dataset comprised 3,466 unique patients. The primary analysis cohort contained 501 patients with available CNACS gene-level copy-number calls for CUX1, of whom 129 (26%) harbored CUX1 copy-number loss. Within the primary analysis cohort, we observed 307 OS events and 305 LFS events.
Baseline characteristics
Baseline characteristics are shown in Table 1. Patients with CUX1 loss were slightly younger (mean 66.4 vs. 70.7 years) and more often male (63% vs. 43%). Hemoglobin, WBC, ANC, and platelet counts were all lower in the CUX1-loss group. Marrow blasts were higher (median 7% vs. 4%; P < 0.001) (Fig. 2). Molecular risk differed strongly: IPSS-R scores averaged 6.9 vs. 4.6 and IPSS-M scores 2.33 vs. 0.79 (both P < 0.001; Supplementary Table S2). Complex karyotype was enriched (60% vs. 34%; P < 0.001), and − 7/del(7q) was nearly universal(98% vs. 9%; P < 0.001). Treatment data were available for 497 patients: 143 (29%) received HMA, 56 (11%) underwent HSCT, and 70 (14%) received lenalidomide. Patients with CUX1 loss were more likely to receive HMA (44% vs. 24%; P < 0.001) and HSCT (21% vs. 8%; P < 0.001), but less likely to receive lenalidomide (5% vs. 17%; P < 0.001). Under the approximated WHO 2022 classification, CUX1 loss was strongly underrepresented in MDS-5q (1% vs. 27%; P < 0.001) and enriched in MDS-IB2 (25% vs. 15%; P = 0.01).
Table 1. Baseline characteristics of the CUX1-informative cohortVariableOverall (n = 501)CUX1 loss: No (n = 372)CUX1 loss: Yes (n = 129)P-valuen501372129Age, years (mean ± SD)69.6 ± 11.570.7 ± 11.466.4 ± 11.5< 0.001Male, n (%)242 (48.3)161 (43.3)81 (62.8)< 0.001Hemoglobin, g/dL (median ^IQR^)9.01 ^8.04–10.30^9.10 ^8.20–10.50^9.00 ^8.00–10.00^0.149WBC, G/L (median ^IQR^)3.20 ^2.40–4.90^3.60 ^2.60–5.00^2.95 ^2.00–4.10^0.001ANC, G/L (median ^IQR^)1.51 ^0.87–2.74^1.71 ^1.00–3.00^1.00 ^0.56–1.88^< 0.001Platelet count, G/L (median ^IQR^)106.5 ^51.0–202.3^132.0 ^63.8–236.0^65.0 ^35.5–103.5^< 0.001BM blasts, % (median ^IQR^)4.00 ^2.00–8.50^4.00 ^2.00–7.50^7.00 ^3.00–11.00^< 0.001PB blasts, % (median ^IQR^)0.00 ^0.00–0.00^0.00 ^0.00–0.00^0.00 ^0.00–2.00^< 0.001IPSS-R score (mean ± SD)5.19 ± 2.494.57 ± 2.456.90 ± 1.63< 0.001IPSS-M score (mean ± SD)1.21 ± 1.800.79 ± 1.782.33 ± 1.30< 0.001Complex karyotype, n (%)201 (40)125 (34)77 (60)< 0.001−7/del(7q), n (%)162 (32)34 (9)127 (98)< 0.001Therapy-related MDS, n (%)82 (16)51 (14)30 (23)0.033WHO 2016 class (mean category)6.65 ± 2.676.74 ± 2.746.39 ± 2.450.191Treatment (n = 497 matched patients)HMA, n (%)143 (29)87 (24)56 (44)< 0.001Allogeneic HSCT, n (%)56 (11)29 (8)27 (21)< 0.001Lenalidomide, n (%)70 (14)64 (17)6 (5)< 0.001WHO 2022 Classification (n = 497)MDS-LB, n (%)81 (16)59 (16)22 (17)0.781MDS-LB-SF3B1, n (%)33 (7)22 (6)11 (9)0.304MDS-IB1, n (%)106 (21)74 (20)32 (25)0.258MDS-IB2, n (%)87 (17)55 (15)32 (25)0.010MDS-biTP53, n (%)68 (14)44 (12)24 (19)0.053MDS-5q, n (%)101 (20)100 (27)1 (1)< 0.001MDS-U/NOS, n (%)21 (4)16 (4)5 (4)1.000Continuous variables: median ^IQR^ or mean ± SD. Categorical variables: n (%). P-values: Wilcoxon rank-sum (continuous), Chi-square/Fisher’s exact (categorical)*BM *bone marrow, PB peripheral blood, WBC white blood cell count, ANC absolute neutrophil count, IPSS-R Revised International Prognostic Scoring System, IPSS-M Molecular International Prognostic Scoring System, HMA hypomethylating agent, HSCT allogeneic hematopoietic stem cell transplantation
Fig. 2. Bone marrow and peripheral blood blast percentage distributions by CUX1 loss status
Overall and leukemia-free survival
Overall and leukemia-free survival results are shown in Fig. 1; Table 2. CUX1 loss was associated with markedly inferior survival. Median OS decreased from 27.1 months (no loss) to 11.8 months (loss), with 1-/3-/5-year OS rates of 48%/14%/5% vs. 71%/44%/32% (log-rank P < 0.0001). Median LFS likewise declined from 24.2 to 9.2 months (log-rank P < 0.0001). Unadjusted HRs were 2.39 (95% CI 1.85–3.08) for OS and 2.30 (1.78–2.98) for LFS. Adjustment for age, sex, IPSS-R category, complex karyotype, and MDS type attenuated but did not eliminate the association (OS HR 1.50 [1.14–1.99]; LFS HR 1.41 [1.07–1.87]).
Table 2. Cox proportional hazards models for overall survival and leukemia-free survivalModelCovariatesOS n/eventsOS HR (95% CI)OS PLFS n/eventsLFS HR (95% CI)LFS PUnadjustedNone489/3072.39 (1.85–3.08)< 0.001464/3052.30 (1.78–2.98)< 0.001IPSS-R adjustedAge, sex, IPSS-R category, complex karyotype, MDS type446/2771.50 (1.14–1.99)0.004424/2721.41 (1.07–1.87)0.016IPSS-M adjustedAge, sex, IPSS-M score, complex karyotype, MDS type411/2551.27 (0.95–1.70)0.107394/2541.23 (0.92–1.65)0.154Hazard ratios (HRs) for CUX1 loss vs. no CUX1 loss. IPSS-R: category used as categorical covariateIPSS-M continuous molecular score, n/events number of patients with events, CI confidence interval, OS overall survival, LFS leukemia-free survival
IPSS-M–adjusted models and incremental value
IPSS-M–adjusted models and incremental value analyses are shown in Figs. 3 and 4. After adjusting for age, sex, IPSS-M molecular score, complex karyotype, and MDS type, CUX1 loss no longer achieved statistical significance (OS HR 1.27 [0.95–1.70], P = 0.11; LFS HR 1.23 [0.92–1.65], P = 0.15). Adding CUX1 to IPSS-M models yielded negligible improvements in discrimination (ΔC = + 0.0005 for OS and + 0.0011 for LFS, 95% CIs spanning 0; Supplementary Table S3) and non-significant LR tests (P = 0.11 and P = 0.16).
Fig. 3. Forest plot of hazard ratios for CUX1 loss across different Cox models. Forest plot of hazard ratios (95% CI) for CUX1 loss: unadjusted, IPSS-R adjusted, and IPSS-M adjusted models for overall survival (top) and leukemia-free survival (bottom). Dashed line indicates HR=1.
Fig. 4. Incremental prognostic value analysis showing change in C-index when adding CUX1 loss to IPSS-M models
Survival within the − 7/del(7q) subgroup
To evaluate whether the CUX1 effect was driven by − 7/del(7q), we restricted survival analyses to patients with − 7/del(7q) abnormalities. Among 147 del(7q) patients with available OS data (114 with CUX1 loss, 33 without), there was no significant difference in OS (median 11.0 vs. 8.8 months; log-rank P = 0.41) or LFS (median 9.0 vs. 8.4 months; log-rank P = 0.31) (Supplementary Figure S2). In multivariable analysis within the del(7q) subgroup adjusting for IPSS-M score, age, sex, and complex karyotype, CUX1 loss was non-significant for both OS (HR 1.37, 95% CI 0.86–2.19, P = 0.19) and LFS (HR 1.38, 95% CI 0.86–2.22, P = 0.19). Notably, CUX1 loss and − 7/del(7q) were too highly correlated (r = 0.84) for inclusion in a single model without collinearity concerns (VIF > 4.5). These findings confirm that the survival impact of CUX1 loss is attributable to − 7/del(7q) biology.
Stratified and interaction analyses
Stratified Kaplan–Meier curves are shown in Supplementary Figure S1. CUX1 loss remained adverse in both Low/Moderate and High/Very-High IPSS-M strata. Exploratory Cox interactions between CUX1 loss and IPSS-M risk were non-significant (interaction P = 0.62), as was the CUX1×MDS-type term (P = 0.55).
Co-alteration landscape
Co-alteration results are shown in Table 3 and Supplementary Table S1. CUX1 loss occurred almost exclusively in the context of − 7/del(7q): 98% of CUX1 loss cases occurred in patients with − 7/del(7q) versus 9% without (Table 3). PRC2 lesions dominated the gene-level co-alteration spectrum. EZH2 alterations showed OR 223.8 (95% CI 99.7–549.9; FDR P < 0.0001) and PRC2 complex alterations showed OR 60.5 (95% CI 30.7–129.9; FDR P < 0.0001). TP53 alterations displayed moderate enrichment (OR 2.47; FDR P < 0.001). In contrast, TET2, ASXL1, and RAS family alterations yielded ORs near unity (FDR-adjusted P ≥ 0.35). Analysis of TP53 allelic state revealed that TP53 multi-hit was strongly enriched in CUX1 loss (50% vs. 27%; OR 2.74, 95% CI 1.81–4.16; P < 0.001), whereas TP53 monoallelic alterations were underrepresented (2% vs. 8%; OR 0.30, 95% CI 0.09–0.99; P = 0.03). Chromosome 17 abnormalities were more frequent in CUX1-loss patients (37% vs. 19%).
Table 3. Co-alteration analysis results for CUX1 copy-number lossGeneCUX1 + Gene+CUX1 + Gene−CUX1 − Gene+CUX1 − Gene−OR (95% CI)P-valueFDR P EZH2 1171215357223.8 (99.7–549.9)< 0.001< 0.001 PRC2 117125132160.47 (30.7–129.9)< 0.001< 0.001 TP53 4683683042.47 (1.54–3.95)< 0.001< 0.001 EED 3126293430.28 (0.05–0.93)0.0350.095 TET2 8121133591.82 (0.64–4.88)0.2040.374 RAS 10119203521.48 (0.60–3.42)0.3880.534 SUZ12 2127113610.52 (0.06–2.42)0.5300.648 ASXL1 10119293430.99 (0.42–2.18)1.0001.000TP53 multi-hit64631002702.74 (1.81–4.16)< 0.001< 0.001TP53 monoallelic3124283420.30 (0.09–0.99)0.0340.068Upper panel: copy-number co-alterations (CNACS data). PRC2: EZH2, EED, or SUZ12; RAS: NRAS or KRAS. Lower panel: TP53 allelic state from the source IPSS-M mutation data (n = 497 matched patients). OR, odds ratio; CI, confidence interval; FDR, false discovery rate (Benjamini–Hochberg)Forest plot of hazard ratios (95% CI) for CUX1 loss: unadjusted, IPSS-R adjusted, and IPSS-M adjusted models for overall survival (top) and leukemia-free survival (bottom). Dashed line indicates HR = 1Boxplots of bone marrow (left) and peripheral blood (right) blast percentages: CUX1 loss (red) vs. no CUX1 loss (blue). Wilcoxon P-values shownChange in C-index (ΔC) when adding CUX1 loss to IPSS-M models for overall survival (blue) and leukemia-free survival (red). Error bars, 95% CI from 1,000 bootstrap resamples. P-values from likelihood ratio tests. Dashed line indicates ΔC = 0
Point-mutation co-alteration analysis
Point-mutation co-alteration analysis (Supplementary Table S1B) confirmed EZH2 enrichment (OR 4.57, FDR P = 0.004) and revealed additional associations: KRAS (OR 10.73, FDR P = 0.005), RUNX1 (OR 2.23, FDR P = 0.018), U2AF1 (OR 2.43, FDR P = 0.022), and TP53 (OR 2.11, FDR P = 0.004). SF3B1 mutations tended toward depletion (OR 0.44, FDR P = 0.07). TET2, ASXL1, DNMT3A, and SRSF2 point mutations showed no significant association, extending the copy-number findings.
Discussion
Over the past decade, next-generation sequencing testing for patients with MDS has become standard of care, particularly following the IPSS-M scoring system [3]. Prior to the molecular era, reliance on metaphase karyotype alone provided less accurate prognostication.
Patients with CUX1 loss exhibited features consistent with high-risk MDS biology: higher bone marrow and peripheral blood blast percentages, higher IPSS-R and IPSS-M scores, and increased frequency of complex karyotype, therapy-related disease, and TP53 multi-hit alterations. These associations align with previous reports linking CUX1 alterations to aggressive disease phenotypes [12]. The strong association with − 7/del(7q) (present in 98% of CUX1 loss patients versus 9% without) is biologically plausible given CUX1’s location on chromosome 7q22.1 [11]. This near-universal overlap indicates that isolated CUX1 deletions without broader 7q loss are exceptionally rare (approximately 2% of CUX1 loss cases), consistent with the contiguous haploinsufficiency model of 7q biology [7, 8].
Co-alteration landscape: the PRC2 connection
The most striking finding in our co-alteration analysis was the near-universal association between CUX1 loss and PRC2 complex alterations, particularly EZH2 (OR 223.8, 95% CI 99.7–549.9). This association is likely explained by the co-localization of both genes on chromosome 7q, where EZH2 resides at 7q36.1 [7]. When larger deletions encompass both loci, simultaneous loss of CUX1 and EZH2 would be expected. The functional significance of this co-deletion warrants further investigation, as both genes play important roles in transcriptional regulation and tumor suppression [11].
In contrast to previous reports suggesting enrichment of TET2, ASXL1, and RAS family alterations with CUX1 loss [12], we found no significant associations after FDR correction. These discrepancies may reflect differences in the type of alteration examined. Our study focused on copy-number loss, whereas previous work included point mutations [12]. Notably, TET2 is predominantly affected by point mutations, which limits assessment of TET2 co-alterations. using CNA-only data. The point-mutation analysis confirmed: TET2, ASXL1, DNMT3A, and SRSF2 point mutations showed no significant association with CUX1 loss.
TP53 allelic state and multi-hit inactivation
The enrichment of TP53 multi-hit (but not monoallelic) alterations in CUX1-loss patients is notable. Bernard et al. demonstrated that TP53 allelic state is the critical determinant of clinical behavior in TP53-altered MDS, with multi-hit driving adverse outcomes while monoallelic alterations behave similarly to TP53 wild-type.^16^ The co-occurrence of TP53 multi-hit with CUX1 loss likely reflects shared association with complex karyotype and − 7/del(7q) rather than a direct biological interaction.
Limitations
Several limitations should be acknowledged. First, this was a retrospective analysis of publicly available data, which may introduce selection biases and limit generalizability. Second, although we integrated point mutation data from the source IPSS-M repository, our primary analysis was restricted to copy-number loss; CUX1 point mutations were rare (7/497, 1.4%) and were not combined with deletions in outcome analyses. CUX1 downregulation can occur via haploinsufficiency, mutation, or epigenetic mechanisms, with a subset of MDS cases exhibiting reduced expression in the absence of 7q deletions [12]. Our study identifies the prognostic redundancy of physical deletions (which predominantly occur in − 7/del(7q)) but does not rule out CUX1 expression as an independent driver in chromosomally intact cases. Future studies integrating DNA and RNA sequencing are needed to interrogate this specific subgroup. Additionally, routine detection of − 7/del(7q) lesions relies on cytogenomic workflows recommended by the American College of Medical Genetics and Genomics [17].
Third, we lack functional data to validate therapeutic vulnerabilities. While the strong correlation with PRC2 alterations suggests potential sensitivity to EZH2/PRC2 inhibitors, experimental validation in CUX1-haploinsufficient models is required. Treatment data were descriptive; survival models were not adjusted for treatment, as this was not the study aim. The WHO 2022 classification was retrospectively approximated and may not perfectly correspond to prospective classification, particularly for categories requiring bone marrow histological assessment (e.g., hypoplastic MDS).
In summary, our findings confirm that CUX1 copy-number loss serves as a marker of − 7/del(7q) biology, with strong associations to PRC2/EZH2 alterations, but does not provide independent prognostic information beyond IPSS-M. While this suggests CUX1 loss may not warrant inclusion as an independent variable in current prognosis algorithms, validation in independent datasets with uniform treatment annotations is recommended. Ultimately, given the scarcity of actionable mutations in MDS, CUX1 loss represents an area warranting further investigation, particularly in PRC2-altered MDS.
Supplementary Information
Below is the link to the electronic supplementary material.
Supplementary Material 1.