Genome-wide association analyses highlight the role of the intestinal molecular environment in human gut microbiota variation
Koen F. Dekkers, Kamalita Pertiwi, Gabriel Baldanzi, Per Lundmark, Ulf Hammar, Marta Riise Moksnes, Eivind Coward, Maria Nethander, Ghassan Ali Salih, Mariam Miari, Diem Nguyen, Sergi Sayols-Baixeras, Aron C. Eklund, Jacob Bak Holm, H. Bjørn Nielsen, Camila Gazolla Volpiano

TL;DR
This study finds that human genetic variants influence gut microbiota composition, particularly through fatty acid sensing and mucosal functions.
Contribution
The study identifies new genetic loci linked to gut microbial variation and confirms prior associations using large population-based data.
Findings
Variants in OR51E1–OR51E2 are associated with microbial richness.
15 significant genetic associations were identified, with 11 replicated across studies.
New loci like MUC12 and SLC5A11 are linked to gut microbial composition.
Abstract
Despite the importance of the gut microbiome to health, the role of human genetic variation in shaping its composition remains poorly understood. Here we report genome-wide association analyses of harmonized metagenomic data from 16,017 adults in four Swedish population-based studies, with replication in 12,652 people from the Norwegian HUNT study. We identified variants in the OR51E1–OR51E2 locus, encoding sensors for microbiome-derived fatty acids, associated with microbial richness. We further identified 15 study-wide significant genetic associations (P < 5.4 × 10⁻¹¹) involving eight loci and 14 common bacterial species, of which 11 associations at six loci were replicated. The results confirm previously reported associations at LCT, ABO and FUT2, and provide evidence for new loci MUC12, CORO7–HMOX2, SLC5A11, FOXP1 and FUT3–FUT6, with supporting data from metabolomics and gene…
Genes, proteins, chemicals, diseases, species, mutations and cell lines named across the full text — each resolved to its canonical identifier and authoritative record.
Click any figure to enlarge with its caption.
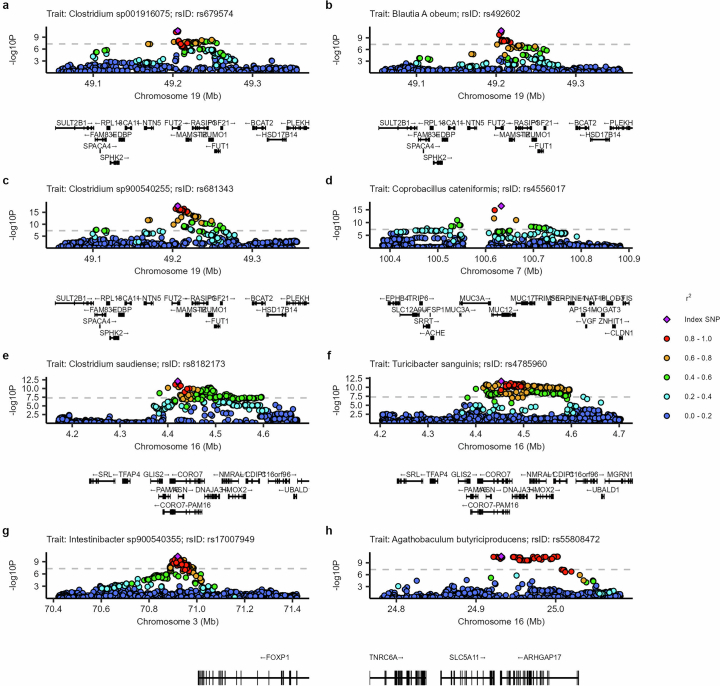 Figure 10
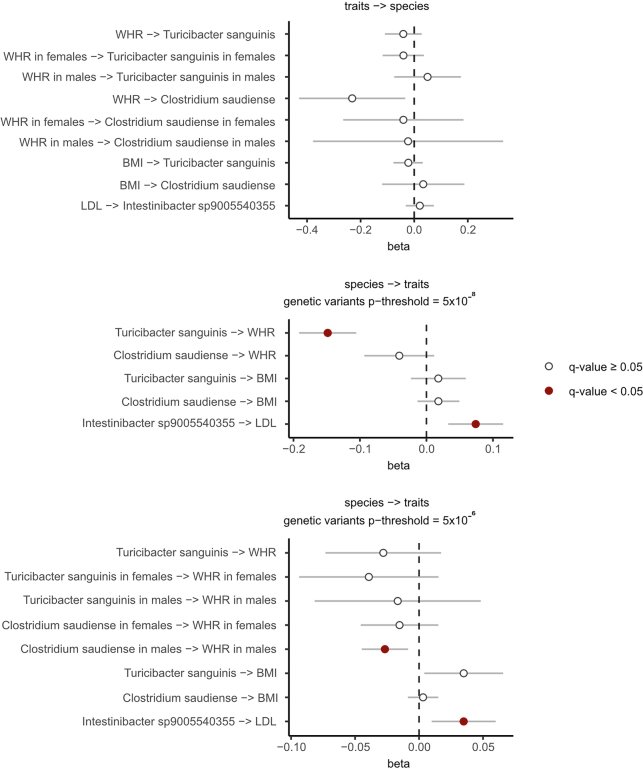 Figure 11
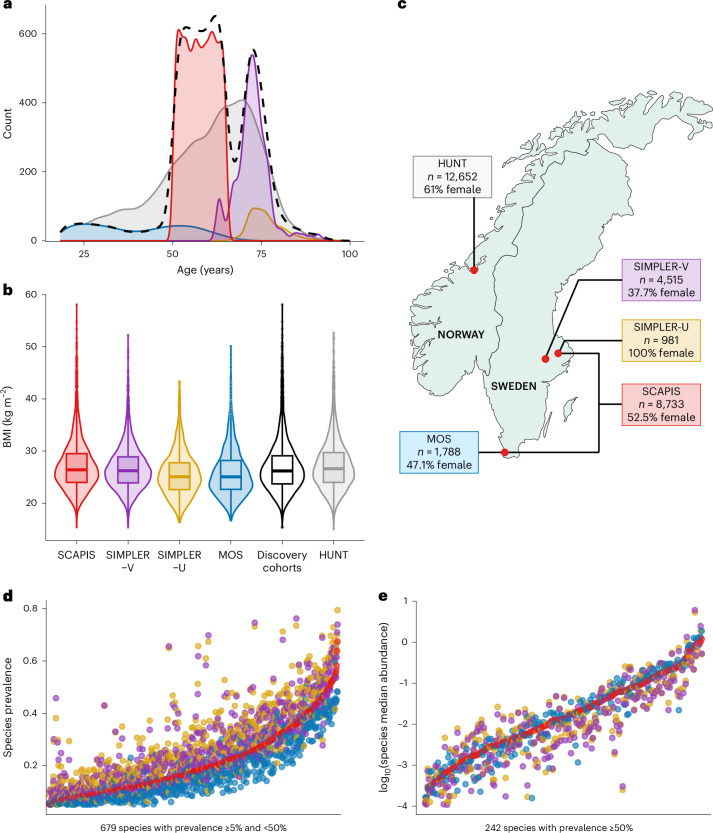 Figure 1
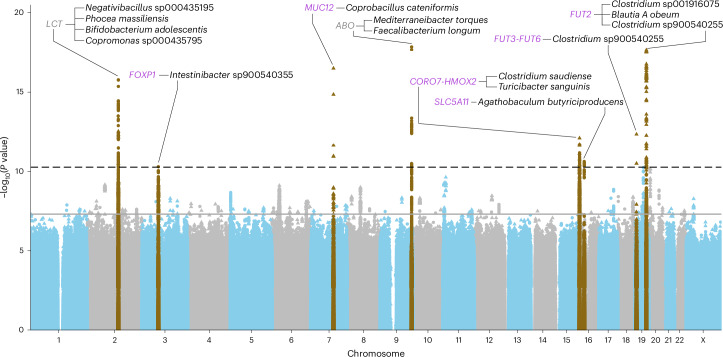 Figure 2
 Figure 3
 Figure 4
 Figure 5
 Figure 6
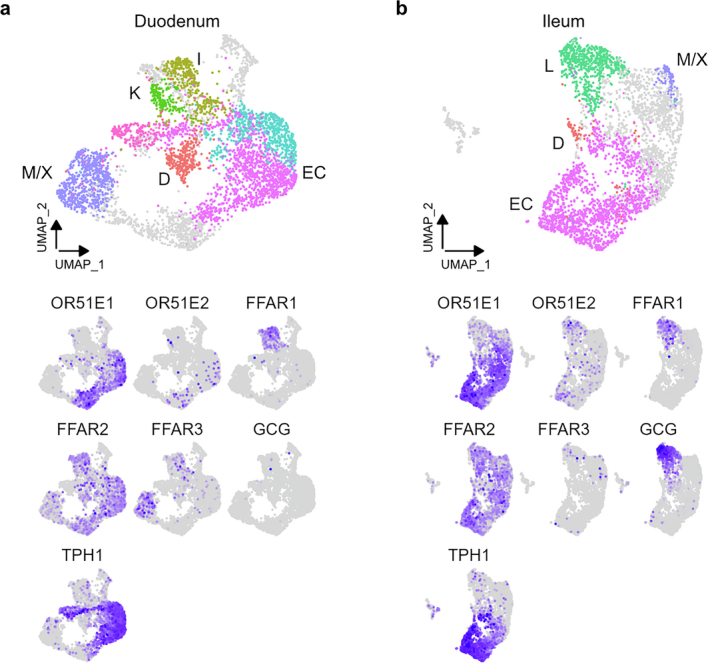 Figure 7
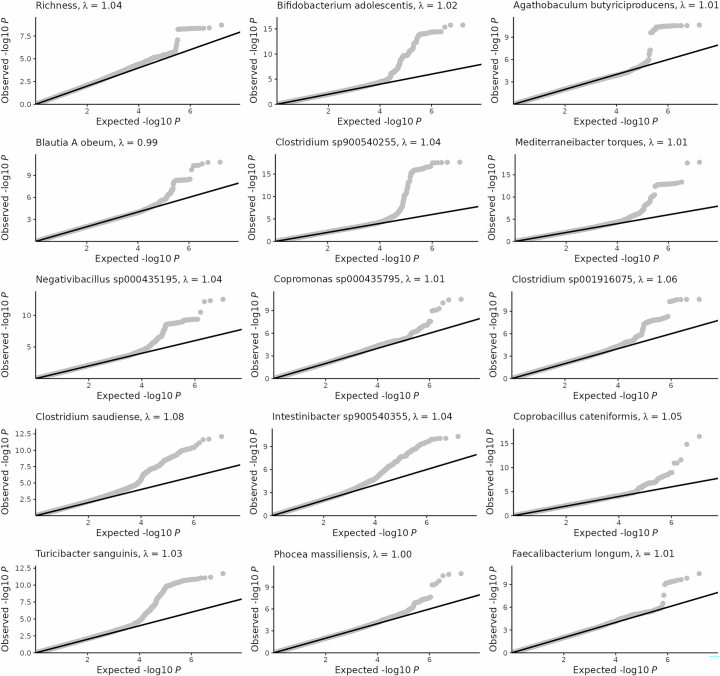 Figure 8
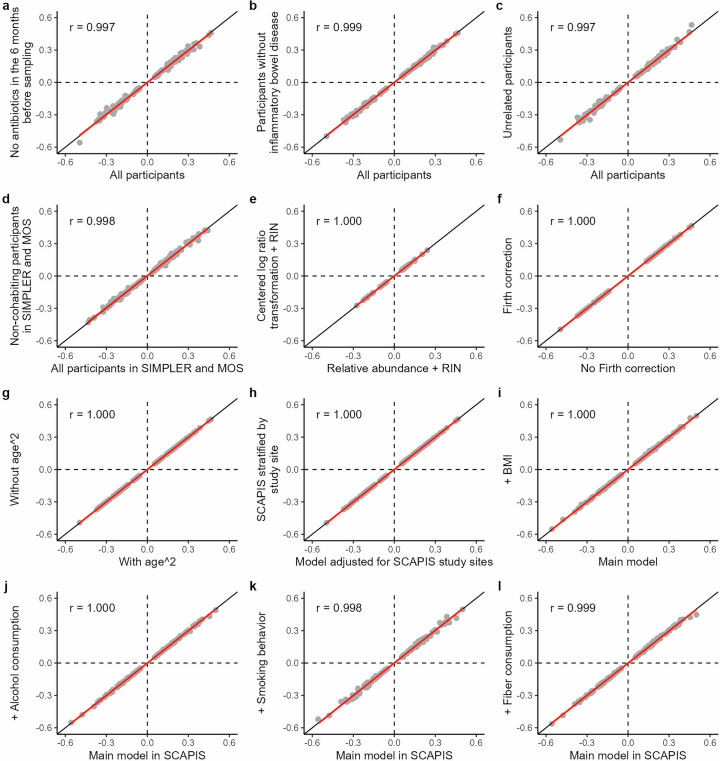 Figure 9
- —https://doi.org/10.13039/501100004359Vetenskapsrådet (Swedish Research Council)
- —https://doi.org/10.13039/501100003793Hjärt-Lungfonden (Swedish Heart-Lung Foundation)
- —European Research Council ERC-STG-2018-801965 the Göran Gustafsson Foundation for Research in Natural Sciences and Medicine
- —https://doi.org/10.13039/501100000925Department of Health | National Health and Medical Research Council (NHMRC)
- —https://doi.org/10.13039/501100000265RCUK | Medical Research Council (MRC)
- —https://doi.org/10.13039/100004440Wellcome Trust (Wellcome)
- —https://doi.org/10.13039/501100009708Novo Nordisk Fonden (Novo Nordisk Foundation)
- —https://doi.org/10.13039/501100004063Knut och Alice Wallenbergs Stiftelse (Knut and Alice Wallenberg Foundation)
- —https://doi.org/10.13039/501100004107Lars Erik Lundbergs Stiftelse för Forskning och Utbildning (Lundberg Foundation for Research and Education)
- —European Research Council ERC-ADG-2022-101096347, the ALF-agreement ALFGBG-720331, ALFGBG-965235, and ALFGBG-965744
- —European Research Council ERC-STG-2015-679242
- —https://doi.org/10.13039/501100006722Centrum fÖr Klinisk Forskning Dalarna (Center for Clinical Research Dalarna)
- —European Research Council ERC-COG-2014-649021, ALF-agreement 2018-0148 and 2022-0258, Swedish diabetes foundation DIA 2018-375
Peer Reviews
No public reviews on file for this paper yet. If you reviewed it on a platform where reviews are public (OpenReview, ICLR, NeurIPS, ICML), you can paste yours below so the community can read it here.
Videos
No videos yet. Explain this paper in a talk, walkthrough, or lecture? Add one.
Taxonomy
TopicsGut microbiota and health · Genetic Associations and Epidemiology · Epigenetics and DNA Methylation
Main
The human gut microbiome—a complex community of microorganisms residing in the gastrointestinal tract—influences many physiological processes. Recent advances in sequencing technologies have enabled detailed characterization of this microbial community, uncovering its variability and associations with several health conditions^1,2^. Although human twin and primate multigenerational studies have demonstrated evidence for host genetic contributions to the microbiome composition^3,4^, only a limited number of genome-wide association studies (GWAS) have been conducted. These include a meta-analysis of 24 studies including 18,240 participants that used 16S rRNA sequencing—a method offering limited species-level discrimination^5^. The study was further hampered by the fact that few shared bacterial taxa were detected across included studies, due partly to high variability in sample processing methods^5^—a common challenge in the field^6^. The largest high-resolution metagenomic study to date comprised 7,738 participants from the Netherlands^7^. So far, only variants in two loci, harboring the lactase (LCT) and the histo-blood group ABO system transferase (ABO) genes, have been linked robustly and repeatedly to specific microbiome species at study-wide significance (P < 5 × 10^−8^ corrected for the number of species tested)^4,5,7–10^. A Finnish cohort of 5,959 people identified an additional study-wide significant signal near MED13L^9^, but this signal has not been replicated in other studies. Other variants have been implicated at genome-wide significance (P < 5 × 10^−8^, no correction for the number of taxa tested), such as in the secretor status locus fucosyltransferase 2 (FUT2)^11^.
Here we leveraged high-resolution metagenomic data from 16,017 participants across four Swedish studies, with replication in 12,652 participants from the Norwegian Trøndelag Health Study (HUNT). We identified and replicated a genetic association with microbiome alpha diversity mapping to the OR51E1–OR51E2 locus that encodes microbial fatty acid chemosensors expressed by enteroendocrine cells (EECs). We further identified 15 single nucleotide polymorphism (SNP)–species associations at study-wide significance representing eight genetic loci, of which five are new. Our findings highlight the contribution of gut physiological functions, including enteroendocrine chemosensing, bile acid metabolism and mucosal layer make-up in microbiome composition, paving the way for future studies and potential therapeutic interventions that consider both host genetics and microbiome profiles.
Results
GWAS of deep shotgun metagenomic data from four Swedish studies profiled with a standardized pipeline
We performed and meta-analyzed GWAS of gut microbiome composition in 16,017 participants of European ancestry from four Swedish studies sampled between 2011 and 2021 (Fig. 1 and Supplementary Table 1). Participants were aged 18 to 96 years and 51% were female. The mean study sequencing depth ranged from 25.3 to 56.1 million read pairs. To ensure comparability, stool metagenomic reads were processed using a standardized pipeline^12^. Analyses included alpha diversity (richness, Shannon, inverse Simpson), 921 species present in ≥5% of participants in all four cohorts (excluding 3,214 rarer species), 652 higher taxa and 117 functional modules. Based on simulations maximizing power and minimizing false positive findings, we applied logistic regression for 679 species present in ≤50% of participants in all four cohorts (testing 5,368,906 variants, minor allele frequency (MAF) ≥ 5%) and linear regression for 242 species with >50% prevalence (7,454,886 variants, MAF ≥ 1%). GWAS was run separately by cohort and phenotype using REGENIE v.3.3 with sex, age, age^2^, plate and genetic principal components 1–10 as covariates; results were meta-analyzed by inverse-variance weighted fixed effects. Study-wide associations with species and diversity were replicated in HUNT (n = 12,652).Fig. 1. Characteristics of participants and microbiome composition across studies.a, Density plots of age of participants in the discovery studies (SCAPIS, n = 8,733; SIMPLER-V, n = 4,515; SIMPLER-U, n = 981; MOS, n = 1,788; total n = 16,017 individuals) and in HUNT. Dashed line: combined discovery studies. b, Violin and boxplots of BMI of participants in the discovery studies (SCAPIS, n = 8,733; SIMPLER-V, n = 4,512; SIMPLER-U, n = 978; MOS, n = 1,788; total n = 16,011) and in HUNT (n = 12,652). Violin plots show the density distribution. The boxplots within the violin plots show the medians and the IQR, and whiskers extend to the values no larger than 1.5 times the IQR (upper whisker) or smaller than 1.5 times the IQR (lower whisker). Outliers are depicted as individual points. c, Map with the study sites for the discovery studies in Sweden (SCAPIS, SIMPLER-V, SIMPLER-U and MOS) and the replication cohort in Norway (HUNT), including the sample size and proportion of female participants in each study. d, Prevalence for the species analyzed with the logistic model. e, The log-transformed median abundance for the species analyzed with the linear model in the discovery studies. In d and e, each dot represents one species. Species are ranked by their prevalence and median abundance in SCAPIS.
A locus including genes encoding EEC receptors is implicated in gut microbial richness
Low gut microbial alpha diversity has been associated with higher risk of metabolic disorders, although causality remains uncertain^13,14^. We estimated heritability at 9% for Shannon index and 20% for richness (Supplementary Table 2), lower than the 30–37% reported in twin studies^4^. We found associations (lead variant rs10836441-T) in the locus covering OR51E1 (mouse ortholog Olfr558) and OR51E2 (Olfr78) genes on chromosome (Chr.) 11 (Extended Data Fig. 1a) with microbiome richness (−5.7 species per T allele, P = 1.9 × 10^−9^; Supplementary Table 3), which was replicated in the HUNT study (−2.8 species per T allele, P = 2.1 × 10^−3^). The imputation of genotypes for rs10836441 was confirmed in a subset of 148 people using Sanger sequencing with a concordance of 100% (Extended Data Fig. 2a). rs10836441 is an expression quantitative trait locus (eQTL) for OR51E2 and OR51E1 expression in several tissues (GTEx v.8)^15^. At the species level, rs10836441 was associated at the genome-wide level with the uncharacterized species HGM14224 sp900761905 (Bacillota phylum) and with SFEL01 sp004557245. The latter is reported as a predictor of response to short-chain fatty acids (SCFA) supplementation in Parkinson’s disease^16^. OR51E1 and OR51E2 belong to the large olfactory receptor gene family encoding G protein-coupled receptors expressed primarily in the olfactory epithelium but also more broadly across the body^17^. Recently, the proteins encoded by the mouse orthologs of OR51E1 and OR51E2 have been identified as sensors for gut microbiome-derived short-, medium- and branched-chain fatty acids in EECs^18^. EECs are hormone-producing cells in the gastrointestinal epithelium, with important roles in the physiological response to feeding, such as gut motility and satiety. A role of EECs in microbiome composition is supported by a recent study where mice deficient in colonic EECs were shown to have lower alpha diversity compared to controls^19^. Further, knockout of the OR51E2 receptor ortholog in a mouse model of colitis caused higher levels of intestinal inflammation^20^. EECs express several fatty acid chemosensors, such as FFAR1-FFAR4, of which FFAR2 and FFAR3 are relevant for sensing microbiome-derived SCFA^21^. Further corroborating our findings of a potential role of fatty acid chemosensing of EECs in microbiome composition, we observed that genetic variants in the FFAR1–FFAR2–FFAR3 locus at Chr. 19 were associated at near study-wide significance with Pullichristensenella excrementipullorum (P = 5.7 × 10^−11^, Supplementary Table 4; replicated in HUNT, P = 1.5 × 10^−3^). The lead variant rs75481361 at the FFAR1–FFAR2–FFAR3 locus was also associated with the same uncharacterized species as rs10836441 (HGM14224 sp900761905, P = 2.3 × 10^−9^; Supplementary Table 4) and associated nominally with richness (P = 5 × 10^−3^). rs75481361 is reported as an eQTL for FFAR3 in colon tissue (GTEx v.8)^15^. We assessed the expression of OR51E1 and OR51E2 in single-cell RNA sequencing (scRNA-seq) from three sources: human intestinal cells^22^, EECs purified from human duodenal and ileal organoids^23^ and in EECs of transgenic mice^24^. The scRNA-seq data from human intestinal cells showed expression of OR51E1 in EECs along the intestinal tract, whereas OR51E2 was expressed mainly in EECs in the colon (Extended Data Fig. 3a). OR51E2 was expressed across most colonic immune cell types, highest in T cells and monocytes/macrophages (Extended Data Fig. 3b). FFAR1 was restricted mainly to duodenal and ileal EECs, FFAR2 to several cell types including EECs, whereas FFAR3 showed overall low expression. To evaluate the expression of these olfactory and fatty acid receptor genes in different EEC types, we analyzed scRNA-seq from EECs purified from human duodenal and ileal organoids^23^ (Extended Data Fig. 4) and from EECs of transgenic mice^24^ (Extended Data Fig. 3c). In the human organoid-derived EECs, we observed overlap of OR51E1 expression with tryptophan hydroxylase 1 (TPH1)—a marker of enterochromaffin cells. Enterochromaffin cells constitute less than 1% of the total intestinal epithelium cells but have important effects on modulating motility by release of serotonin. However, the lead variant rs10836441 was not associated (P = 0.62) with self-reported stool frequency—a proxy measurement of gastrointestinal motility—in a published GWAS^25^. The expression of OR51E2 was considerably lower in the human duodenal and ileal organoids (Extended Data Fig. 4), consistent with the human intestinal results (Extended Data Fig. 3a). The mouse ortholog of OR51E2 (Olfr78) was expressed in L-cells in the mouse lower intestinal tract, which are responsible for secretion of glucagon-like peptide 1 (GLP-1), peptide YY (PYY) and insulin-like peptide 5 (INSL5). To test whether the OR51E1–OR51E2 locus was linked to GLP-1 or SCFA, we examined rs10836441 in relation to fasting and 2-h post-oral glucose load GLP-1 in up to 3,514 participants from the Malmö Diet and Cancer Study (MDC) and the Prevalence, Prediction and Prevention of Type 2 Diabetes–Botnia Study (PPP-Botnia) and to SCFA in 1,800 people from the Malmö Offspring Study (Supplementary Tables 5 and 6). No association could be detected in this somewhat limited sample when correcting for multiple testing. In summary, our results suggest that genetic variation affecting SCFA chemosensors that are expressed in EECs is relevant to the human gut microbiome composition; however, more research is needed to determine the causal genes and mechanism of action.
Meta-analysis identified eight genetic loci associated with 14 microbial species at study-wide significance
After clumping of meta-analysis results, we found 149 SNP–species associations at the genome-wide significance level (P < 5 × 10^−8^; Supplementary Table 4) comprising 113 loci separated by at least 100 kb and 132 species. We used FUMA^26^ to identify functional or phenotypic genesets and found 38 enrichments, including genesets previously linked to diet (n = 10), cancer biomarkers (n = 3), blood group (n = 3), gallstone disease (n = 1) and waist-to-hip ratio (WHR) adjusted for body mass index (BMI) (WHRadjBMI) (n = 1) (Supplementary Table 7). At the stricter study-wide threshold (P < 5.4 × 10^−11^), we identified 15 SNP–species associations across eight loci and 14 species (Figs. 2 and 3 and Table 1), and 12 SNP–higher taxa associations at five loci (LCT, PLEKHG1, MUC12, ABO and SLC5A11) (Supplementary Table 8). The 14 species had a median heritability of 13% (interquartile range (IQR) 5–16%; Supplementary Table 2), highest for Clostridium saudiense (33%). Corresponding estimates were 11% (IQR 5–19%) for species with genome-wide associations and 8% (IQR 3–16%) for those without. All 14 species were at least moderately prevalent; the least prevalent species was detected in 27% of the participants. Candidate genes based on genetic distance, eQTL data, gene expression in human intestinal cells (Extended Data Fig. 3) and biological function were LCT, ABO, FOXP1, MUC12, CORO7–HMOX2, SLC5A11, FUT2 and FUT3–FUT6—all expressed in the human intestine (Extended Data Fig. 3). We did not observe evidence of genomic inflation (mean λ = 1.03; s.d. = 0.02), and findings were consistent across studies (Supplementary Table 4 and Extended Data Fig. 5). No differences between estimates were found in the sex-stratified analysis at the 5% false discovery rate (FDR) level (Supplementary Table 9). The genome-wide significant associations were consistent in sensitivity analyses using models with centered log-ratio transformation (linear regression models), with Firth correction (logistic regression models), without age^2^ as a covariate, with study sites analyzed separately, excluding all but one person per household, excluding one from each related pair, excluding recent antibiotic users, excluding self-reported inflammatory bowel disease (IBD) cases and including BMI, smoking, alcohol or fiber intake as covariates, respectively (Extended Data Fig. 6).Fig. 2. Manhattan plot for associations between genetic variants and 921 species in the discovery studies (n = 16,017).The dashed black line represents the study-wide (P < 5.4 × 10^−11^, after Bonferroni correction of the genome-wide threshold), and the solid gray line genome-wide (P < 5.0 × 10^−8^) significant thresholds. Filled triangles represent binary outcomes (absence/presence), which were tested using logistic regression models; circles represent continuous outcomes (relative abundance), which were tested using linear regression models. All tests were two-sided. Loci not found previously in other GWAS at study-wide significance are indicated in purple.Fig. 3. Cladogram of genetic associations with gut bacterial species.a, The phylogenetic tree layers from center to periphery are kingdom-phyla-class-order-family, and all families captured by the 921 species are plotted. Phyla with at least one genetic association are colored. Species are placed at their family. b, Per-locus associations with microbiome species for loci with at least one study-wide significant association. Each dot corresponds to one species.Table 1. Loci associated with gut microbiome composition at study-wide significanceVariantMicrobiome featureModelSwedish studiesHUNTLocusLead variantChr: Pos37EA/OAEffect predictionEAFTraitPrevBetas.e.PBetas.e.P**OR51E1–OR51E2rs1083644111:4689742T/CIntergenic0.52RichnessNALinear**−0.060.011.9** × 10^−9^−0.040.012.1 × 10^−3^LCTrs49882352:136608646A/GIntron (MCM6)0.72Negativibacillus sp000435195(NCBI^a^: Clostridium sp. CAG:169*)28.1Logistic0.230.032.9 × 10^−13^0.090.040.04rs49882352:136608646A/Gintron (MCM6)0.72Phocea massiliensis75.7Linear**0.080.011.4 × 10^−11^**0.080.025.1 × 10^−6^rs1825492:136616754T/CIntron (MCM6)0.72Bifidobacterium adolescentis90.0Linear**−0.100.011.7 × 10^−16^**−0.140.021.4 × 10^−14^rs67543112:136707982T/CIntron (DARS)0.72Copromonas* sp000435795(NCBI^a^: Alitiscatomonas acetii)67.7Linear0.080.013.2 × 10^−11^0.100.022.4 × 10^−8^FOXP1rs170079493:70920041C/GIntergenic0.32Intestinibacter sp900540355*(NCBI^a^: Clostridium sp. 1001270J_160509_D11)55.9Linear0.070.015.1 × 10^−11^0.030.017.3 × 10^−3^MUC12rs45560177:100632790T/CIntron (MUC12)0.83Coprobacillus cateniformis26.9Logistic**0.340.043.3 × 10^−17^**0.380.061.7 × 10^−11^ABOrs94113789:136145425A/CIntron (ABO)0.28Mediterraneibacter torques*(NCBI*: [Ruminococcus] torques)86.9Linear0.110.011.4 × 10^−18^0.120.011.0 × 10^−16^rs5500579:136146597T/CIntron (ABO)0.31Faecalibacterium longum96.6Linear0.080.013.8 × 10^−11^0.080.021.6 × 10^−9^CORO7–HMOX2rs818217316:4420787T/CIntron (CORO7)0.23Clostridium saudiense40.2Logistic−0.220.037.8 × 10^−13^−0.110.050.02rs478596016:4453319C/GIntron (CORO7)0.26Turicibacter sanguinis53.9Linear**−0.080.012.0** × 10^−12^−0.040.011.7 × 10^−3^SLC5A11rs5580847216:24931691A/GNoncoding transcript exon (AC008731.1)0.06Agathobaculum butyriciproducens98.3Linear0.150.022.4 × 10^−11^0.160.034.3 × 10^−9^FUT3–FUT6rs70868619:5840619T/CUpstream gene (FUT6)0.30Clostridium sp900540255(NCBI^a^: uncultured Clostridium sp.)36.3Logistic−0.200.034.5 × 10^−13^−0.110.050.02FUT2rs67957419:49206108C/GIntron (FUT2)0.56Clostridium sp001916075(NCBI^a^: C. lentum)31.2Logistic0.170.032.5 × 10^−11^0.150.051.6 × 10^−3^rs49260219:49206417A/GSynonymous (FUT2)0.56Blautia A obeum(NCBI^a^: B. obeum)96.4Linear0.070.011.6 × 10^−11^0.080.017.6 × 10^−10^rs68134319:49206462T/CStop gained (FUT2)0.44Clostridium sp900540255(NCBI^a^: uncultured Clostridium sp.)36.3Logistic**−0.220.032.2** × 10^−18^−0.190.041.1Associations shown here were those at study-wide significance after Bonferroni correction of the genome-wide threshold, that is, P < 1.7 × 10^−8^ for richness and P < 5.4 × 10^−11^ for species. Bold type indicates those robustly replicated in HUNT at a Bonferroni-corrected P = 3.3 × 10^−3^. Betas are regression coefficients in standard deviation richness or species abundance per effect allele (calculated using a linear regression model) or log odds of species presence per effect allele (calculated using a logistic regression model). Tests were two-sided. Locus, manually assigned locus name based on previous GWAS assignment or function of nearby genes if new; Lead variant, reference SNP identifier of the locus lead variant (that is, the variant with the lowest P value); Pos37, human genome GRCh37 position on the chromosome; EA, effect allele; OA, other allele; EAF, mean effect allele frequency across studies; Trait, microbial species richness or species name; Model, GWAS regression model; Prev, mean species prevalence across studies (based on rarefied relative abundances for logistic models and nonrarefied relative abundances for linear models); Swedish studies P, P value in Swedish studies SCAPIS, SIMPLER-V, SIMPLER-U and MOS (discovery); HUNT P, P value in HUNT (replication).^a^National Center for Biotechnology Information (NCBI) equivalents refer to the unfiltered NCBI taxonomy of GTDB species representative as of 2024-04-24. This was only added for species for which the name of the NCBI equivalent was different than GTDB.
Of the 15 SNP–species associations, we replicated 11 at six loci in HUNT at the Bonferroni-corrected threshold (P < 3× 10⁻^3^) and all 15 at P < 0.05 with consistent effect direction. Of these 15 SNP–species associations, seven were present in FINRISK^9^ and four in the Dutch Microbiome Project^7^, of which seven and two were replicated, respectively (Supplementary Table 10). Allele frequencies were comparable across studies, except for the LCT SNPs in FINRISK (Supplementary Table 11), which are known to vary across populations^27^. Lactase persistence alleles at LCT were associated with decreased levels of Bifidobacterium adolescentis and with increased levels of Phocea massiliensis, Negativibacilus sp000435195 and Copromonas sp000435795, and at genome-wide level with five additional species, including three Bifidobacterium species (Extended Data Fig. 1b–e and Supplementary Table 4). Variants in LCT were also associated at study-wide significance with the genera Phocea and Bifidobacterium, and the family, order and class (Bifidobacteriaceae, Actinomycetales and Actinomycetia, respectively) of the Bifidobacterium spp. In a nontargeted plasma metabolomics analysis in the Swedish CArdioPulmonary bioImage Study (SCAPIS), we confirmed previously reported associations of the LCT lead variants with the glycemic marker 1,5-anhydroglucitol^28^ and found associations with vitamin B6 levels (Supplementary Table 12; FDR q < 0.05). Our colocalization analysis revealed a shared genetic signal in the LCT locus for B. adolescentis, P. massiliensis, Negativibacilus sp000435195 and Copromonas sp000435795 with plasma levels of the secondary bile acid isoursodeoxycholate and low-density lipoprotein (LDL) cholesterol (Supplementary Table 13). Our findings thus expand the number of robustly replicated microbiome-associated loci from two (ABO and LCT) to six (ABO, LCT, FUT2, MUC12, CORO7–HMOX2 and SLC5A11) and provide strong supportive evidence for two additional (FUT3–FUT6 and FOXP1) loci.
Several associations support an important role of fucosylated glycans in microbiome regulation
In this study, we found study-wide species associations with three loci linked to the phenotypical variation and secretion of histo-blood group antigens: ABO, FUT2 and FUT3–FUT6 (Extended Data Figs. 1f–h and 7a–c). Histo-blood group antigens are fucosylated glycans present on cell surfaces and in secretions, including the gastrointestinal mucus layer. These antigens constitute a carbon source and binding site for many gut bacteria^29^. We confirmed previous associations of ABO variants with Faecalibacterium longum and reported new associations with Mediterraneibacter torques and the genus UMGS1623. The association of ABO variants with specific species and strains is reported to depend on the secretor status of histo-blood group antigens determined by variations in FUT2—a gene encoding a fucosyltransferase^11^. Nonsecretors, who comprise about 20% of people of European ancestry, do not secrete histo-blood group antigens in bodily secretions such as saliva and mucus.
Given the association with ABO, an association between FUT2 variants and the gut microbiome is expected^11^ but has so far been observed only at the genome-wide significance level^5,30^. Here we identified three species associated with FUT2 variants at a study-wide significance level: Blautia A obeum, Clostridium sp900540255 and Clostridium sp001916075, and on a genome-wide significance level with Mediterraneibacter torques, Mediterraneibacter faecis and Ruminococcus B gnavus. Blautia A obeum is a highly prevalent species that has been shown to harbor glycosyl hydrolase genes that can remove fucose from glycans^31^. The lead variant in the current study is in close linkage disequilibrium (LD) with rs601338, which introduces a stop codon resulting in the nonsecretor status. Variants in FUT2 have been linked previously to IBD, and our colocalization results show evidence of shared causal variants of IBD with Blautia A obeum, Clostridium sp900540255 and Clostridium sp001916075 (Supplementary Table 13). To ascertain that our FUT2-associations were not due to secondary effects of IBD, we reanalyzed the results excluding IBD cases, which yielded similar results (all P < 3.7 × 10^−10^; Extended Data Fig. 6). We identified associations of ABO and FUT2 lead variants with plasma secondary bile acid levels—probably an effect of altered gut microbiome composition as bacteria are responsible for the conversion of primary to secondary bile acids (Supplementary Table 12; FDR q < 0.05). We found strong evidence for a secretor-status-dependent effect of genetically predicted expression of the ABO A antigen (blood groups A or AB) on M. torques abundance but not for the B antigen (blood group B) (Supplementary Table 14; interaction P = 5.7 × 10^−7^). The abundance of M. torques was higher in secretors (median abundance 0.06 (Q1, Q3 0.004, 0.26)) than in nonsecretors (0.03 (0.0008, 0.17)) in those presumed to express antigen A, and low (median 0.03) in those predicted to express the antigen B, irrespective of secretor status. These findings might be explained by the potential of M. torques, also known as Ruminococcus torques, to produce an α-N-acetylgalactosaminidase that removes N-acetylgalactosamine (GalNac) from the antigen A^32^.
FUT2 also determines the phenotype of the Lewis blood group antigen; those who are secretors express Le(b) instead of Le(a), provided that the person carries a functional FUT3 gene. The Le(b) antigen is proposed to act as a binding site for bacteria such as Helicobacter pylori^33^. Here we found associations of the FUT3–FUT6 locus with the species Clostridium sp900540255. The FUT3 locus has not been associated previously with gut microbiome traits but has been linked to several other traits, such as gallstone disease^34^ and LDL cholesterol^35^. Our colocalization analysis provided strong evidence for a shared genetic signal for Clostridium sp900540255 with LDL cholesterol, at both the FUT2 and the FUT3–FUT6 loci (Supplementary Table 13). We also tested for the interaction of secretor status and the Lewis blood group (Le^+^ versus Le^−^) for relevant species. However, in contrast to the ABO findings, we did not find robust evidence that the effect of Lewis antigen is dependent on secretor status. Taken together, our observed associations of the ABO, FUT2 and FUT3–FUT6 loci with specific bacterial species underline the importance of fucosylated glycans in shaping the gut microbial landscape.
Genes involved in the mucosal layer implicated in gut microbiome composition
We discovered and replicated an association between a variant in an intron of MUC12 and Coprobacillus cateniformis, flanked by two other mucin genes, MUC3A and MUC17 (Extended Data Fig. 7d). The same variant was also associated at study-wide significance with the genus Coprobacillus. Our genotyping array did not cover the MUC3A gene region well due to gaps in the human genome assemblies for the human MUC3 cluster^36^. Imputed genotypes for the lead variant rs4556017 were confirmed in a subset of 148 people using Sanger sequencing with a concordance of 96.6% (Extended Data Fig. 2b). Mucins, including MUC3A, MUC12 and MUC17, are main components of the enterocyte glycocalyx and are heavily O-glycosylated glycoproteins. MUC12 is expressed most strongly by enterocytes and goblet cells in the human colon, whereas MUC3A and MUC17 are expressed most strongly in the duodenum and ileum (Extended Data Fig. 3). Host glycans play an important role in determining which bacteria can colonize the host, and serve as an important nutrient source for gut microbes^37^. Variants in this locus have been associated previously with stool frequency^25^, and we showed through colocalization analysis evidence supporting a shared genetic signal between C. cateniformis and stool frequency (P(H4) > 0.99; Supplementary Table 13). C. cateniformis is a recently described Gram-positive, nonsporulating, anaerobic, rod-shaped bacterium^38^. The stool levels of C. cateniformis were reported to decrease in patients with irritable bowel syndrome after fecal microbiota transplantation and were correlated positively with both symptoms and fatigue^39^. Variants near mucin genes (MUC5, MUC12, MUC13, MUC22) have been suggested previously at genome-wide or near genome-wide significance with metagenomic features^9,40,41^. Our findings corroborate previous findings that genetic variations in mucin genes can shape the gut microbiome composition.
Shared genetic background of Turicibacter sp., Clostridium saudiense, Intestinibacter sp900540355, adiposity traits and bile acids
We discovered new associations of variants in the CORO7–HMOX2 locus on Chr. 16 with the strictly anaerobic, Gram-positive Turicibacter sanguinis (rs4785960, P = 2.0 × 10^−12^; replication P = 1.7 × 10^−3^), with the spore-forming, anaerobic, Gram-positive Clostridium saudiense, previously known as C**lostridium saudii (P = 7.8 × 10^−13^; replication P = 0.02), and at a genome-wide threshold with Intestinibacter sp900540355. Genes located in this locus include CORO7, VASN, PAM16 and HMOX2 (Extended Data Fig. 7e,f). eQTL analysis showed that the lead variants are associated with the expression of several of these genes in several tissues. We found another locus with a similar pattern of species associations near FOXP1 on Chr. 3, which was associated with Intestinibacter sp900540355 (rs17007949; P = 5.1 × 10^−11^) at study-wide significance level (Extended Data Fig. 7g), and with C. saudiense, Faecalibacterium prausnitzii F and Turicibacter bilis at the genome-wide significance level. Variants near FOXP1, which has a key role in the immune system^42,43^, have been associated previously with traits such as neutrophil count, hemorrhoidal disease, Crohn’s disease, dietary intake and Barrett’s esophagus, and at genome-wide significance with Leptospirales^9^. A variant in a third locus near PLEKHG1 was also associated at study-wide significance with the Turicibacter genus, family (Turicibacteraceae) and order (Haloplasmatales) of Turicibacter spp. (Supplementary Table 8). A recent study has shown that some Turicibacter strains encode and produce bile salt hydrolases—enzymes involved in producing secondary bile acids^44^. Furthermore, mice gavaged with Turicibacter presented with alterations in fat mass and circulating bile acids and lipids^44^. In our metabolomics analysis, the Turicibacter-lowering C allele of rs4785960 in the CORO7–HMOX2 locus was associated with higher plasma levels of several secondary bile acids (Supplementary Table 12). Consistent findings were observed when examining the associations of T. sanguinis and C. saudiense abundances with these secondary bile acid metabolites in plasma (Supplementary Table 15). The lead variant in the FOXP1 locus was associated with stool levels of the secondary bile acid glycoursodeoxycholate (P = 9.8 × 10^−7^; Supplementary Table 16). We observed a shared genetic signal between Intestinibacter sp9005540355 and LDL cholesterol in the FOXP1 locus, but not between T. sanguinis, C. saudiense and LDL cholesterol in the CORO7–HMOX2 locus. We performed a Mendelian randomization (MR) analysis to investigate potential bidirectional effects between LDL cholesterol and Intestinibacter sp9005540355. The analysis suggested a positive effect of Intestinibacter sp9005540355 abundance on LDL cholesterol (P = 4.4 × 10^−4^; q-value = 0.001) but not in the opposite direction (Supplementary Table 17 and Extended Data Fig. 8). Creating the genetic instruments using a more liberal P value threshold of 5 × 10^−6^ yielded concordant results (P = 0.006; q-value = 0.02); however, the MR–Egger intercept indicates the presence of horizontal pleiotropy in this liberal analysis (P = 0.012). The CORO7–HMOX2 locus was reported previously to be associated with WHRadjBMI^45^. We found that WHRadjBMI shares a genetic signal with T. sanguinis and C. saudiense in colocalization analyses (P(H4) > 0.94) (Supplementary Table 13). The MR analysis showed evidence of an effect of T. sanguinis on WHRadjBMI, but not in the opposite direction. Analyses using the liberal P value threshold of 5 × 10^−6^ to create genetic instruments did not support the effect of T. sanguinis on WHRadjBMI (P = 0.23). Although the mechanism is still unclear, it seems plausible that these two loci might affect similar or the same pathways. Our findings suggest that genetic variations at two different loci, CORO7–HMOX2 and FOXP1, affect a shared set of bacteria, including Turicibacter sp., C. saudiense and an Intestinibacter species, as well as LDL cholesterol, bile acids and body composition.
Variants in the SLC5A11 locus associated with a butyrate-producing bacterium
We identified variants in the SLC5A11 locus on Chr. 16 associated with the abundance of Agathobaculum butyriciproducens and its family Butyricicoccaceae (Extended Data Fig. 7h and Supplementary Table 8). This locus has been linked previously to the related genus Butyricicoccus at genome-wide significance^46^. The lead variant rs55808472 is an eQTL for SLC5A11. The species-increasing A allele reduces SLC5A11 expression (also known as SMIT2 or SGLT6) in the ileum^47^. This gene encodes sodium/myo-inositol cotransporter 2, which mediates apical myo-inositol absorption in the intestine. Myo-inositol plays roles in various physiological processes, including cellular signaling as a precursor for phosphatidylinositol and inositol phosphates. In SCAPIS, our metabolomics analysis confirmed previous findings^48^ of an association between the A allele and lower plasma myo-inositol (P = 1.2 × 10^−6^; Supplementary Table 12). A. butyriciproducens is a strictly anaerobic, butyric acid-producing bacterium and has been implicated in mouse models as a potentially beneficial agent for cognitive function, Alzheimer’s disease pathology and Parkinson’s disease^49^. Another gene in the locus is ARHGAP17 encoding the RhoGTPase-activating protein 17, known to be involved in the maintenance of tight junctions and vesicle trafficking. Arhgap17-deficient mice have increased intestinal permeability and impairment of the mucosal layer compared to wild-type mice in a colitis model^50^. Our findings provide evidence for a genetic variant in the SLC5A11 locus affecting the abundance of A. butyriciproducens—a bacterium with potential health-beneficial effects.
Loci associated with microbial functions suggest genetic links to microbial carbohydrate and amino acid catabolism
We investigated associations between host genetic variation and 117 previously curated functional modules representing different aspects of microbial metabolism^51^ and microbial functions implicated in the gut–brain axis^52^. No study-wide significant findings were identified. Using the genome-wide significance threshold, we found that 11 candidate genetic loci, including CYP7A1 and EGFR, associated with 11 microbial functions, most related to carbohydrate and amino acid catabolism (Supplementary Table 18).
Discussion
We have identified and replicated a human genetic variant associated with gut microbiome richness at genome-wide significance: the OR51E1–OR51E2 locus. We further report 15 study-wide and 149 genome-wide significant associations of genetic variants with individual microbial species, where the 15 study-wide associations represent eight loci and 14 species. Of these 15, 11 were replicated in an external sample using strict criteria and the remaining four were nominally significant. The eight loci included the well-known ABO and LCT loci, the previously suggested FUT2 and five new loci (MUC12, CORO7–HMOX2, SLC5A11, FOXP1 and FUT3–FUT6). Our findings expand considerably our understanding of the host genetic regulation of the microbiome composition and point toward the importance of key gastrointestinal physiological mechanisms in microbiome regulation. Identified variants were located near or in genes linked to gastrointestinal physiology, such as enteroendocrine fatty acid chemosensing, bile composition, mucosal composition and presentation and secretion of cell surface glycans.
The strengths of this study include harmonized bioinformatic processing across cohorts, strict Bonferroni adjustment of the genome-wide threshold to limit false positives and consistent replication in the Norwegian HUNT study. Limitations include the focus on participants of European ancestry, mainly from Nordic countries, restricting generalizability and limited power to detect associations with rare variants or less prevalent microbial species. All study-wide associations were for species present in at least 27% of participants, whereas most gut species are less common. Another limitation was incomplete genomic coverage downstream of MUC12 on Chr. 7 in the reference genome used for genotyping, which hindered exploration of that locus. As in most GWAS, identifying causal genes remains challenging.
Future work should address these limitations and clarify causal pathways linking host genetics and the microbiome. We expect larger GWAS to continue highlighting genes related to gastrointestinal physiology and to factors known to shape the microbiome, such as antibiotics, cardiometabolic medication and diet^53–55^. They may also uncover more species–locus associations, as suggested by our 149 genome-wide findings, where several loci were linked to several species. In conclusion, our study advances understanding of the host genetic determinants of gut microbiome composition and highlights gastrointestinal physiology as a key driver.
Methods
Ethical considerations
The current study has been approved by the Swedish Ethical Review Authority (DNR 2022-06137-01, DNR 2024-01992-02). All participants in the respective studies below provided written informed consent. The Swedish Ethical Review Board approval numbers are: SCAPIS (DNR 2010-228-31M), SIMPLER (DNR 2009/2066-32, DNR 2009/1935-32, DNR 2010/0148-32, DNR 2014/892-31/3), MDC (DNR 532/2006, DNR 51-90) and MOS (DNR 2012-594). The PPP-Botnia study received approval from the Ethics Committee of Helsinki University (approval number 608/2003). The HUNT study was approved by the local ethical review board (Regional committee for medical and health research ethics, Central Norway; REK-656785).
Discovery studies
SCAPIS
SCAPIS^56^ is a multicenter cohort comprising 30,154 people aged 50–65 years. For this analysis, 8,733 participants of European ancestry from the Malmö and Uppsala sites with both gut microbiome and genotype data were included. At baseline, participants provided blood samples during the first visit and were asked to collect stool samples at home, storing them at −20 °C until samples were brought to the study center at the second visit for storage at −80 °C. DNA extracted from whole blood was used for genotyping. Birth year and sex were obtained from the Swedish population register. Information on dispensed antibiotics (Anatomical Therapeutic Chemical code J01) in the past 6 months was obtained from the Swedish Prescribed Drug Register. BMI was defined as weight divided by height squared (kg m^−2^). Habitual alcohol and fiber intakes were estimated from a food frequency questionnaire (g day^−1^)^57^. Smoking behavior was assessed using a questionnaire and defined as current, former and never smoker.
SIMPLER-Västmanland and SIMPLER-Uppsala
The Swedish Infrastructure for Medical Population-Based Life-Course and Environmental Research (SIMPLER; https://www.simpler4health.se/w/sh/en) includes data from two large, ongoing population-based studies: the Cohort of Swedish Men (COSM) and the Swedish Mammography Cohort (SMC)^58^. The COSM initially enrolled 48,850 men born between 1918 and 1952 living in Västmanland and Örebro counties in 1997. The SMC enrolled 66,651 women by sending invitations to all women born between 1914 and 1948 living in Uppsala and Västmanland counties between 1987 and 1990. The current analysis is based on a subsample selected randomly from these studies who were invited for clinical examination with genotype and gut microbiome data: SIMPLER-Västmanland (SIMPLER-V) and SIMPLER-Uppsala (SIMPLER-U). SIMPLER-V includes 4,515 COSM and SMC participants from Västmanland examined between 2010 and 2019. SIMPLER-U includes 981 women from the county of Uppsala, examined between 2003 and 2009 (no stool collected) and re-examined between 2015 and 2019 (stool collected). Participants were asked to collect stool samples at home and store them at −20 °C until they were brought to the test center, where samples were stored at −80 °C. For 115 SIMPLER-V participants, the examination was conducted at home. DNA for genotyping was extracted from whole-blood samples. Information on dispensed antibiotics in the past 6 months was obtained from the Swedish Prescribed Drug Register.
Malmö offspring study
The Malmö offspring study (MOS) includes participants aged ≥18 years who are children or grandchildren of participants from the Malmö Diet and Cancer Study (MDC)—cardiovascular cohort, a subset of the larger MDC^59^. Data collection in MOS began in 2013 and included 4,721 participants by 2020. The current study included 1,788 participants with genotype and gut microbiome data who attended baseline measurements between 2013 and 2017. Stool samples were collected and stored in home freezers (−20 °C) until they were brought to the study sites, where they were stored at −80 °C in the biobank. DNA for genotyping was extracted from whole-blood samples. Demographic information was collected using a questionnaire. Antibiotic use was self-reported and was also derived from the Swedish Prescribed Drug Register. Participants who were also part of SCAPIS were excluded from the MOS data.
Replication cohort
Norwegian Trøndelag Health Study
The Trøndelag Health (HUNT) study is a long-term population-based health investigation conducted in the Trøndelag county, Norway^60,61^. Four surveys have been used to collect data and biological samples from participants between 1984 and 2019. Approximately 230,000 people have participated in at least one survey. Of these, around 88,000 participants have undergone genotyping^62^. Among the 56,042 participants in the HUNT4 survey, 13,268 submitted stool samples for gut microbiome analysis on a filter paper. We included data from 12,652 HUNT4 participants of European descent having both genetic and gut microbiome data available. Sequencing and bioinformatic processing were performed analogously to SCAPIS and MOS at Cmbio (Copenhagen, Denmark).
BMI and age distribution were compared between studies with density plots. A map depicting the study sites was generated with the maps v.3.4.2.1 R package. Other studies (MDC, PPP-Botnia) are described in the Supplementary Note.
Genetic analysis
Genotyping and imputation
DNA extraction, genotyping, pre-imputation quality control and imputation were performed separately in each cohort (SCAPIS, SIMPLER, MOS and HUNT) using high-density Illumina genotyping arrays and standard pipelines for variant calling and quality filtering. Quality control steps removed samples with poor genotyping quality, sex discrepancies, non-European ancestry and markers with high missingness or implausible allele frequencies. Imputation was performed using standard algorithms (EAGLE, minimac, PBWT) at established imputation servers against the Haplotype Reference Consortium (HRC) r1.1 panel. Detailed protocols for each cohort are provided in the Supplementary Note.
Validation of genotypes using Sanger sequencing
Direct genotyping using Sanger sequencing was performed to confirm the variants in rs10836441 (OR51E1–OR51E2 locus) and rs4556017 (MUC12 locus). Details are given in the Supplementary Note.
Stool DNA extraction and metagenomic sequencing
SCAPIS, MOS and HUNT
Stool DNA extraction and quality control for SCAPIS and MOS were performed by Cmbio and described in Sayols-Baixeras et al.^63^. In brief, samples were randomized on the box level, and DNA was extracted using the NucleoSpin 96 Soil extraction kit (Macherey–Nagel). DNA extraction quality was evaluated using agarose gel electrophoresis. One negative and one positive (mock) control were added to each batch. DNA was quantified with fluorometric techniques both after DNA extraction and after library preparation. DNA extraction and quality control in samples from HUNT have been described in detail in Grahnemo et al.^64^. In brief, three 6-mm disks were punched out from each filter card into a well. DNA was isolated using the Microbiome MagMAX Ultra kit (Thermo Fisher Scientific) after bead-beating. For all three studies, genomic DNA was fragmented and used for library construction using the NEBNext Ultra Library Prep Kit from Illumina. The prepared DNA libraries were purified and evaluated for fragment size distribution. Libraries from stool DNA were sequenced using the Illumina Novaseq 6000 instrument using 2 × 150-base-pair paired-end reads, generating on average 26.0, 25.3 and 22.9 million read pairs, respectively, in SCAPIS, MOS and HUNT, with 97.8% of the sequenced bases having Phred quality score >20 in SCAPIS and MOS, and more than 85% had a Phred quality score ≥30 in HUNT.
SIMPLER study
SIMPLER stool samples were thawed, a pea-size amount was aliquoted, and 800 µl of DNA/RNA Shield (Zymo Research) was added. These aliquots were refrozen and sent to the Centre for Translational Microbiome Research at the Karolinska Institute in Stockholm, Sweden for DNA extraction and metagenomic sequencing. DNA was extracted with the MagPure Stool kit (Magen Biotechnology). Each batch had one negative (DNA/RNA Shield) and one positive control (Zymo mock). Stool DNA was fragmented and used for library construction using the MGI Easy FS DNA Library Prep Set kit. The prepared DNA libraries were evaluated with a TapeStation D1000 kit (Agilent), and the quantity was determined by QuantIT HighSensitivity dsDNA Assay on a Tecan Spark (Tecan). Equimolarly pooled libraries were circularized using the MGI Easy Circularization kit (MGI Tech) and sequenced using 2 × 150 bp paired-end reads on the DNBSEQ G400 or T7 sequencing instrument (MGI) with an average yield of 51 million reads/sample.
Microbial taxonomic profiling
Read pairs mapped to the human reference genome GRCh38.p14 were removed using Bowtie2 (v.2.4.2)^65^ in SCAPIS, MOS and HUNT, and against GRCh38 using Kraken 2 (ref. ^66^) in SIMPLER. Remaining bioinformatic processing, calculation of relative abundances and microbial taxonomic annotation were performed for all studies, including HUNT, at Cmbio using the CHAMP profiler based on the Human Microbiome Reference HMR05 catalog^12^ (Supplementary Note). The taxonomic annotation was based on the Genome Taxonomy Database (GTDB) release 214 (release date: 28 April 2023). A rarefied species abundance table was produced by random sampling, without replacement, of 190,977 gene counts per sample in SCAPIS and MOS, and 641,964 gene counts per sample in SIMPLER. In total, 4,248 species were detected in the rarefied data in SCAPIS, 3,430 in MOS and 4,192 in SIMPLER-V, and 3,523 in SIMPLER-U. The alpha diversity measures—Shannon index, inverse Simpson index and richness—were calculated using rarefied data with the diversity function of the vegan R package (R v.4.3.1). Only the 921 species with prevalence >5% in all four studies were kept for the species-level analyses. Those detected in fewer than 50% of samples in at least one cohort based on nonrarefied data were converted into a binary present/absent variable. Those detected in more than 50% of samples in all four studies were rank-based inverse normal (RIN) transformed. Alpha diversity measures were also RIN-transformed, and, for significant findings, were also analyzed on a nontransformed scale for increased interpretability. The RIN transformation was performed separately for each cohort.
Analysis of scRNA-seq data
Gene expression data in cells derived from human duodenum, ileum and colon were obtained from Hickey et al.^22^, and mean gene expression was generated per their annotated clusters. The expression in EECs from human duodenal and ileal organoids was assessed as described^23^. Briefly, a yellow fluorescent protein was inserted downstream of the Chromogranin A promoter by CRISPR–Cas9 to label EECs. Fluorescent EECs were then isolated using flow cytometry and analyzed by 10× scRNA-seq. Gene expression in EECs from the murine gastrointestinal tract was analyzed with scRNA-seq, as described in Smith et al.^24^.
Statistical analysis
GWAS of microbiome composition
GWAS was performed separately for microbial alpha diversity and 921 species using REGENIE^67^ v.3.3 for each cohort (SCAPIS, SIMPLER-V, SIMPLER-U, MOS). A subset of the genotype datasets was created for the first REGENIE step to fit whole-genome regression models including only quality-controlled directly genotyped SNPs with MAF > 1% and Hardy-Weinberg equilibrium P < 1 × 10^−15^. For the second step, all variants with an information score >0.7 were included in association analyses performed using logistic regression for binary variables and genetic variants with MAF > 5% in all four cohorts, and linear regression for RIN-transformed variables and genetic variants with MAF > 1% in all four cohorts. Covariates were sex, age, age2, plate and genetic principal components (PC) 1–10. The PCs were calculated in unrelated samples, separately for each cohort, with PLINK^68^ using an LD-pruned dataset, and all samples were then projected onto these components. In SCAPIS and MOS, plate represents metagenomics DNA extraction plate, whereas in SIMPLER it means the metagenomic aliquoting plate. Plate, age and sex were included to increase precision and power. For SCAPIS, the site was accounted for by the plate variable because plates were nested into the site variable. Based on previous nonlinear associations between age and microbiome^69^ and our results from a naive linear model for the association between age and microbial species, we opted to include age also as age^2^. REGENIE accounts for population stratification, but to account for any residual bias, we also included genetic PCs 1–10 in the model^70^. Cohort-specific results were meta-analyzed using the inverse-variance weighted fixed-effects method in METAL^71^ v.2011-03-25. Independent loci were determined using LD clumping (r^2^ 0.001, window 10 Mb) in PLINK^68^ v.2.00-alpha-5-20230923 with SCAPIS dosages used to determine the correlation structure. Variant-alpha diversity associations with P < 1.7 × 10^−8^ and variant-species associations with P < 5.4 × 10^−11^ were considered study-wide-significant. This threshold was based on a Bonferroni correction of the conventional genome-wide threshold of 5 × 10^−8^ for three alpha diversity metrics and 921 species tested. Confidence intervals for the I^2^ statistic were calculated using the metagen function of the meta v.6.5-0 R package. The loci were annotated using the Open Targets Genetics^72^ v.22.10 database (variant index, variant to gene and variant to trait annotations). Heritability was determined using SumHer^73^ v.6 according to the GCTA heritability model, with SCAPIS dosages used to determine the correlation structure.
Sensitivity analyses
Sensitivity analyses were performed for the 149 genome-wide locus-species associations by (1) excluding participants with antibiotic use in the 6 months before sampling, (2) excluding participants with self-reported IBD, (3) retaining an unrelated subset where no participant had third degree relatedness or closer with any other participant using a KING-robust kinship estimator threshold of 0.0442, (4) retaining one random spouse in SIMPLER and one random participant living at the same address in MOS to assess cohabitation (SCAPIS was removed for this analysis), (5) using centered log ratio plus RIN transformation for species analyzed using linear regression, (6) using Firth correction for species analyzed using logistic regression, (7) removing age^2^ from the covariates, (8) analyzing SCAPIS-Uppsala and SCAPIS-Malmö as two separate cohorts in the meta-analysis and (9–12) adding BMI, alcohol intake, smoking or fiber intake, respectively, as covariates. The analyses adding alcohol, smoking and fiber were performed in SCAPIS only, where data on these variables were nearly complete.
External replication
Associations passing the study-wide threshold were assessed in HUNT by applying the same models as in the Swedish cohorts and using REGENIE with the same model specifications. We further assessed the validity of our findings using summary statistics from the published FINRISK^9^ and Dutch Microbiome Project^7^ studies. Details are given in the Supplementary Note.
GWAS of higher taxa
We also performed GWAS of 455 genera, 106 families, 50 orders, 21 classes, 17 phyla and 3 superkingdoms. Relative abundances were created for these higher-level taxa by summation of their respective species-level relative abundances. The 364 taxa detected in 5–50% of samples in each cohort were analyzed using logistic regression (absence/presence), and 288 taxa with prevalence >50% were analyzed using RIN-transformed relative abundances and linear regression. Study-wide significance was considered at P < 5.4 × 10^−11^, the same level as for species.
GWAS of functional modules
Functional gut metabolic and gut–brain modules were attributed to species that contained at least two-thirds of the genes needed for the functionality of that module. If an alternative reaction pathway within a module existed, only one such pathway was required. All reaction pathways were required for modules with fewer than four steps. Module abundances were defined as the sum of the relative abundances of all species in a module. Similar to the GWAS of the species, two modules detected in 5–50% of samples in each cohort were analyzed using logistic regression (absence/presence) and 115 modules with prevalence >50% were analyzed using RIN-transformed relative abundances and linear regression. Study-wide significance was considered at P < 4.3 × 10^−10^.
Interaction analysis for ABO, secretor status and Lewis blood groups
Blood groups A, B, AB and O were determined based on allele combinations of ABO genetic variants rs505922 and rs8176746 (ref. ^74^), secretor status based on FUT2 genetic variant rs601338 (ref. ^75^) and Lewis status (positive, negative) based on allele combinations of FUT3 variants rs812936, rs28362459 and rs3894326 (ref. ^75^). Blood groups A and AB were combined into antigen A, and blood groups B and AB into antigen B. Mixed models were run for each cohort with species associated with ABO, FUT2 or FUT3–FUT6 at the study-wide significance level as outcome using the lmer (for species assessed with linear regression in the GWAS) and glmer (for species assessed with logistic regression in the GWAS) functions of the lmerTest v.3.1-3 R package. The interaction between antigen (ABO A, B or Lewis) and secretor status was estimated with covariates sex, age, age^2^, plate and genetic PCs 1–10. First-degree relatedness, determined by KING^76^ kinship coefficient ≥0.177, was used as a random effect. For the logistic mixed models, random and fixed effects coefficients were optimized in the penalized iteratively reweighted least squares step (setting nAGQ = 0). Cohort-specific results were meta-analyzed with the rma function of the metafor v.4.4-0 R package using the fixed-effect inverse-variance weighted method. Study-wide significance was considered at Bonferroni-corrected P < 3.3 × 10^−3^.
GWAS of GLP-1
After overnight fasting, GLP-1 levels were measured in MDC and PPP-Botnia study participants (Supplementary Note) before and 2 h after a 75-g oral glucose load. GWAS of GLP-1 was performed in 2,588 people with fasting and 2,613 with 2-h GLP-1 in MDC, and in 926 people with fasting and 898 with 2-h GLP-1 in PPP-Botnia. GLP-1 levels were log-transformed before analysis. SNPTEST^77^ v.2.5.6 was used for genome-wide association analyses, using the frequentist score method adjusted for age, sex and the genetic PC1-4. Results were filtered based on MAF > 0.01, Hardy-Weinberg equilibrium P > 5 × 10^−7^, and imputation info scores >0.4. A fixed-effect meta-analysis was performed using GWAMA^78^.
Functional mapping
Genetic variants associated with microbial alpha diversity or species at the genome-wide significant level were mapped to functional pathways using FUMA^26^ v.1.5.2. One (out of 2,353) variant without an rsID was removed. If a genetic variant was associated with several traits or was multiallelic, the trait or allele pair with the lowest P was used as input.
Colocalization
Pairwise colocalization analyses were performed to investigate whether microbial richness and the eight study-wide significant species colocalized in the identified study-wide significant loci and with sex hormone binding globulin, WHRadjBMI, LDL cholesterol, IBD, glucose and stool frequency. Details are provided in the Supplementary Note.
Mendelian randomization
We performed two-sample MR analyses to investigate bidirectional effects between specific species (C. saudiense, T. sanguinis, Intestinibacter sp9005540355) and BMI, WHR and LDL cholesterol. Details are provided in the Supplementary Note.
Plasma metabolomics
The plasma metabolomics analysis in SCAPIS has been described elsewhere^79^ and in the Supplementary Note. Associations of genetic variants with plasma metabolites were analyzed using the same REGENIE pipeline as for the microbiome, adjusting for age, age^2^, sex, delivery batch and genetic PCs 1–10. Metabolites detected in fewer than 100 samples were excluded. Those detected in 5–50% of samples were analyzed by logistic regression, and those in ≥50% of samples were RIN-transformed and analyzed by linear regression. We report one lead SNP per study-wide locus; when several species were associated, we selected the lead SNP among those replicated in HUNT, prioritizing the lowest P value in Swedish cohorts. FDR correction (Benjamini–Hochberg) of 5% was applied.
Stool metabolomics
To find stool metabolites associated with the study-wide significant loci, we downloaded GWAS of stool metabolites summary statistics (only P < 10^−5^ available) from Zierer et al.^80^ (Supplementary Table 16) and lifted the genomic coordinates over to GRCh37 using Ensembl Variation 112 for variants with an rsID and https://genome.ucsc.edu/cgi-bin/hgLiftOver for variants without an rsID. Genetic variants that could not be lifted over were removed (247 out of 46,765). We assessed the same lead variants per study-wide locus as described for the genetic association with plasma metabolites. A lookup was performed for genetic variants within 100 kb of the locus region corresponding to the study-wide significant lead variant.
Short-chain fatty acids
In MOS, a panel of nine plasma SCFAs was measured^81^. Laboratory method for SCFA measurement is described in the Supplementary Note. The association of genetic variants with SCFAs was assessed with the same REGENIE pipeline as described above for the microbiome, with age, age^2^, sex, SCFA measurement batch and genetic PCs 1–10 as covariates. SCFAs were RIN-transformed and assessed using linear regression. We assessed the same lead SNPs per study-wide locus as described for the genetic association with plasma metabolites. FDR correction (Benjamini–Hochberg) of 5% was applied.
Reporting summary
Further information on research design is available in the Nature Portfolio Reporting Summary linked to this article.
Online content
Any methods, additional references, Nature Portfolio reporting summaries, source data, extended data, supplementary information, acknowledgements, peer review information; details of author contributions and competing interests; and statements of data and code availability are available at 10.1038/s41588-026-02512-2.
Supplementary information
Supplementary InformationSupplementary Note Reporting Summary Peer Review File Supplementary TablesSupplementary Tables 1–18.
The reference list from the paper itself. Each links out to its DOI / PubMed record.
- 1Mbatchou, J. Could regenie distinguish quantitative and binary covariates automatically? #61 Git Hubhttps://github.com/rgcgithub/regenie/issues/61#issuecomment-735800868 (2020).
- 2Lundmark, P. Mol Epic UU/GWAS_scripts: v 1.0-Nat Gen. Zenodo 10.5281/zenodo.16947117 (2025).
- 3Dekkers, K. F. Mol Epic UU/GWAS_microbiome: v 1. Zenodo 10.5281/zenodo.16925644 (2025).