Development of a 3D-Printed Capacitive Sensor for Soil Water Content Estimation Using Nickel-Based Conductive Paint
Alessandro Comegna, Shawkat B. M. Hassan, Antonio Coppola

TL;DR
A low-cost 3D-printed capacitive sensor was developed to accurately estimate soil water content, offering a reliable and affordable alternative to existing methods.
Contribution
The novel use of 3D printing and nickel-based conductive paint to create a cost-effective capacitive sensor for soil water content estimation.
Findings
The sensor demonstrated consistent and reliable performance within a soil water content range of 0 to 0.40 cm³/cm³.
The device's performance was validated against the reference TDR method and showed acceptable accuracy.
The sensor is suitable for distributed monitoring and IoT-based environmental applications.
Abstract
What are the main findings? Development of a low-cost capacitive sensor.Consistent and reliable performance. Development of a low-cost capacitive sensor. Consistent and reliable performance. What are the implications of the main findings? It is possible to build the device on one’s own.The device is suitable for monitoring soil water content with acceptable accuracy. It is possible to build the device on one’s own. The device is suitable for monitoring soil water content with acceptable accuracy. Understanding hydrological, agricultural, and environmental processes in soils relies on accurately measuring volumetric water content (θ), matric potential (h), and hydraulic conductivity (K). These parameters are fundamental for quantifying plant-available water, optimizing irrigation scheduling in precision agriculture, modeling watershed responses, and studying the impacts of climate…
Genes, proteins, chemicals, diseases, species, mutations and cell lines named across the full text — each resolved to its canonical identifier and authoritative record.
Click any figure to enlarge with its caption.
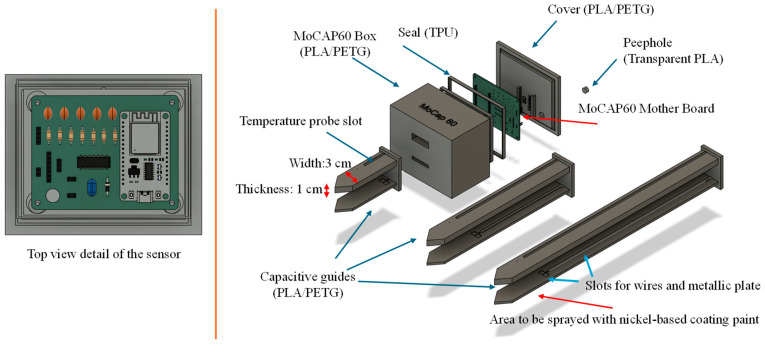 Figure 1
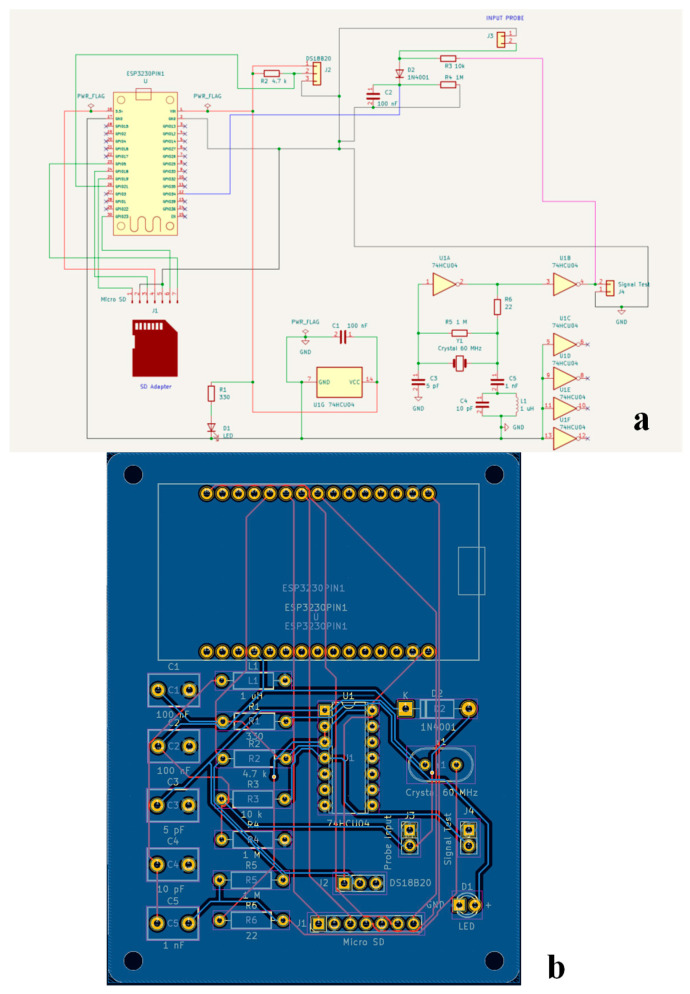 Figure 2
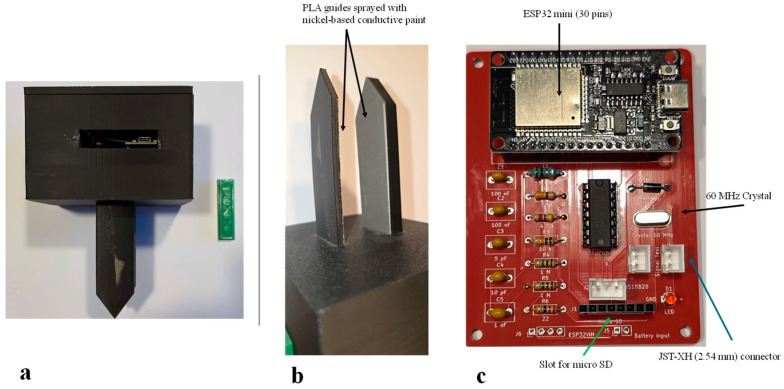 Figure 3
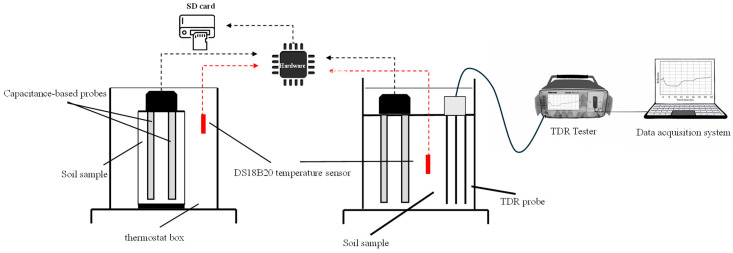 Figure 4
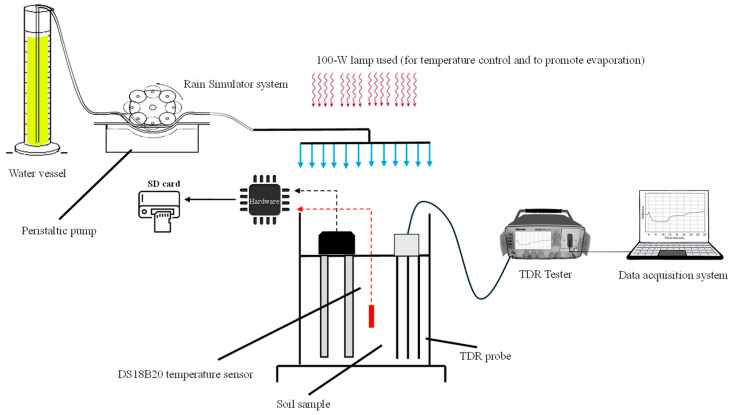 Figure 5
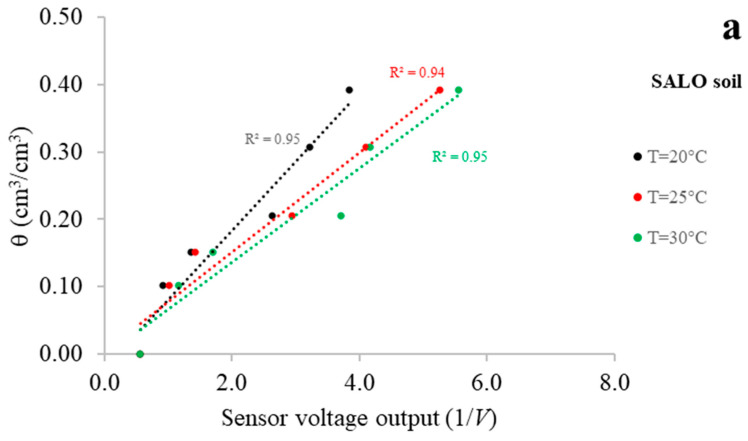 Figure 6
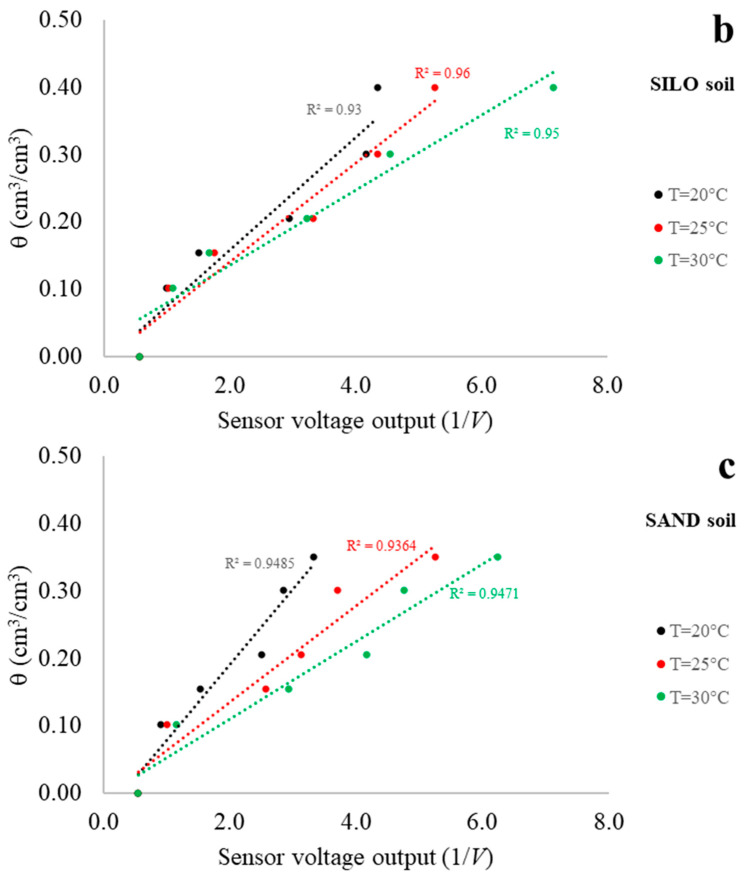 Figure 7
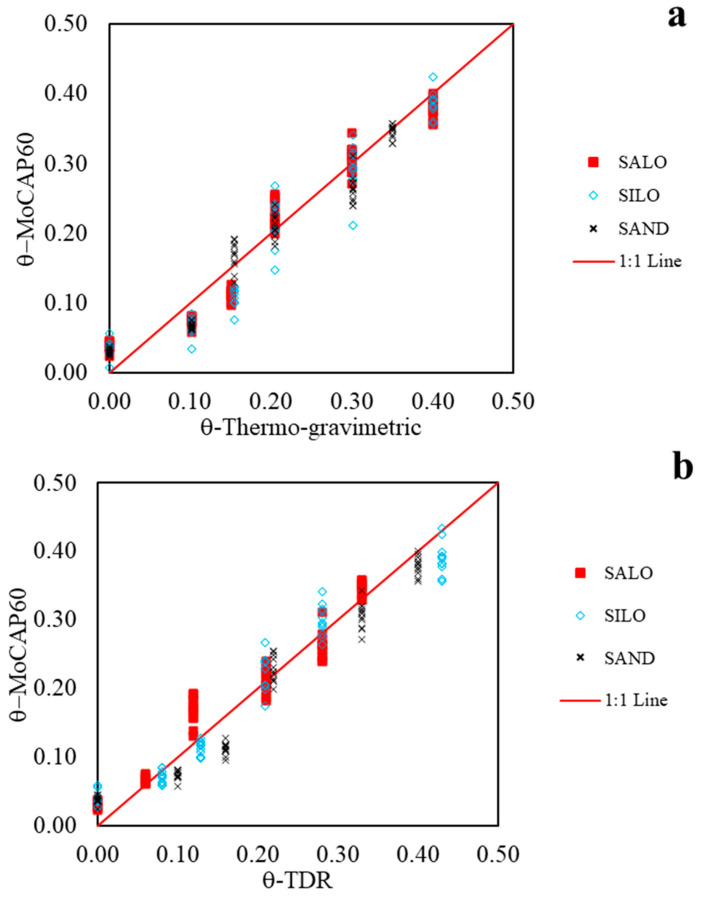 Figure 8
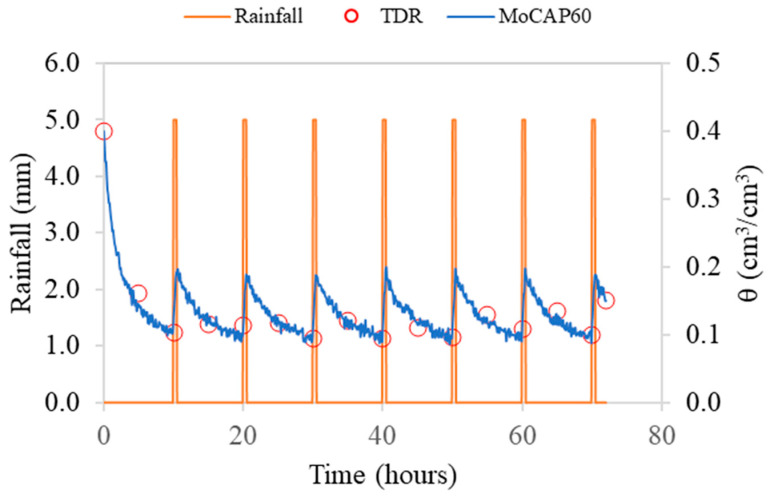 Figure 9
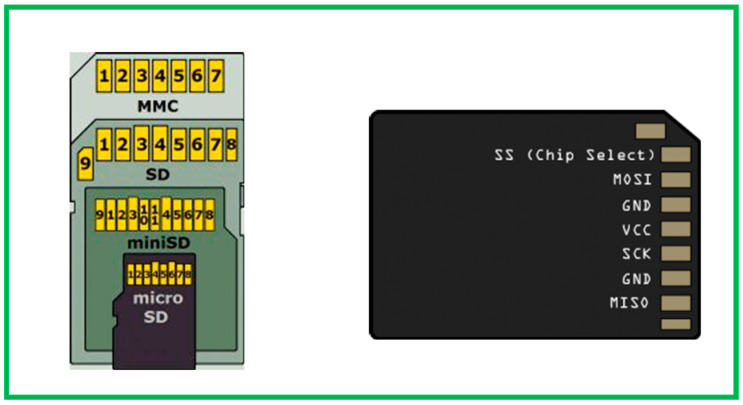 Figure 10
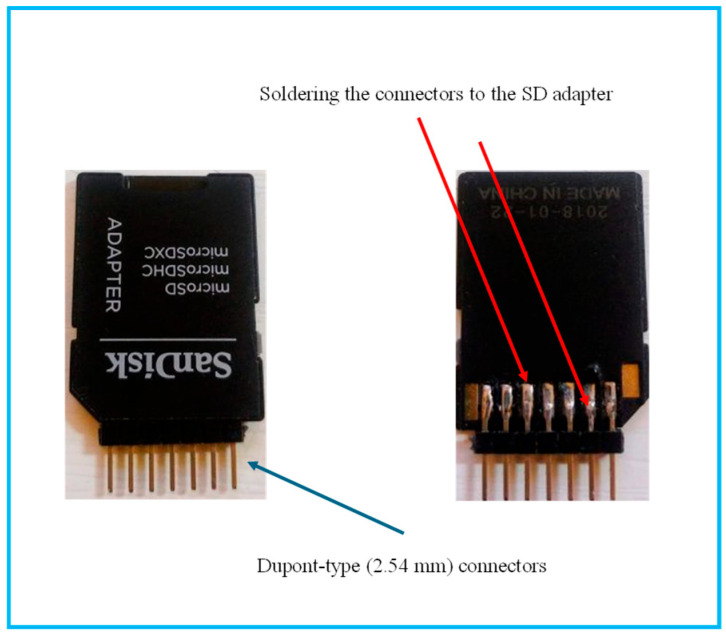 Figure 11
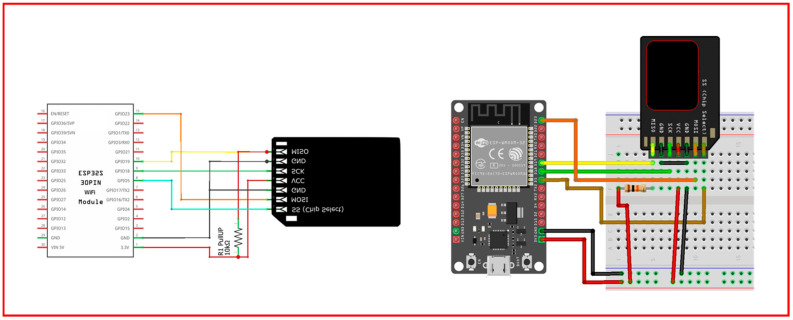 Figure 12
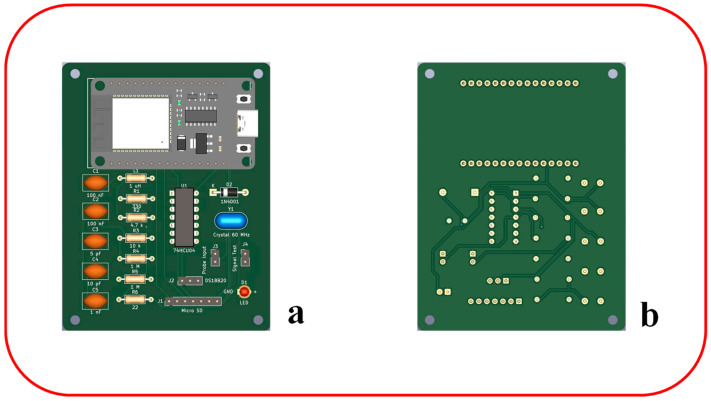 Figure 13
Peer Reviews
No public reviews on file for this paper yet. If you reviewed it on a platform where reviews are public (OpenReview, ICLR, NeurIPS, ICML), you can paste yours below so the community can read it here.
Videos
No videos yet. Explain this paper in a talk, walkthrough, or lecture? Add one.
Taxonomy
TopicsSoil Moisture and Remote Sensing · Soil Geostatistics and Mapping · Soil and Unsaturated Flow
1. Introduction
The volumetric water content (i.e., volume of water in the soil/total volume of the soil) represents one of the most informative variables for describing the physical state of soils. Its measurement is crucial for interpreting how water is stored, transported, and made available to plants, and it plays a central role in applications ranging from irrigation management to the evaluation of environmental impacts. Without reliable θ data, the understanding of key hydrological processes remains incomplete [1,2,3,4,5,6,7,8].
The measurement of θ has evolved significantly in the last few decades, with a prominent shift from direct, destructive methods (e.g., gravimetric sampling) towards indirect, automated sensing techniques. Among such techniques, capacitive sensors have gained widespread adoption, especially in recent years [9,10,11,12,13]. These sensors operate by measuring the soil’s dielectric permittivity, which is predominantly influenced by water content, to estimate θ [14,15,16]. Their popularity stems from a favorable balance between cost, robustness, and accuracy, making them suitable for integration into distributed sensor networks [17,18,19]. Recently, the drive for extensive spatial monitoring has catalyzed a low-cost approach in sensor development [20,21,22]. This paradigm focuses on leveraging open-source hardware, simplified electronics, and Internet of Things (IoT) communication protocols to create affordable, yet reliable, monitoring systems [23,24]. While these low-cost capacitive sensors may initially present challenges related to calibration and soil-specific sensitivity, ongoing technological refinements such as operating at higher frequencies to mitigate salinity effects are steadily enhancing their performance [25,26,27,28]. Various studies have also indicated that these effects are substantially minimized when capacitive sensors operate in soils with temperatures of 15–30 °C and soil solution EC_w_ under roughly 10 dS/m [13,15,29,30,31,32]. Nevertheless, capacitive sensors still require proper calibration and careful management to maintain measurement accuracy under variable environmental conditions and to ensure long-term system reliability, particularly in remote or harsh settings [2,33,34,35,36].
In the present paper the aim of our research was to design and implement a compact capacitive-based sensor for soil water content measurements. The sensor, namely MoCap60 (Moisture Capacitive 60 MHz), offers an innovative low-cost solution for real-time monitoring of θ, delivering reliable and accurate measurements. The sensor integrates low-power wireless technology designed for extended field operation, providing a cost-effective measurement system suitable for large-scale environmental monitoring. To avoid classical measurement problems, we chose an operational frequency of 60 MHz, which is particularly suitable for measurements in soils, as in the range of approximately 50–100 MHz, the effects of temperature and salinity are significantly reduced [37]. Furthermore, at this frequency, the dielectric dispersion effect, which may affect soils containing moderate to high amounts of clay minerals, is also less pronounced [38,39,40].
The MoCap60 sensor can be easily assembled, as its structural components are produced through 3D printing technology. Two plastic guides, once coated with a nickel-based conductive paint, serve as capacitive electrodes. This paper presents the design and implementation of the proposed MoCap60 sensor and provides detailed information on the series of laboratory-controlled tests carried out to calibrate and validate the device using three soils with different textures.
2. Materials and Methods
2.1. Hardware Description
The MoCap60 sensor consists of: (i) an ESP32 mini microcontroller board (Espressif, Shanghai, China); (ii) a pair of 3D-printed plastic guides coated with nickel-based conductive paint (841AR–Super Shield™ Nickel Conductive Coating, MG chemicals, Burlington, ON, Canada), which form the electrodes for soil moisture estimation; (iii) a waterproof DS18B20 temperature sensor (Dallas Semiconductor, Dallas, TX, USA) used as a reference; and (iv) a microSD module for data storage.
Figure 1 shows the sensor as it appears after being manufactured with a 3D printer.
The accessory capacitive guides (for measurements at –5 cm, –15 cm, and –30 cm below the soil surface) are also displayed. These guides (3 cm wide and 1 cm thick) are designed to also hold the temperature sensor, which is required since capacitive sensing is known to be temperature-dependent.
The capacitive electrodes can be positioned at different depths, and both guides must be coated with the conductive paint. Before applying the paint, the capacitive system must be wired using two leads (model type AWG30), each soldered to a stainless steel plate of specific dimensions (6 mm × 7 mm), which are then inserted into the dedicated slots built into the guides. The electronic components are placed inside a waterproof box while a TPU seal ensures complete water-proofing of the sensor.
Preliminary tests were performed to verify that the coating thickness and application method did not introduce measurable alterations in sensor response. The paint layer was applied uniformly and kept as thin as possible to avoid affecting the sensor geometry and electrical field distribution. Within the tested conditions, no significant differences in sensor output were observed.
As introduced earlier, the MoCAP60 sensor’s capacitive module operates with a 60 MHz oscillator. This frequency is generated by a Pierce-type oscillator circuit integrated into the sensor, which uses a quartz crystal. In addition to the crystal, the circuit incorporates resistors, capacitors, and inductors, together with a digital inverter, allowing the crystal to oscillate at the third overtone frequency, ensuring stable and precise operation [41].
The MoCAP60 sensor measures changes in the dielectric properties of the soil, which are directly related to the θ values. When the water content in the soil changes, the dielectric constant of the soil changes accordingly, which alters the capacitance between the sensor electrodes. This capacitance variation is converted into a voltage output (V_out_) by the sensor’s internal circuitry.
The general relationship between the volumetric water content θ and can be expressed as:
where and are soil-dependent calibration coefficients. Equation (1) can be modified by also accounting for the temperature factor as follows:
where c is the temperature compensation coefficient, and is the reference temperature (e.g., 25 °C).
Figure 2a,b present the electrical wiring layout and the two-layer printed circuit board (PCB) of the MoCAP60 sensor, which was designed and implemented using the KiCad software platform (vers 8.0, https://www.kicad.org/).
A detailed list of the components used to assemble the sensor, also known as the Bill of Materials (BOM), is provided in Table 1. Detailed information on the MoCAP60 sensor, including the source code (see file MoCAP60.ino) controlling its hardware, is provided in the Supplementary Material accompanying this paper.
The device is also equipped with an external microSD card slot for storing measurements (see Appendix A for further information on this aspect). The MoCAP60 device can be powered either by a Li-ion battery (e.g., 3.7 V, 1000 mAh) or via a USB-C cable. Figure 3a–c show the main components of the sensor and the two-layer PCB, fully assembled with the electronic components previously listed in Table 1.
Comprehensive documentation, including the firmware managing MOCAP60′s, hardware functionalities, and details on production costs, is available in Appendix B.
2.2. Soil Properties and Experimental Setup
To assess the calibration, validation, and performance of the MoCAP60 sensor, three sets of experiments (labeled as exp#1, exp#2, and exp#3) were carried out. The laboratory tests were conducted on repacked samples prepared from three soils with different textures. Based on the IUSS Working Group WRB (2006) classification [42], the soils corresponded to sand (SAND), sandy loam (SALO), and silty loam (SILO). Their main physical and chemical characteristics are reported in Table 2.
Soil texture was assessed using the method proposed by [43], while bulk density (ρ_b_) was obtained following the approach of [44]. The pH and organic carbon (OC) contents were quantified using the analytical procedures reported by [45,46]. The electrical conductivity of the water used throughout the experiments was 0.17 dS m^−1^, as measured with a Cyberscan 500 conductivity meter.
Exp#1 and exp#2 focused on the calibration and validation of the MoCAP60 capacitive sensor. For these experiments, following a procedure similar to that proposed by [1], the soil samples were oven-dried at 105 °C and sieved at 2 mm. For soil preparation, known amounts of soil and water were mixed together, and then kept for 12 h in sealed plastic bags to prevent any evaporation. Finally, soil was repacked in PVC cylinders (11 cm in height and 20 cm in diameter). Figure 4 illustrates the experimental setup used for these tests.
After preparing the soil samples, the capacitive probes used for θ determination were placed vertically within the soil sample. To minimize water loss throughout the tests, both ends of the PVC cylinders were tightly sealed with plastic film. The experimental procedure involved a comprehensive set of measurements aimed at characterizing the sensor response over a broad moisture range in all three soils, covering θ values from 0 to 0.40 cm^3^/cm^3^. Readings were collected at discrete moisture levels of 0, 0.10, 0.15, 0.20, 0.30, and 0.40.
Considering that capacitive measurements are influenced by temperature [29,47], each test (corresponding to a specific θ level) was carried out while gradually varying the temperature of the soil sample from 20 °C to 30 °C (which is the modal temperature range in many temperate climates) in 1 °C increments inside a thermostatic chamber. During the experiments, the sensor output voltage (V_out_) was continuously recorded. At the same time, the actual volumetric water content was independently quantified using the thermo-gravimetric procedure described by [48]. These datasets were subsequently used to establish the calibration curve linking θ to the measured voltage.
For the MoCAP60 validation (exp#2), a new dataset was prepared for each soil, following the same protocol as used during the calibration phase (i.e., exp#1). In this stage measurements were also taken using the well-proven technology of time domain reflectometry (TDR), exhibiting sufficient sensitivity for characterization of volumetric water content in soils [26,49,50,51,52,53,54,55]. For TDR measurements the Tektronix model 1502C (Tektronix Inc., Baverton, OR, USA) was used, connected to a three-wire probe, with 10 cm long waveguides connected to the tester by a 2-m-long coaxial cable. For these experiments, the MoCAP60 sensor and TDR probes were placed in a soil sample 400 mm high and 300 mm in diameter.
Finally, after calibrating and validating the capacitive module of the sensor, a final test (exp#3) was carried out, with reference to SALO soil, to assess the overall performance of the MoCAP60 device. In exp#3, a drying–wetting cycle with controlled rainfall was performed inside a thermostat box at a constant temperature of 25 °C. During the experiment, θ measurements were recorded over time using both the MoCAP60 sensor and a TDR device (Figure 5). For this test, the sensor probes were inserted into the same cylinder used for exp#2.
The experiment lasted a total of 72 h. Every 10 h, a rainfall event with an intensity of 10 mm h^−1^ was applied for 30 min. The simulated rainfall was uniformly distributed over the soil surface using a rain simulator; evaporation, from the soil surface, was induced with a 100-W lamp. During the test, MoCAP60 and TDR measurements were taken respectively every 6 min and 5 h.
2.3. Performance Assessment of the MoCAP60 Sensor Through Statistical Indices
The performance of the MoCAP60 sensor was assessed using three statistical indicators [56,57]: (i) the mean absolute percentage error (MAE), (ii) the mean bias error (MBE), and (iii) the model efficiency (EF):
where O_i_ is the observed value (i.e., obtained via the thermo-gravimetric method), E_i_ is the prediction or estimated (i.e., via MoCAP60 readings), is the mean of the observed data, and N is the number of observations.
3. Results and Discussion
3.1. Sensor Calibration
With reference to the SALO, SILO and SAND soils, the MoCAP60 sensor calibration results at three selected soil temperatures of 20 °C, 25 °C, and 30 °C are shown in Figure 6.
The outcomes of exp#1 highlight the linear temperature dependence between θ values obtained via the thermo-gravimetric method and 1/V values determined via the MoCAP60 sensor. It should be highlighted that, at a constant 1/V value, θ tends to reduce as temperature rises. In addition, when the soil approaches dry conditions, the temperature-related differences in θ values become less pronounced, reflected by the convergence of the linear fits, because the sensor’s dielectric behavior is increasingly controlled by soil (i.e., solid phase) permittivity [54,58,59,60]. Within the temperature interval used for sensor validation, all soils exhibited comparable patterns. This finding is particularly significant, as it suggests that the capacitive sensor does not require soil-specific calibration for the set of soils examined.
For the sake of completeness, Table 3 presents the estimated coefficients a and b, together with the coefficient of determination (R^2^) of the linear calibration equations for the three soils considered across the entire temperature domain. The high R^2^ values (all above 0.90) confirm the strong relationship between the volumetric water content and the sensor readings.
3.2. Sensor Validation
The validation results of the sensor are illustrated in Figure 7a, where the θ values derived from the linear calibration functions are compared with the reference θ values obtained through the thermo-gravimetric method. Figure 7b compares the MoCAP60 readings with those measured using the TDR technique. Overall, the estimated values align closely with the 1:1 line, confirming the sensor’s reliable performance.
Table 4 shows the key statistical parameters, namely MBE, MAE, and EF, calculated in the temperature-validation range, and across the three soil types. Part (a) of Table 4 refers to the comparison between the measurements obtained with the MoCAP60 sensor and the thermo-gravimetric method, whereas part (b) refers to the comparison between the measurements obtained with the MoCAP60 sensor and those acquired using the TDR technique.
The consistently high EF values, all above 0.90 for the overall performance, indicate a good predictive capability for all soil types.
Regarding the accuracy of the estimates, the MAE values provide a clear measure of average error magnitude. The SAND soil demonstrates the best overall precision with the lowest aggregate MAE (2.58), indicating its estimates are, on average, the closest to the observed values. The SALO soil follows closely, with an overall MAE of 2.7, while SILO has a slightly higher overall error (MAE = 2.98). This pattern is consistent at most individual depths, where SALO frequently achieves the lowest MAE.
An analysis of the MBE, which indicates systematic over- or underestimation, reveals that all models have a very small overall bias, with absolute values below 0.012. The MBE for SALO and SAND is negative overall (−0.0039 and −0.0059, respectively), indicating a negligible tendency to slightly underestimate θ values. SILO has the largest overall negative bias (−0.0116), suggesting a more consistent, though still small, underestimation. It is noteworthy that at 27 °C, the SAND soil type shows a positive MBE (0.0144), which is one of the largest single biases in the dataset.
The statistical parameters confirm that the MoCAP60 device provides a reliable response with respect to the three investigated soils. However, the SALO soil emerges as the most reliably estimated, due to its superior combination of the highest model efficiency (EF = 0.94), lowest overall absolute error (MAE = 2.72), and minimal systematic bias (MBE ≈ −0.004).
3.3. Temperature-Compensated Equations for MoCAP60 Sensor
Finally, from the experimental measurements conducted across the calibration-validation temperature range, temperature-compensated equations were derived to normalize the sensor’s output to a standard reference temperature of 25 °C. These relationships account for the combined effect of sensor output (1/V_out_) and soil temperature (T) on volumetric water content estimation.
The soil-specific calibration functions are:
- -SALO soil:
-SILO soil:
-SAND soil:
Additionally, a general calibration function valid across all three soil types was established:
This general function provides a reliable estimation of volumetric water content regardless of soil type, with a coefficient of determination of R^2^ = 0.87. The consistency among the individual soil equations supports the validity of this generalized approach, which simplifies sensor deployment while maintaining satisfactory accuracy across different soil textures.
3.4. Sensor Performance Under Dynamic-Controlled Conditions
For exp#3, Figure 8 presents the θ measurements recorded by the MoCAP60 sensor during a drying–wetting cycle, with controlled rainfall. TDR measurements were also collected every 5 h (shown as red dots).
The figure illustrates the temporal evolution of θ measured by the MoCAP60 sensor during a controlled drying–wetting cycle, alongside the applied rainfall pulses. Each rainfall event (orange bars) produces an immediate increase in θ values, followed by a gradual decline as the soil dries. The MoCAP60 data (blue line) clearly capture these dynamics, showing consistent response patterns after each irrigation event and during the entire test. The TDR measurements (red circles), taken every 5 h, align well with the MoCAP60 readings, confirming the reliability of the sensor, throughout the entire monitoring period. Overall, the plot highlights the sensor’s ability to track soil moisture variations with high temporal resolution.
4. Conclusions
This study illustrates the development and validation of the MoCap60 device, a new low-cost capacitive sensor designed for real-time monitoring of soil water content. The sensor represents an effective and accessible solution, combining technical innovation with practical applicability.
The sensor’s performance was rigorously evaluated through laboratory tests on three distinct soil types. The results confirmed a high degree of reliability and accuracy, as evidenced by strong linear correlations during calibration and good statistical metrics (MBE, MAE, and EF) calculated during the independent validation phase. A particularly noteworthy finding was the consistent performance across different soils, which suggests that a single, generalized calibration may be sufficient for a wide range of conditions, thereby simplifying the sensor’s deployment.
Furthermore, the MoCap60 sensor effectively tracked dynamic changes in soil moisture during a simulated drying–wetting cycle, showing close agreement with measurements obtained using the TDR technique. This confirms the sensor’s capability for high-resolution monitoring in real-world scenarios. In summary, the MoCap60 sensor fulfills its design objectives, offering a robust, accurate, and affordable tool that is highly suitable for integration into large-scale networks for precision agriculture, irrigation management, and hydrological studies.
The reference list from the paper itself. Each links out to its DOI / PubMed record.
- 1Comegna A. Hassan S.B.M. Coppola A. Development and Application of an Io T-Based System for Soil Water Status Monitoring in a Soil Profile Sensors 202424272510.3390/s 2409272538732831 PMC 11086235 · doi ↗ · pubmed ↗
- 2Comegna A. Hassan S.B.M. Coppola A. Recent Technological Upgrades to the SHYPROM Io T-Based System for Monitoring Soil Water Status Sensors 202525493410.3390/s 2516493440871798 PMC 12390053 · doi ↗ · pubmed ↗
- 3Smith M.W. Patterson D.E. Determining the unfrozen water content in soils by time-domain reflectometry Atmos. Ocean.19842226126310.1080/07055900.1984.9649198 · doi ↗
- 4Spaans E.J.A. Baker J.M. Simple baluns in parallel probes for time domain reflectometry Soil Sci. Soc. Am. J.19935766867310.2136/sssaj 1993.03615995005700030006 x · doi ↗
- 5Spaans E.J.A. Baker J.M. Examining the use of time domain reflectometry for measuring liquid water content in frozen soil Water Resour. Res.1995312917292510.1029/95WR 02769 · doi ↗
- 6Weitz A.M. Grauel W.T. Keller M. Veldkamp E. Calibration of time domain reflectometry technique using undisturbed soil samples from humid tropical soils of volcanic origin Water Resour. Res.1997331241124910.1029/96WR 03956 · doi ↗
- 7Fares A. Abbas F. Maria D. Mair A. Improved Calibration Functions of Three Capacitance Probes for the Measurement of Soil Moisture in Tropical Soils Sensors 2011114858487410.3390/s 11050485822163880 PMC 3231402 · doi ↗ · pubmed ↗
- 8Kim Y. Yang S. Kim W. Io T-based remote monitoring system for soil moisture and temperature measurement Sensors 201818384