Hyperspectral Imaging and Grading of Kiwifruit with Hierarchical 3D Convolution Data Processing
Botao Zhang, Zhipeng Wu, Yingfang Ni, Yuwei Cai, Zhiqiang Guo

TL;DR
This paper introduces a non-destructive method using hyperspectral imaging and a 3D convolutional network to accurately grade kiwifruit based on sugar content.
Contribution
The novel H3DAMNet method combines 3D convolution and attention mechanisms for hyperspectral data to improve kiwifruit grading accuracy.
Findings
The method achieved 97.5% overall accuracy in classifying kiwifruit by sugar content.
It outperforms traditional destructive grading methods with high efficiency and precision.
The approach sets a reference for classifying other fruits using hyperspectral imaging.
Abstract
The taste and quality of kiwifruit are key factors affecting consumers’ purchase intention and satisfaction. As an important indicator for measuring kiwifruit quality, sugar content is crucial for quality grading. Accurate and rapid kiwifruit grading based on sugar content is of great significance for ensuring product quality and enhancing market competitiveness. Traditional grading methods mostly adopt destructive sampling, which are cumbersome, low in efficiency, and difficult to meet the needs of modern large-scale production. Therefore, this paper proposes a kiwifruit classification method based on the Hierarchical 3D Convolution and Attention Mechanism Network (H3DAMNet). This method performs 3D convolution operations on multiple dimensions of hyperspectral data blocks simultaneously to deeply extract spatial–spectral features. It assigns weights to each channel through the channel…
Genes, proteins, chemicals, diseases, species, mutations and cell lines named across the full text — each resolved to its canonical identifier and authoritative record.
Click any figure to enlarge with its caption.
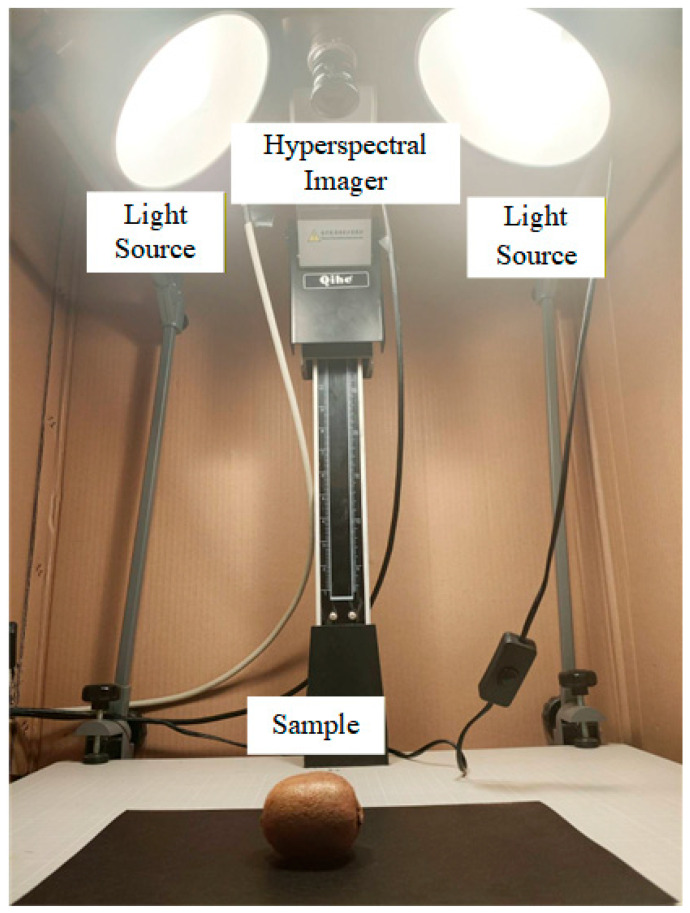 Figure 1
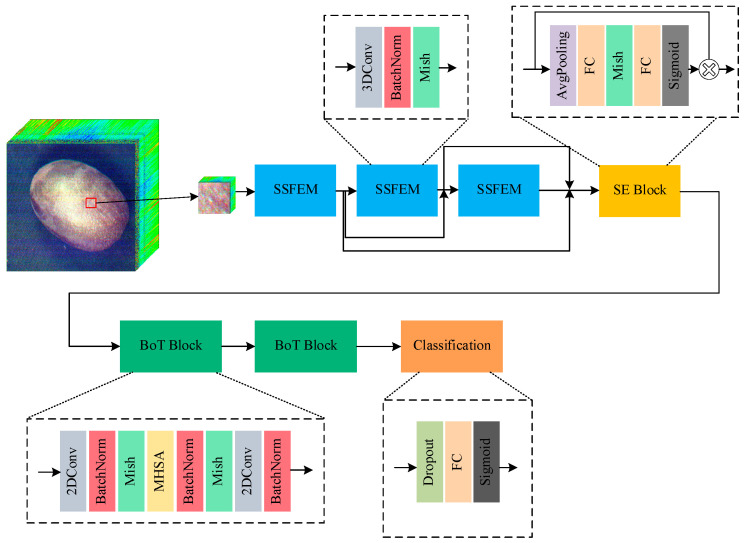 Figure 2
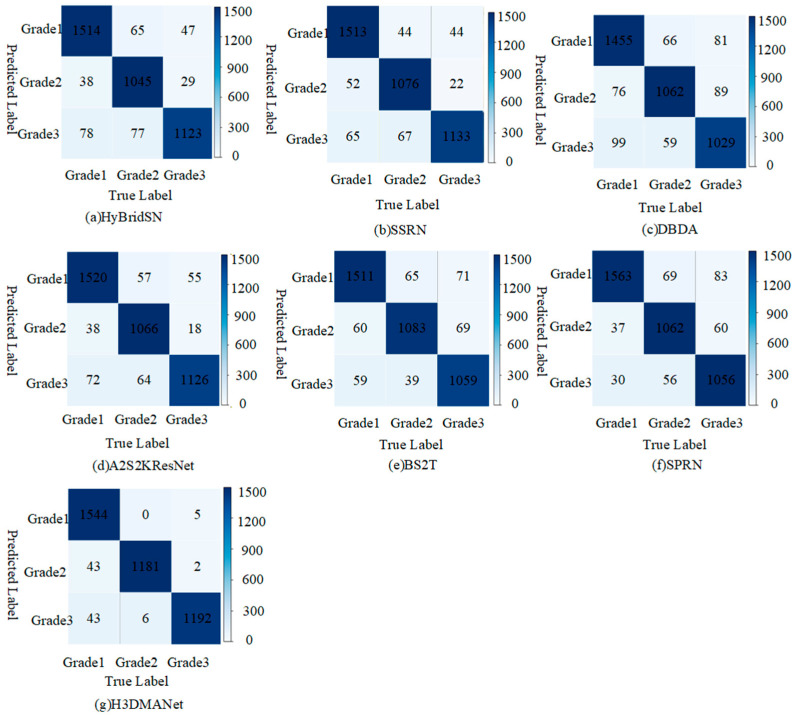 Figure 3
- —Taiyuan City’s “Double Hundred Breakthrough Action” Project
Peer Reviews
No public reviews on file for this paper yet. If you reviewed it on a platform where reviews are public (OpenReview, ICLR, NeurIPS, ICML), you can paste yours below so the community can read it here.
Videos
No videos yet. Explain this paper in a talk, walkthrough, or lecture? Add one.
Taxonomy
TopicsSpectroscopy and Chemometric Analyses · Smart Agriculture and AI · Remote-Sensing Image Classification
1. Introduction
Kiwifruit is popular with consumers because of its high nutritional value and good taste. With the acceleration of the pace of life and the enhancement of health awareness, consumers have stricter requirements on the quality of kiwifruit. They not only pay attention to taste and nutrition but also put forward higher requirements on appearance, texture and flavor. This has prompted high-grade kiwifruit to be favored by the market. In order to meet consumer demand, kiwifruit rating classification has become the key to postharvest. As an important index of quality and taste, sugar content affects consumers’ purchase intention and is an important basis for fruit sorting. However, mainstream sugar measurement methods involve physical treatment, resulting in fruit damage, waste of resources and increased costs.
As a new generation of non-destructive testing technology, hyperspectral imaging technology combines near-infrared spectroscopy with imaging technology to obtain spectral information and image information of agricultural products at the same time. By measuring the response of materials to different wavelengths of light, spectroscopy can deeply reveal the internal structure and properties of materials, and thus provide strong support for quality detection. In the field of non-destructive testing of fruit quality, spectroscopic techniques have been widely used to accurately measure key quality indicators such as fruit sugar content [1], hardness [2] and acidity [3]. Spectroscopy technology has broad application prospects in the field of fruit quality detection.
Many scholars have introduced the tool of deep learning to achieve end-to-end detection. Jie et al. [4] established a prediction model of citrus granulation by using the input of the preprocessed transmission spectrum obtained by hyperspectral imaging. After adding the batch normalization layer, the CNN obtained 100% accuracy and 97.9% accuracy in the training set and validation set, respectively. Yazad et al. [5] collected the spectral data of the mature and immature stages of papaya fruit based on the hyperspectral imaging system. SSRN was used for modeling regression to evaluate the maturity of papaya fruit. Cui et al. [6] used 3D-CNN to realize the early detection of apple Valsa canker disease based on hyperspectral images. Hu et al. [7] combined visible/near-infrared (VNIR) and short-wave infrared (SWIR) hyperspectral imaging (HSI), and used 1D-CNN to detect the degree of pesticide residues on the surface of Hami melon. Pappu et al. [8] used VGG16 network combined with machine learning to realize the detection of citrus black spot, and the overall accuracy rate reached 93%. In addition, Li et al. [9] directly fed 3D hyperspectral patches into a 3D-CNN to jointly learn spectral–spatial representations, providing a typical 3D end-to-end learning paradigm for hyperspectral cubes. Zhong et al. [10] further designed an SSRN that takes raw 3D HSI cubes as input and sequentially extracts spectral and spatial features via residual blocks, with batch normalization improving generalization and achieving state-of-the-art HSI classification accuracy on multiple data sets. Roy et al. [11] proposed HybridSN, which combines 3D convolution for spectral–spatial feature learning and 2D convolution for enhanced spatial semantic learning, demonstrating an efficient 3D–2D hybrid strategy for HSI cube analysis. For kiwifruit quality monitoring, Bu et al. [12] used hyperspectral imaging combined with deep learning to detect hidden bruises in kiwifruit, demonstrating the feasibility of deep models for nondestructive defect inspection. Cong et al. [13] integrated hyperspectral imaging with a hybrid CNN/GRU-based learning and XGBoost regression framework to nondestructively predict kiwifruit firmness and TSS during refrigeration, indicating that deep learning can support both quality quantification and decision-making in postharvest management. Guo et al. [14] developed a dual-branch selective attention capsule network (DBSACaps) for early detection of kiwifruit soft rot using hyperspectral images, highlighting that deep learning can effectively exploit hyperspectral cube information for postharvest disease screening. These studies have proved that the combination of hyperspectral imaging technology and deep learning has great potential in non-destructive testing.
Although the classification method based on convolution neural network can obtain higher classification accuracy, it is undeniable that there are still some limitations. For example, the convolution receptive field is small, and it is difficult to capture global features for some networks with fewer layers. Therefore, some Transformer-based classification networks have become new research hotspots. The Transformer structure can achieve global feature extraction by establishing long-distance dependencies. It is this advantage that just makes up for the shortcomings of the convolution neural network’s lack of acceptance domain. Therefore, we propose a deep learning model based on hierarchical 3D convolution and attention mechanism, named H3DAMNet. Experiments show that H3DAMNet has better performance and generalization ability than other network models.
2. Materials and Methods
2.1. Samples
The Yunhai No.1 kiwifruit used in this experiment was harvested on 15 September 2022 from Chuyang Orchard in Hubei Province, China. Fruits free from disease and insect lesions, fresh wounds and scars, and fully bagged during growth were selected, with the weight of each fruit ranging from 90 to 110 g. After harvesting, the fruits were air-dried to remove field heat and then transferred to a cold storage for short-term preservation. A total of 280 Yunhai No.1 kiwifruits were used for subsequent experiments.
2.2. Hyperspectral Imaging System and Sugar Meter
This study adopts the SNAPSCAN VNIR hyperspectral imaging system developed by IMEC, Leuven, Belgium, Figure 1. The system consists of a hyperspectral imager, uniform halogen lamp light sources (2 with homogenizing sheets), a standard reflectance panel (reflectance 99%), a precision electric displacement platform (positioning accuracy ±0.01 mm), a computer and supporting professional software (IMEC Hyperspectral Studio V4.2). The spectral acquisition range of the system is 470–900 nm, the image resolution is set to 800 × 800 pixels, the integration time is 4.0 s, the analog gain of the imager is 2.0, and the spectral sampling interval is 1.2 nm, ensuring high resolution and stability of the collected data.
After setting up the experimental environment and configuring the system parameters appropriately, turn on the light source and imager for preheating to avoid erroneous data collection caused by system instability. Upon completion of preheating, the first scan the standard reflectance panel with the imager for calibration, adjust the panel to fill the camera’s field of view and conduct the initial calibration. Then, place the fruit directly below the lens, and adjust its position via the real-time image on the software to ensure the fruit is centered in the imaging area for subsequent processing. During the experiment, the high power consumption of the halogen lamp will cause a continuous rise in ambient temperature under prolonged illumination, which interferes with the normal operation of the imager and may result in abnormal noise in the spectral images. Therefore, the system must be shut down for natural cooling after 30 min of shooting, and the experiment can be restarted only when the ambient temperature drops below 35 °C. After collecting each kiwifruit sample, mark a dot on its back with a sign pen to facilitate the determination of sampling points for the subsequent sugar content test.
In this study, the soluble solid content (SSC) of kiwifruit samples was determined using the ATAGO PAL-α digital handheld pocket refractometer ATAGO CO., LTD., Tokyo, Japan. This instrument features a wide measurement range of 0% to 85% for SSC with a high accuracy of ±0.2%, ensuring the accuracy and reliability of the measured data. It is suitable for use at a temperature of 10–40 °C and is equipped with an automatic temperature compensation function, which can detect the prism temperature via a built-in temperature sensor and perform corresponding compensation, thus eliminating the influence of temperature variations on the measurement results.
For the SSC measurement, the prism surface was first cleaned with distilled water and the instrument was zeroed by pressing the “ZERO” button to guarantee measurement accuracy. An appropriate amount of kiwifruit juice was then dropped onto the refraction prism surface, followed by pressing the measurement button. The value displayed on the screen after the arrow flashed three times was recorded as the measured SSC value. To further improve data accuracy, each measurement was repeated three times at a single sampling point, with the average value taken as the final SSC data for that point. Additionally, two more measurement points were marked at 120° clockwise and 120° counterclockwise from the spectral sampling point on the equatorial part of the kiwifruit. The SSC at these marked points was measured using the same method, and the average SSC of the three points was regarded as the overall SSC of the fruit.
2.3. Hyperspectral Image Preprocess
Hyperspectral imaging detection and quality analysis were conducted on this batch of samples in this study, and while hyperspectral imaging technology can capture abundant spectral information, its problem of data redundancy is particularly prominent. First, the hyperspectral image data of a single complete kiwifruit reaches 366 megabytes, which contains a large amount of blank background information irrelevant to fruit quality, resulting in severe data redundancy; second, the complete data has both a high spatial dimension (800 × 800 pixels) and a high spectral dimension (150 bands), which will greatly increase the computational complexity of the model, not only leading to low model training efficiency but also easily causing overfitting; third, the light reflection angle in the edge area of the kiwifruit has a large deviation, and the stability and reliability of the corresponding data are significantly lower than those in the central area of the fruit. Therefore, Regions of Interest (ROI) were extracted from the 800 × 800 pixel hyperspectral images of these 280 samples: median filtering was first applied for denoising, and fruit masks were obtained via Otsu threshold segmentation at the 871 nm band; then, the external matrix of the fruit contour was calculated and proportionally shrunk to the central area; finally, the images were cropped into 30 × 30 pixel hyperspectral data blocks, with a total of 20,074 data blocks obtained. It should be emphasized that the hyperspectral data blocks from the same kiwifruit are obtained through non-overlapping slicing. After extracting the central ROI of a single kiwifruit, we slice it into multiple 30 × 30 pixel blocks without spatial overlap between adjacent blocks—each block corresponds to an independent spatial region. This approach effectively improved the data quality.
On this basis, referring to the grading requirements for soluble solids content in the [15] 2022 Kiwifruit Industry Standard, China Report Hall and combining the opinions of experts from Huazhong Agricultural University, all data blocks were divided into three grades according to sugar content (first-grade fruit ≥ 14.5 °Brix, second-grade fruit 13.5–14.5 °Brix, third-grade fruit ≤ 13.5 °Brix). Statistical information is shown in Table 1.
2.4. H3DAMNet
To solve the problem that 2D convolution is difficult to capture the spatial and spectral features of hyperspectral at the same time, and convolution neural networks are weak in the modeling of sequence information, a new kiwifruit classification method based on hierarchical 3D convolution and attention mechanism network (H3DAMNet) was designed. Figure 2 shows the overall architecture. The network consists of four core modules: hierarchical spectral–spatial feature extraction module, channel attention mechanism module, BoT module and classification module.
2.4.1. Hierarchical Spectral–Spatial Feature Extraction Module
The hierarchical spatial–spectral feature extraction module is composed of 3D convolution layer, batch normalization layer and Mish activation function, which is used to capture the characteristics of hyperspectral data. The introduction of skip layer connection improves feature reusability, reduces information loss, enhances information flow between different levels, and improves the comprehensiveness and richness of feature expression. At the same time, skip layer connection avoids gradient disappearance and ensures stable training and optimization of the network.
2.4.2. Squeeze and Excitation (SE) Block
In the primary spatial–spectral features, not all dimensions significantly affect the classification results, and there is redundant information. Therefore, the squeeze and excitation block [16] is introduced, and the neural network is used to adaptively generate the weight coefficient. These coefficients are weighted with primary spatial–spectral features to enhance useful features and suppress irrelevant features. Through this mechanism, the sensitivity of the network to key information is improved.
2.4.3. Bottleneck Transformer (BoT) Block
By introducing a multi-headed self-attention mechanism, it is possible to consider the information of all positions in the sequence at the same time, so as to model the context relationship more comprehensively. At the same time, the network can capture the complex dependencies in hyperspectral sequences from a long distance, thereby improving the accuracy of classification. The BoT block uses a Transformer encoder to replace the 3 × 3 convolution layer in ResNet [17]. The Transformer encoder contains a self-attention layer and a fully connected layer. Through this design, the BoT block combines the advantages of convolutional neural networks and Transformer models. It not only inherits the efficient extraction ability of CNN for local features, but also enhances the model’s ability to capture global information through the self-attention mechanism.
2.4.4. Classification Module
As the output of the network, the linear layer realizes the hierarchical prediction of kiwifruit through the full connection layer and the Softmax function. This layer converts the high-level features learned by the network into specific classification results, and completes the prediction task of the entire network.
2.5. Loss Function
The cross-entropy loss function is used to calculate the loss value in each epoch of training. The calculation method of the cross-entropy loss function is as follows Equation (1), where is the output loss, is the real distribution of the sample, and is the predicted distribution of the sample.
2.6. Experimental Environment and Evaluation Index
This experiment was carried out on a graphics workstation equipped with Inter Xeon CPU [email protected], Nvidia RTX2080Ti GPU, 64 GB memory, and 64-bit Windows10 operating system. The software environment is Pytorch 1.7.0 deep learning framework based on Python 3.7.8. The number of rounds of model training is 150, the batch size is 16, and the Adam optimizer is used for gradient descent.
In this study, the overall accuracy (OA), average accuracy (AA), precision (P), recall (R) and F1 Score (F1) are used to evaluate the performance of the model, and the relevant calculation methods are shown in Equations (2)–(6).
3. Results and Discussion
3.1. Network Structure Analysis Experiment
In the H3DAMNet proposed in this paper, the spectral–spatial feature capture module (SSFEM) and the bottleneck Transformer block (BoTBlock) are two crucial core components. In order to find the best network structure to solve the problem of kiwifruit grading, this section designs an architecture search experiment. In each experiment, different combinations of module numbers are used, and each combination is trained under the same hyperparameter setting. The prediction accuracy of each model on the test set is recorded and used as the main index to evaluate the quality of the model. The experimental results are shown in Table 2.
From the data in the table, it can be seen that when SSFEM and BoTBlock are combined as (3, 2), the model prediction accuracy is the highest, OA is 97.5%, AA is 97.0%, and the precision of kiwifruit grades is the best. However, when combined with (4, 3), the accuracy is the lowest. Due to the increase in modules, the amount of parameters increases greatly, and the training set data is not enough to support the complexity of the model, causing over-fitting and affecting the generalization ability of the test set. When designing the network structure, it is not appropriate to blindly stack the modules, and it is necessary to select the appropriate number according to the data set to construct an efficient model. SSFEM and BoTBlock need to be reasonably matched to ensure that the model has good performance on both training and test sets.
3.2. Analysis of the Results of Comparative Experiments
In order to evaluate the performance of the proposed H3DAMNet network, it is compared with the mainstream hyperspectral classification networks, including HyBridSN [11], SSRN [12], DBDA [18], A2S2KResNet [19], BS2T [20] and SPRN [21]. These networks have significant performance and wide application in the field of hyperspectral image classification, so they can provide us with a benchmark to compare and evaluate the performance of H3DAMNet networks.
In order to ensure the accuracy of the experimental results, all neural networks are implemented using the Pytorch (1.10.0) deep learning framework. The BatchSize is uniformly set to 16, the Adam optimizer is used to update the parameters, and the training Epoch is fixed to 150. The prediction accuracy of each model on the test set is shown in Table 3.
It should be noted that the slight differences in H3DAMNet’s results between Table 2 and Table 3 are caused by the randomness of initial weights in deep learning training: Table 2 presents results of network structure search without saving trained weights, while Table 3 shows results of formal comparative experiments with retrained optimal structure under the same hyperparameters.
Table 3 demonstrates that H3DAMNet achieves the optimal performance on the test set. Its overall accuracy (OA) reaches 0.975, representing a 4.8% improvement over the second-ranked SSRN. For the average accuracy (AA), H3DAMNet attains 0.973, while SSRN and A2S2KResNet follow closely with an AA of 0.925—indicating a 4.8% gap compared to H3DAMNet. The dual-branch structured BS2T and DBDA networks exhibit slight overfitting, attributed to the small sample size and large parameter count.
All models deliver strong performance in first-grade kiwifruit recognition, with accuracy exceeding 0.9. For second-grade kiwifruit prediction, all models except DBDA and BS2T retain high accuracy. Regarding third-grade kiwifruit precision, only BS2T, SPRN, and H3DAMNet surpass 0.9; the inferior performance of other models impacts the overall and average accuracy.
Figure 3 displays the classification performance of different models for kiwifruit of various grades. It should first be clarified that in the confusion matrix, rows represent predicted labels and columns represent true labels, and the diagonal positions (where predicted labels = true labels) correspond to correctly classified samples, which are darker than other positions. This indicates that the trained models can complete the basic kiwifruit grading task, validating the effectiveness of neural networks in hyperspectral data processing.
From the off-diagonal regions (representing classification errors), it can be observed that the HyBridSN, DBDA, and A2S2KResNet networks perform poorly in predicting first-grade kiwifruit, often misclassifying true third-grade kiwifruit as first-grade; in addition, the DBDA and BS2T networks exhibit significant errors in predicting third-grade kiwifruit, misclassifying some true first-grade and true second-grade samples as third-grade. These misclassifications directly reduce the overall accuracy of the models. In contrast, the proposed H3DAMNet model performs better: it has a higher proportion of diagonal cells, not only achieving high accuracy in predicting first-grade kiwifruit but also having a significantly lower probability of misclassifying true second-grade and third-grade kiwifruit into other grades.
Based on the overall performance analysis of the confusion matrix, we further explored the specific patterns of misclassification and found that for most comparative models, the number of true first-grade fruits predicted as second-grade is roughly similar to the number of true first-grade fruits predicted as third-grade. This phenomenon indicates that the spectral characteristics of first-grade fruits have a relatively high overlap with those of second-grade and third-grade fruits, mainly due to two reasons: first, the differences in soluble solids content (sugar content) among kiwifruit of different grades are subtle (e.g., only a 1 °Brix gap between first-grade and second-grade), leading to insignificant differences in spectral responses; second, there is weak noise interference during hyperspectral data acquisition (such as small fluctuations in the light intensity of halogen lamps), which further blurs the spectral differences between grades.
In summary, the comparative experimental results show that H3DAMNet achieves significantly higher overall accuracy (OA = 97.5%) and average accuracy (AA = 97.3%) on the test set than mainstream hyperspectral classification models such as HyBridSN, SSRN, and DBDA, demonstrating superior overall classification performance.
3.3. Classification Results of Different Grades of Kiwifruits
In order to further explore the classification effect of different network models on fruits at all levels, the precision rate, recall rate and F1 value of each type of fruit were calculated. Through these indicators, the classification ability of the model is evaluated more comprehensively.
Based on the overall performance analysis of the confusion matrix and the data in Table 4, this study further explored the specific patterns and underlying causes of misclassification:
Most models exhibited high precision in classifying first-grade fruits. Among them, the SPRN model ranked first with a precision of 0.959, followed closely by H3DAMNet at 0.947, indicating that mainstream models possess strong capabilities in recognizing the spectral features of high-sugar kiwifruit. However, in terms of recall, H3DAMNet significantly outperformed other models with a score of 0.996 (the second-place SSRN only reached 0.945), meaning H3DAMNet could identify nearly all true first-grade fruits and avoid the loss of high-quality fruits being misclassified as low-grade. In contrast, the recall rates of BS2T and SPRN models for first-grade fruits were less than 0.92. This is mainly because pure Transformer models (such as BS2T) have weak ability to capture local spectral details, while SPRN’s spectral partitioning strategy failed to fully distinguish the subtle sugar content difference between first-grade and second-grade fruits.
As an intermediate grade, second-grade fruits have sugar content in a critical range, and their spectral features overlap with both first-grade and third-grade fruits, making them the most difficult grade to classify. Data shows that the recall rates of DBDA and BS2T models for second-grade fruits were only 0.866 and 0.893, respectively, with a large number of second-grade fruits misclassified as first or third grade. This is because DBDA’s dual-branch attention mechanism failed to effectively fuse spatial–spectral features, and BS2T’s bottleneck structure had insufficient generalization ability when processing critical features. In contrast, H3DAMNet achieved a precision of 0.995 and a recall of 0.963 for second-grade fruits, with an F1 score as high as 0.979. This benefits from the fine extraction of critical spectral features by its hierarchical 3D convolution and the weight enhancement of spectral bands unique to second-grade fruits by the SE module, thereby accurately distinguishing fruits in the critical sugar content range.
Third-grade fruits have low sugar content, resulting in relatively weak spectral signal intensity that is susceptible to noise interference. The SSRN model achieved the second-highest precision of 0.945 through its residual block structure, and SPRN’s recall rate reached 0.925, but the F1 scores of both models did not exceed 0.92. The precision of DBDA and BS2T for third-grade fruits was only 0.858 and 0.883, respectively, indicating a large number of misjudgments in the samples predicted as third-grade (e.g., misclassifying low-quality second-grade fruits as third-grade), which would lead to the downgrading of qualified fruits and resource waste. H3DAMNet achieved the optimal precision (0.994) and recall (0.960) for third-grade fruits.
In summary, H3DAMNet performed best in terms of precision, recall, and F1 score for second-grade and third-grade fruits, and also significantly outperformed other models in the recall and F1 score for first-grade fruits. Its multi-dimensionally balanced classification performance fully demonstrates the rationality of the integrated design of hierarchical 3D convolution and attention mechanism. It can adapt to the differences in spectral features of kiwifruit with different sugar content grades, providing reliable support for accurate grading in actual production.
4. Conclusions
This study proposes a kiwifruit sugar content grading model (H3DAMNet) based on hierarchical 3D convolution and attention mechanism. Through the collaboration of four core modules, it achieves synchronous extraction and efficient modeling of spatial–spectral features. The model’s key advantages include synchronously capturing joint spatial–spectral features to avoid information loss, fusing dual attention mechanisms to balance local and global feature learning, and achieving both classification accuracy and generalization ability with a moderate parameter scale. On the test set of 280 kiwifruit samples, the model attains an overall accuracy (OA) of 97.5% and an average accuracy (AA) of 97.3%, significantly outperforming mainstream hyperspectral classification models. It successfully realizes accurate three-level grading, providing an effective reference for the non-destructive grading of similar fruits. Future research will focus on expanding the data set by collecting kiwifruit samples of different varieties and from various planting regions. By verifying the performance of H3DAMNet on cross-variety and cross-region data, we aim to improve the model’s generalization ability and promote its application in large-scale kiwifruit grading production.
The reference list from the paper itself. Each links out to its DOI / PubMed record.
- 1Mancini M. Mazzoni L. Gagliardi F. Balducci F. Duca D. Application of the Non-Destructive NIR Technique for the Evaluation of Strawberry Fruits Quality Parameters Foods 2020944110.3390/foods 904044132268548 PMC 7231257 · doi ↗ · pubmed ↗
- 2Jiang Q. Zhang M. Mujumdar A.S. Wang D. Non-destructive quality determination of frozen food using NIR spectroscopy-based machine learning and predictive modelling J. Food Eng.202334311137410.1016/j.jfoodeng.2022.111374 · doi ↗
- 3da Medeiros M.L.S. Brasil Y.L. Cruz-Tirado L.J. Lima A.F. Godoy H.T. Barbin D.F. Portable NIR spectrometer and chemometric tools for predicting quality attributes and adulteration levels in butteroil Food Control 202314410934910.1016/j.foodcont.2022.109349 · doi ↗
- 4Jie D. Wu S. Wang P. Li Y. Ye D. Wei X. Research on Citrus grandis Granulation Determination Based on Hyperspectral Imaging through Deep Learning Food Anal. Methods 20211428028910.1007/s 12161-020-01873-6 · doi ↗
- 5Garillos-Manliguez C.A. Chiang J.Y. Multimodal Deep Learning and Visible-Light and Hyperspectral Imaging for Fruit Maturity Estimation Sensors 202121128810.3390/s 2104128833670232 PMC 7916978 · doi ↗ · pubmed ↗
- 6Cui R. Li J. Wang Y. Fang S. Yu K. Zhao Y. Hyperspectral imaging coupled with Dual-channel convolutional neural network for early detection of apple valsa canker Comput. Electron. Agric.202220210741110.1016/j.compag.2022.107411 · doi ↗
- 7Hu Y. Ma B. Wang H. Zhang Y. Li Y. Yu G. Detecting different pesticide residues on Hami melon surface using hyperspectral imaging combined with 1D-CNN and information fusion Front. Plant Sci.202314110560110.3389/fpls.2023.110560137223822 PMC 10200917 · doi ↗ · pubmed ↗
- 8Pappu K.Y. Thomas B. Qin J. Moon K. Quentin F. Megan M.D. Automated classification of citrus disease on fruits and leaves using convolutional neural network generated features from hyperspectral images and machine learning classifiers J. Appl. Remote Sens.202418014512