Impacts of Winter and Spring Water Masses on Demersal Fish Community Structure Around Hainan Island
Boran Qin, Jiani Dong, Jiajie Chen, Yuange Chen, Wei Tian, Xiaodong Wang, Junsheng Zhong

TL;DR
This study shows how seasonal changes in ocean water masses affect fish communities around Hainan Island, with implications for marine conservation and sustainable fishing.
Contribution
The study reveals how seasonal water mass movements influence fish diversity and distribution patterns around Hainan Island.
Findings
Fish communities in winter showed distinct habitat specificity across different water masses.
In spring, warmer and saltier water intrusion led to migratory species dominating mixed water zones.
Fish diversity centers shifted northward and shoreward from winter to spring.
Abstract
Fish populations are highly sensitive to changes in the ocean environment. This study investigated how different “water masses”—large bodies of water with distinct temperature and salinity levels—affect fish diversity around Hainan Island. By conducting surveys in winter and spring, we analyzed which fish species were present and how their distribution shifted with seasonal water changes. We found that the movement of water masses significantly dictates where fish live, and which species are most abundant. For instance, fish communities in winter were very distinct across different areas, whereas in spring, the intrusion of warmer, saltier water brought more migratory species into mixed water zones. Additionally, the areas with the highest fish diversity moved northward from winter to spring. Understanding these seasonal patterns is vital for protecting marine biodiversity. This…
Click any figure to enlarge with its caption.
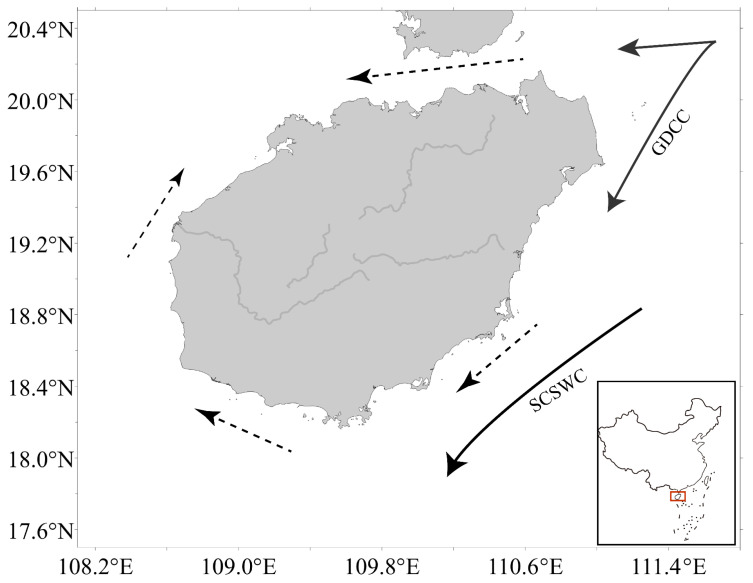 Figure 1
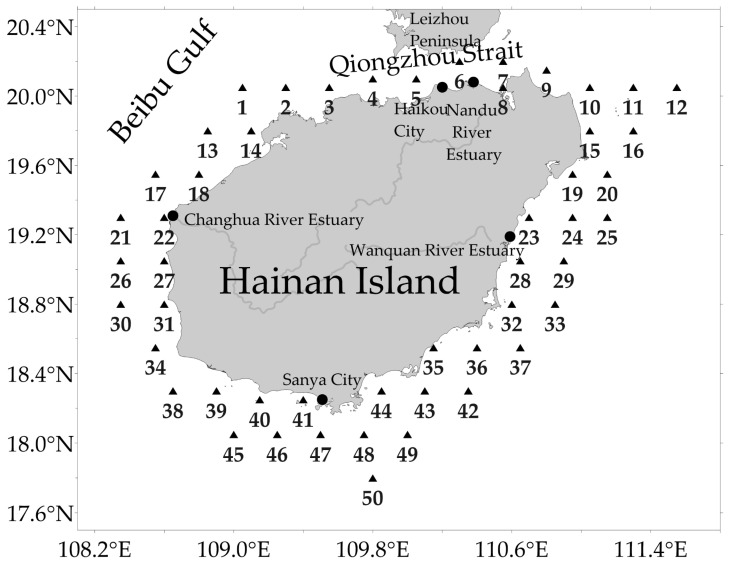 Figure 2
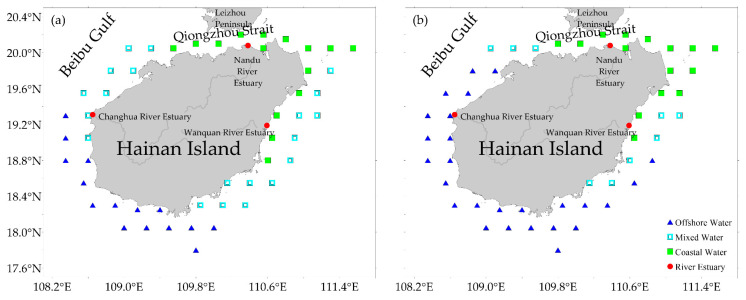 Figure 3
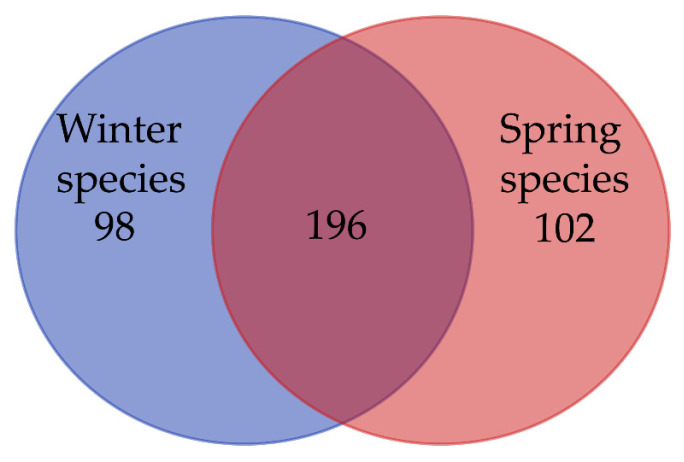 Figure 4
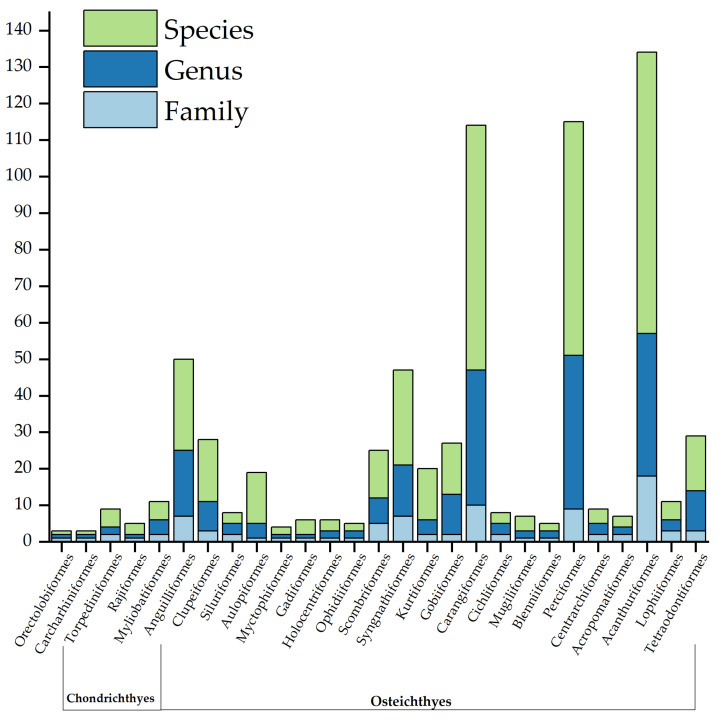 Figure 5
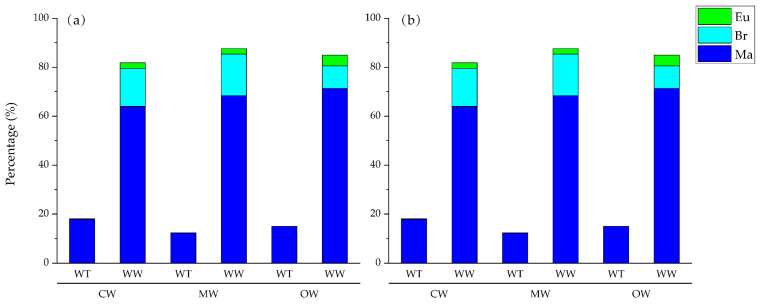 Figure 6
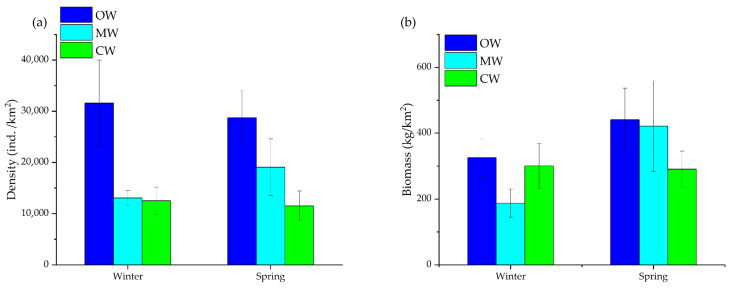 Figure 7
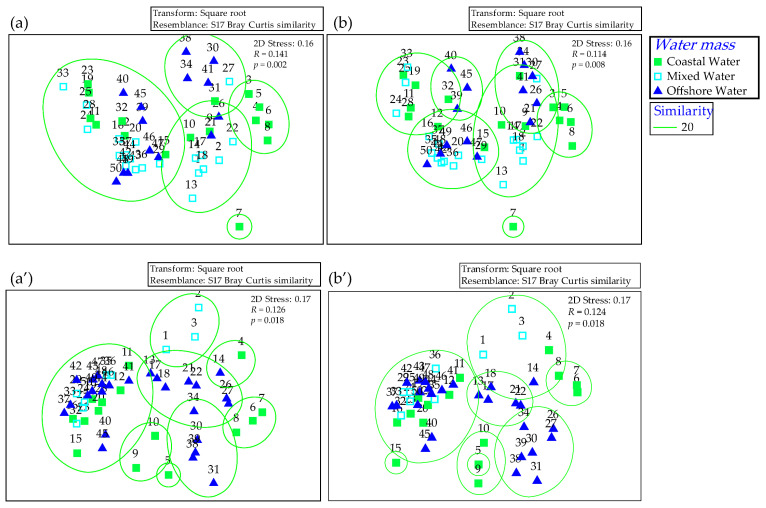 Figure 8
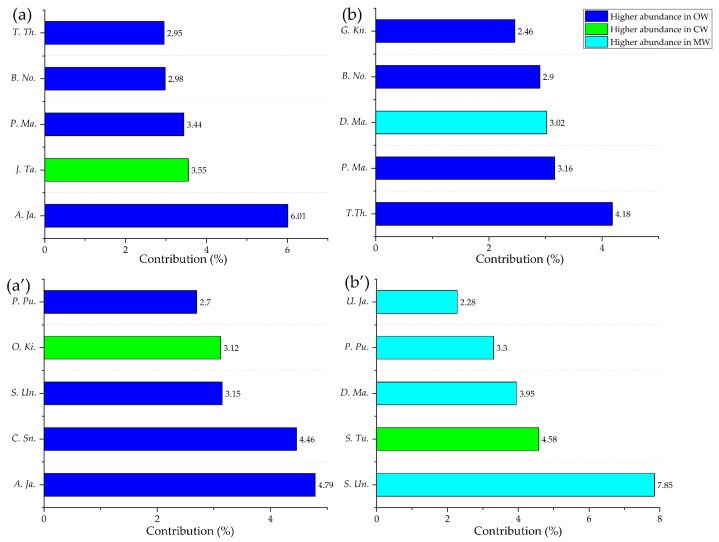 Figure 9
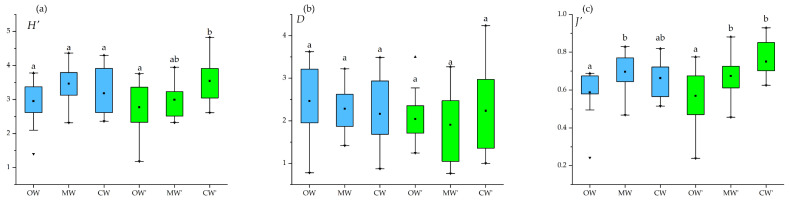 Figure 10
Peer Reviews
No public reviews on file for this paper yet. If you reviewed it on a platform where reviews are public (OpenReview, ICLR, NeurIPS, ICML), you can paste yours below so the community can read it here.
Videos
No videos yet. Explain this paper in a talk, walkthrough, or lecture? Add one.
Taxonomy
TopicsMarine and fisheries research · Isotope Analysis in Ecology · Coral and Marine Ecosystems Studies
1. Introduction
Hydrographic characteristics and water mass dynamics are fundamental drivers in shaping the spatial distribution and community structure of marine organisms [1,2]. To effectively analyze these hydrological environments, the K-means clustering algorithm has been widely adopted as a robust classification tool. Previous applications in adjacent regions have demonstrated the efficacy of this method. For instance, studies in Daya Bay [3], the Pearl River Estuary [4], and the broader South China Sea [5] showed that K-means clustering can reveal the coupling relationships between water mass properties and biological distributions. However, the specific environmental mechanisms governing demersal fish patterns around Hainan Island remain to be fully elucidated. Therefore, understanding these dynamics is indispensable for formulating effective resource restoration strategies and ensuring the long-term sustainability of marine ecosystems.
Hainan Island represents an ideal model system to investigate these mechanisms. It is characterized by an intricate, sinuous coastline extending 1855.27 km, separated from the Leizhou Peninsula to the north by the Qiongzhou Strait and bordered by the Beibu Gulf to the west [6]. Its seafloor topography and complex hydrological conditions have fostered diverse fish communities, establishing these coastal waters as one of the most critical fishing grounds in the South China Sea [7]. Hainan Island is also widely acknowledged as a biodiversity hotspot, characterized by its exceptionally rich plant and animal resources [6,7,8]. Consequently, the fishery industry constitutes a cornerstone of the regional economy. However, the depletion of fishery resources has emerged as a critical crisis. Evidence shows that among China’s 52 traditional offshore fishing grounds, approximately 77% have experienced the disappearance of seasonal “fish floods” (peak fishing periods), and over 80% no longer support the formation of concentrated shoals [9]. Furthermore, human activities [10,11], climate change [12,13] have posed significant threats to local fish migration patterns and habitats.
A schematic map of ocean currents around Hainan Island during winter and spring was drawn based on Su [14] (Figure 1). Specifically, the Guangdong Coastal Current (GDCC) (solid arrows) carried cold coastal water southward, South China Sea West Current (SCSWC) mainly affects the western and southern regions, while the peripheral circulation (dashed arrows) mediated the expansion of mixed water in the Qiongzhou Strait and the western Beibu Gulf.
Based on bottom trawl surveys conducted in Winter 2023 (December) and Spring 2024 (April) in the coastal waters of Hainan Island, this study examined how water masses influence fish community composition, dominant species, and biodiversity. Two hypotheses were tested: (1) Different water masses harbor distinct fish communities due to variations in temperature and salinity; (2) Fish community structure shifts in response to seasonal water mass dynamics. The goal is to elucidate the environmental mechanisms driving the spatio-temporal distribution of fish communities around Hainan Island, thereby providing scientific support for the conservation and sustainable management of local fish resources.
2. Materials and Methods
2.1. Study Area
The study area was located between 108.35 and 111.55° E and 17.80–20.20° N. 50 stations were established along the coastal waters of Hainan Island at intervals of 0.25° longitude and 0.25° latitude (Figure 2) after conducting a preliminary analysis of the marine geography and location of Hainan Island’s nearshore waters. They effectively cover areas ranging from river-influenced estuarine zones and coastal current-influenced strait regions to the open ocean. Sampling stations provide sufficient spatial coverage to capture the heterogeneity of fish community structures across different water masses.
2.2. Water Mass Division
Following the methodology of Tian et al. [4], the sampling stations were clustered into three categories using the K-means algorithm based on four parameters: sea surface temperature (SST), bottom sea temperature (BST), sea surface salinity (SSS), and bottom sea salinity (BSS). The goal of K-Means is to minimize the sum of squared distances between each data point and the centroid (mean) of its assigned cluster. This is captured by the formula:
In this formula, J represents the objective function to be minimized to ensure cluster cohesion. C denotes the total number of clusters, m_k_ represents the number of samples contained in the k-th cluster, r is the re-indexed sequence number of a sample within the k-th cluster, x_r_ is the observation vector of the r-th station, is the mean of the samples in the k-th cluster.
2.3. Sample Collection and Identification
Field surveys were conducted across two seasons: winter (28 November 2023–12 December 2023) and spring (3–13 April 2024). Bottom trawlings were performed using a single-vessel trawl (net height: 3.0 m; width: 21.0 m; minimum cod-end mesh size: 2.5 cm). Each haul lasted approximately 0.5 h, with an average trawling speed of 3.3 knots. The fishery resource survey was conducted using the Research Vessel “Qionglinyu 12368#”. Captured fish were identified to the species level based on Wu and Zhong [15], and both abundance and biomass densities were calculated for each haul. Ecological types for each species were determined with reference to FishBase [16] and Chen [17]. Warm-water (WW) fishes include those distributed in tropical and subtropical zones, while warm-temperate (WT) fishes refer to those distributed in temperate zones. The systematic arrangement of taxa followed the classification systems of Betancur [18] and Nelson [19]. Physicochemical parameters, including temperature, salinity, pH, and dissolved oxygen (DO), were measured synchronously in the surface and bottom water at each site using YSI ProDSS Multiparameter Digital Water Quality Meter (YSI Inc., Yellow Springs, OH, USA). Depth data were concurrently collected using an onboard echo sounder.
2.4. Estimates of Fish Resource Density
The resource density at each sampling station was estimated using the swept area method [20]. The calculation formula is as follows:
p_i_ denotes the fish biomass or abundance, measured in kg/km^2^ or ind./km^2^; C_i_ represents the catch per hour at the i-th station (kg/h or ind./h); a_i_ is the swept area per hour of the fishing gear at the i-th station (km^2^/h); q is the catchability coefficient. Following standard procedures, the catchability coefficient (q) for demersal fish was set to 0.5 [21].
2.5. The Index of Relative Importance (IRI)
The ecological dominance of fish communities during different seasons was evaluated using the index of relative importance (IRI) [22]:
The IRI is computed by considering three factors: N represents the percentage of individuals of a particular fish species relative to the total catch number; W represents the percentage of the weight of that fish species relative to the total catch weight; and F represents the percentage of occurrences of that fish species relative to the total number of sampling stations. Species with an IRI ≥ 1000 are categorized as dominant species, species with IRI between 100 and 1000 are classified as important species, species with IRI between 10 and 100 are considered common species, and species with IRI < 10 are regarded as rare species [21].
2.6. Linear Regression Analysis
Simple linear regression analysis was performed to determine the relationship between the abundance/biomass density of species and the total density of the fish community [23]. The standardized regression coefficient (β) was used to evaluate the contribution rate of each species to the variation in total stock density. Data were analyzed using IBM SPSS Statistics 26.
2.7. Alpha Diversity Used Indices
The Shannon-Wiener diversity index (H′), Margalef species richness index (D), and Pielou evenness index (J′) were employed to evaluate the abundance-based diversity of the fish community [21].
Shannon-Wiener diversity index (H′):
Margalef species richness index (D):
Pielou evenness index (J′):
In the formula, S represents the total number of species of captured fish in the study area, P_i_ denotes the weight of the i-th fish species, N represents the total number of individuals of captured fish.
2.8. ANOSIM and SIMPER Analysis
We utilized cluster analysis to investigate the community structure based on the Bray–Curtis dissimilarity. One-way analysis of similarities (ANOSIM) [24], was employed to evaluate the significance of variations in community structure among different water masses, based on abundance and biomass data. Prior to analysis, both abundance and biomass data underwent square-root transformation to mitigate the influence of highly dominant species. Additionally, similarity percentage (SIMPER) analysis was conducted to determine the contribution of specific species to intra-group similarity and inter-group dissimilarity within the community structure [25]. All computational analyses were performed using Primer 6.0.
3. Results
3.1. Classification and Properties of Water Masses
The waters across both seasons were classified into three water masses: Coastal Water (CW), Mixed Water (MW), and Offshore Water (OW) (Table 1, Figure 3). The identified water masses exhibited distinct hydrographic signatures. The CW, characterized by relatively low temperature and salinity, was primarily distributed in the northeastern waters of Hainan Island, spanning from the Wanquan River estuary to the Qiongzhou Strait. Conversely, the OW featured high-temperature and high-salinity profiles, predominantly localized in the southern and western sectors from the vicinity of Sanya to the Changhua River estuary. The MW, representing the transitional zones between high-salinity offshore water and coastal water, showed intermediate values with pronounced salinity fluctuations, mainly occupying the southeastern and northwestern regions (Figure 3b).
Overall, both temperature and salinity were higher in spring than in winter. OW exhibited the highest thermal stability, characterized by the smallest standard error of the mean in spring. In the CW, the average SSS rose from 33.07 in winter to 33.93 in spring. The temperature and salinity of OW remained uniform throughout the water column in both seasons, maintaining its characteristic high-temperature and high-salinity profile. The spatial distribution of water masses also varied between the two seasons.
Winter featured 20 MW stations and 15 OW stations, whereas spring had 9 MW stations and 26 OW stations. This indicates a strengthened influence of OW in spring, which occupied more transitional stations.
3.2. Specific Composition
The total catch comprised 56,960 individuals, distributed across 396 species, 228 genera, 91 families, and 27 orders (Table A1). A substantial overlap of 196 shared species was observed between the two seasons, whereas the number of species occurring exclusively in winter and spring was 98 and 102, respectively (Figure 4). At the Order level, Acanthuriformes was the most speciose order with 77 species, accounting for 19.44% of the total number of species, followed by Carangiformes (67 species), Perciformes (64 species), and Syngnathiformes (26 species) (Figure 5). Seasonally, the winter survey yielded 26,253 individuals across a total number of 294 species, while spring saw an increase in both numbers (30,707 individuals) and the number of species (298).
In winter, WT species totaled 31, comprising 29 marine (Ma) species, 1 brackish (Br) species, and 1 euryhaline (Eu) species. Simultaneously, WW species reached 263, including 181 Ma species, 61 Br species, and 21 Eu species. During the spring survey, the WT species numbered 30, comprising 27 Ma species, 2 Br species, and 1 Eu species. Simultaneously, WW species reached a total of 268, which included 182 Ma species, 61 Br species, and 25 Eu species. Across both seasons, WT species and Ma species remained the dominant components within all water masses, consistently accounting for over 50.00% of the total fish community composition (Figure 6). The CW region experienced the most dramatic seasonal shifts; in winter, the proportion of Eu species reached 25.48%. As salinity increased in spring, the Eu proportion plummeted to 2.34%. Conversely, the ratio of WT-Ma species surged from 4.60% in winter to 17.94% in spring. In winter, the MW was co-dominated by WW-Ma (56.58%) and WW-Br (24.20%) species. In spring, the dominance of WW-Ma species in the MW further strengthened to 68.38%, while Eu species nearly disappeared; the species composition in this transitional zone showed a clear successional trend toward OW characteristics. The OW remained the most environmentally stable with the strongest marine affinity; WW-Ma groups accounted for over 70% in both seasons, and proportions of Eu and Br groups were minimal in the OW, with even lower values recorded in spring than in winter.
3.3. Seasonal Variations in Fish Resource Density
The average fish biomass density in both seasons was 335.16 kg/km^2^. Biomass density consistently peaking in the OW and remaining lowest in the MW during winter. A Rise in biomass density was observed in spring, particularly in the OW region (Figure 7). The maximum density at a single station was 854.63 kg/km^2^, located in the northern CW region, with Johnius taiwanensis (418.94 kg/km^2^) as the most abundant species. In spring, a high-density area emerged in the transition zone between southeastern OW and MW, where the maximum station density was 2437.43 kg/km^2^, mainly by the presence of Thamnaconus hypargyreus (1371.37 kg/km^2^).
The average abundance density of fish across both seasons was 20,235.75 ind./km^2^. Fish abundance showed clear seasonal changes. Across both seasons, OW consistently supported the highest densities, while CW maintained the lowest. Although average abundance increased in spring, the spatial contrast between the high-density OW and low-density CW remained, with OW still hosting the most fish and CW the least. (Figure 7). During winter, a high-density area was identified in the southern OW region, where the maximum station was 103,918.22 ind./km^2^, by the presence of Alepes kleinii (3869.08 ind./km^2^). In spring, high-density patches emerged in the transition zone between southeastern OW and MW, with the maximum density reaching 128,134.11 ind./km^2^, by the presence of Saurida undosquamis (12,125.35 ind./km^2^).
3.4. Seasonal Variation of Dominant and Key Contributing Species
Although Acropoma japonicum exhibited the highest IRI values (919.13), no single species met the strict threshold for dominance (IRI ≥ 1000). However, 14 important species were recorded, with 1 Eu species, 5 Br species, and the remainder as Ma species. In spring, S. undosquamis emerged as the only dominant species. Additionally, 12 important species were identified, with only 1 Br species and the rest being Ma species. Common dominant or important species across both seasons included S. undosquamis, Champsodon snyderi, Brachypleura novaezeelandiae, A. japonicum, Decapterus kurroides, Upeneus japonicus, Ostorhinchus kiensis, Terapon theraps, and Pennahia macrocephalus (Table 2).
3.5. Key Contributing Species in Water Masses
Water masses had a significant influence on the spatial distribution patterns of fish communities in both seasons (ANOSIM, p < 0.05) (Figure 8). SIMPER analysis revealed distinct variations in community composition across different water masses (Figure 9).
In winter, the primary contributors to abundance in MW (contribution > 10%) were B. novaezeelandiae (11.07%) and C. snyderi (10.01%), with B. novaezeelandiae (12.24%) also being the main biomass contributor. In OW, A. japonicum (10.44%) was the main abundance contributor, while T. theraps (12.79%) dominated the biomass contribution. In CW, J. taiwanensis was the main contributor to both abundance (14.80%) and biomass (14.40%). In spring, the main abundance contributors in MW were S. undosquamis (11.82%) and C. snyderi (10.60%). Biomass was primarily contributed by S. undosquamis (19.84%), D. maruadsi (14.98%), and S. tumbil (13.70%). In OW, A. japonicum (10.40%) remained the dominant abundance contributor, whereas S. undosquamis (14.40%) and S. tumbil (11.24%) were the main biomass contributors. In CW, J. taiwanensis (14.40%) led the abundance contribution, while S. tumbil (17.91%) became the primary contributor to biomass.
3.6. Drivers of Community Succession
To further identify the primary drivers of community succession, this study compared the contributions of the top five dominant species and the aforementioned key water mass contributors to community biomass (W) and abundance (N). Multiple linear regression analysis revealed a significant seasonal turnover in the species driving variations in fish community composition.
In winter, the total W was jointly driven by multiple species. Specifically, J. taiwanensis, T. theraps, and D. maruadsi exhibited highly significant positive contributions (p < 0.01), serving as the core factors determining winter biomass distribution patterns. In contrast, variations in winter total N were significantly correlated only with A. japonicum (p < 0.05). In spring, the driving force of the community shifted markedly toward marine species; S. undosquamis became the primary factor influencing abundance (p < 0.01), with a standardized coefficient (β) of 0.39. These results indicate an overlap between the top five dominant species and the major water mass contributors: J. taiwanensis and S. undosquamis, which collectively drive the spatial heterogeneity of the community. However, certain dominant species, such as A. japonicum in winter, primarily exerted influence at the numerical level, with relatively limited impact on the biomass distribution patterns (Table 3).
3.7. Seasonal Variations in Diversity
Fish community diversity exhibited distinct seasonal variations. In winter, high-value zones for the Margalef richness index (D) were primarily concentrated in the high-salinity OW region. However, high-value zones for the Shannon–Wiener diversity index (H′) and Pielou’s evenness index (J′) were mainly distributed in the confluence area between CW and MW. The Pielou’s evenness index (J′) in the MW was significantly higher than in the OW (p < 0.05). This pattern may be attributed to the dominance of a single abundance contributor, A. japonicum, in the OW region, which resulted in relatively lower evenness. In spring, the centers of community diversity displayed a distinct northward and shoreward shift. High-value zones for the Margalef’s richness index (D) transitioned to the CW and MW regions in eastern Hainan Island, with the highest number of species in the CW. Simultaneously, the Shannon–Wiener diversity index (H′) and Pielou’s evenness index (J′) peaked in the CW region near northeastern Hainan Island and the Qiongzhou Strait. Both indices were significantly higher than those in the OW (p < 0.05) (Figure 10).
4. Discussion
4.1. Fish Composition
The fish community around Hainan Island is characterized by high species richness and a clear dominance of warm-water marine (WW-Ma) groups. The identification of 396 species across both seasons aligns with previous records from the South China Sea shelf [21]. However, the community structure undergoes a significant reorganization driven by seasonal water mass shifts. The key species driving total biomass and abundance distributions are highly congruent with the core taxa defining specific water masses.
In winter, the spatial heterogeneity of biomass is jointly regulated by a multispecies complex. Notably, J. taiwanensis mainly occurs in shallow tropical and subtropical coastal waters [26]. It serves as a high-fidelity indicator for Coastal Water (CW), with its density peaks strictly confined to the low-temperature, low-salinity boundaries of the Qiongzhou Strait. Conversely, A. japonicum acts as a representative taxon for OW region. Primarily concentrated in the high-salinity waters off Sanya City. This is consistent with its habit of preferring areas of relatively deep water with relatively high salinity [27]. In contrast, the spring transition marks a shift toward a community driven by migratory marine species. The intrusion of warm OW region into transitional zones facilitates the dominance of S. undosquamis, which becomes the primary factor influencing regional abundance. The proliferation of S. undosquamis is linked to spawning migrations [28]. Furthermore, the seasonal strengthening of the SCSWC likely facilitates larval dispersal and connectivity [29]. The synchrony between species turnover and water mass dynamics suggests that these key taxa act as reliable bioindicators of environmental fluctuations. This environmental dependency highlights the role of water masses regulate fish distribution through the selection of species with specific thermohaline adaptations. From a biodiversity perspective, this seasonal habitat partitioning enhances ecosystem resilience by promoting niche differentiation. This temporal segregation allows for greater species coexistence and functional redundancy, buffering the Hainan Island fishery ecosystem against local disturbances.
4.2. The Influence of Water Masses on the Distribution of Fish Species
The waters surrounding Hainan Island are primarily influenced by three types of water masses. Shi et al. [30] identified a year-round westward flow in the Qiongzhou Strait, with a near-bottom average flow rate of 10–15 cm/s during winter and spring. The Guangdong Coastal Current carries a significant volume of supplementary water westward through the strait, while freshwater from the Wanquan and Nandu Rivers discharges into the northeastern region. These combined processes give rise to distinctive CW characteristics in and around the Qiongzhou Strait. The SCSWBC generates coastal currents adjacent to the eastern coast of Hainan Island, flowing southward in winter and northward in summer, with the winter flow being stronger than that in summer [31]. During winter and spring, a clockwise circulation develops around Hainan Island [32], resulting in a stronger influence of high-salinity South China Sea water in the southwestern region. The MW is positioned between these two water masses. During the spring monsoon transition, the influence of high-salinity water strengthens, leading to a contraction of the MW. In winter, the contributing species of each water mass exhibit high specificity: the euryhaline J. taiwanensis is strictly confined to the Qiongzhou Strait dominated by CW, while the marine warm-water species A. japonicum is concentrated in the waters around Sanya City covered by high-salinity water. A weakening of the SCSWBC is observed in spring [33,34], allowing southern OW region to migrate northward and mix with the coastal water in the eastern region. With the arrival of warm OW region, migratory species such as S. undosquamis and S. tumbil complete their overwintering and aggregate in large numbers near the Wanquan River estuary for spawning [29]. These species replace the B. novaezeelandiae and C. snyderi as the main abundance contributors to the MW (Table 3). In spring, the strengthening of high-salinity water reduces the extent of MW along both the eastern and western coasts. Meanwhile, marine species like A. japonicum migrate northwestward with the warm water mass. High abundance and biomass density zones, primarily contributed by marine species such as S. undosquamis, D. maruadsi, and S. tumbil, emerge in the southeastern high-salinity and MW regions, forming a distinct spatial asymmetry. The community exhibits a clear trend of warmer and higher salinity (Figure 6). These findings highlight the need for dynamic fisheries management. Spawning sites identified can be used for seasonal closures to protect critical life stages.
4.3. The Impact of Water Masses on Diversity
The fish community diversity in the waters around Hainan Island showed pronounced seasonal and spatial variations. In winter, high values of the species richness index (D) were concentrated in the high-salinity OW south of the island, indicating that this area serves as an important overwintering ground with considerable species reserves. In contrast, the hotspots of the H′ and J′ were located farther east, mainly within the convergence zone of CW and MW. Thermohaline fronts in the South China Sea may enhance nutrient transport from shallow shelf waters to offshore areas [35], potentially supporting higher evenness in these transitional zones. Statistically, J′ in MW was significantly higher than in OW (p < 0.05), while OW exhibited the lowest H′ among the three water masses. This pattern reflects the strong dominance of A. japonicum in offshore waters during winter [27]. Regression analysis confirmed that A. japonicum was the only significant driver of abundance variation in that season; its locally dense aggregations reduced community evenness and thus constrained overall diversity levels.
In spring, the centers of diversity shifted distinctly northward and shoreward. Higher richness areas moved to the CW and MW regions in eastern Hainan Island, with the highest species richness recorded in CW. Simultaneously, significantly elevated H′ and J′ values were observed in CW near northeastern Hainan Island and the Qiongzhou Strait, both markedly exceeding those in OW during the same period. The seasonal increase in temperature and salinity likely stimulated the inshore migration of Br and Eu species from OW into the lower-salinity MW and CW zones. As conditions change, marine species are colonizing areas that were historically cooler and less saline [36]. Warming water also provides optimal thermal conditions for early life stage development [37]. This influx of species with differentiated ecological niches promoted a more balanced species distribution and ultimately enhanced overall community diversity. The observed diversity shifts reveal coastal ecosystem vulnerability to climate change, underscoring the need to integrate climate adaptation into long-term conservation plans.
5. Conclusions
This study demonstrates that the fish community around Hainan Island is predominantly composed of warm-water marine species, with its spatio-temporal structure significantly modulated by seasonal water mass dynamics. In winter, the euryhaline J. taiwanensis and the marine A. japonicum serve as primary bioindicators for the Coastal Water and Offshore Water, respectively, reflecting strict environmental filtering. The spring monsoonal transition facilitates the intrusion of high-temperature and high-salinity Offshore Water into the Mixed Water region. This hydrographic shift prompts a distinct successional trend where migratory marine species, notably S. undosquamis, replace winter species to become the primary drivers of regional abundance and biomass. Driven by these thermohaline fluctuations, the centers of community diversity undergo a significant northward and shoreward migration, transitioning from the Mixed Water toward the Coastal Water regions in eastern Hainan Island. The identified diversity seasonal migration patterns provide a scientific basis for formulating dynamic resource conservation measures and sustainable utilization plans. Further research should focus on specific characteristics of Hainan Island’s water mass, such as nutrient flux and primary productivity.
The reference list from the paper itself. Each links out to its DOI / PubMed record.
- 1Landeros-Tafolla D. Sánchez-Velasco L. Beier E. Jiménez-Rosenberg S.P.A. Kurczyn J.A. Godínez V.M. Seasonal contrast of water masses and larval fish habitats at the entrance of the Gulf of California J. Mar. Syst.202424210393610.1016/j.jmarsys.2023.103936 · doi ↗
- 2Tiedemann M. Fock H.O. Döring J. Badji L.B. Möllmann C. Water masses and oceanic eddy regulation of larval fish assemblages along the Cape Verde Frontal Zone J. Mar. Syst.2018183425510.1016/j.jmarsys.2018.03.004 · doi ↗
- 3Wang S. Wu F. Gong X. Liu H. Rao Y. Zhang S. Hou G. Huang H. Effects of water mass dynamics on the structure and distribution of fish egg community in Daya bay Mar. Environ. Res.202521110733910.1016/j.marenvres.2025.10733940694995 · doi ↗ · pubmed ↗
- 4Tian F.G. He W. Huang B.B. Lou Q.S. Hu H.N. Deng W. Spatial distribution of eggs of Stolephorus commersonnii in the Pearl River Estuary Chin. J. Ecol.20234269470110.13292/j.1000-4890.202303.018 · doi ↗
- 5Jin S. Nie X. Wang G. Teng F. Xu T. Analysis of the Distribution and Seasonal Variability of the South China Sea Water Masses Based on the K-means Cluster Method J. Mar. Sci. Eng.20231148510.3390/jmse 11030485 · doi ↗
- 6Xie L.L. Zhang S.W. Zhao H. Overview of studies on Qiongdong upwelling J. Trop. Oceanogr.201231354110.11978/j.issn.1009-5470.2012.04.005 · doi ↗
- 7Lin S. Liang W. Integrating Functional and Phylogenetic Diversity to Assess Bird Community Assembly Along the Major Rivers of Hainan Island, South China Ecol. Evol.202515 e 7096210.1002/ece 3.7096239931247 PMC 11808277 · doi ↗ · pubmed ↗
- 8Wang C. Li S. A new genus and nine species of jumping spiders from Hainan Island, China (Araneae, Salticidae)Zoo Keys 20221118397210.3897/zookeys.1118.8933736761805 PMC 9848636 · doi ↗ · pubmed ↗