Distinct Clinical Significance of Minimal Residual Disease Detected by 7NB-mRNAs Expression in Bone Marrow at Different Time Points of High-Risk Neuroblastoma Patients
Cho Yee Mon, Kaung Htet Nay Win, Akihiro Nishimura, Naoko Nakatani, Akihiro Tamura, Nobuyuki Yamamoto, Nanako Nino, Suguru Uemura, Atsuro Saito, Toshiaki Ishida, Takeshi Mori, Daiichiro Hasegawa, Keisuke Okuno, Yoshiyuki Kosaka, Kikyo Ishizawa, Mayuno Umemoto, Taisei Matsui

TL;DR
This study shows that measuring specific mRNAs in bone marrow at certain treatment stages can predict relapse in high-risk neuroblastoma patients.
Contribution
The study identifies EOH and EOC as optimal time points for evaluating BM-MRD using a 7NB-mRNA ddPCR assay in high-risk neuroblastoma.
Findings
BM-MRD at EOH and EOC was significantly associated with relapse in high-risk neuroblastoma patients.
Higher BM-MRD levels (≥ 3.5) at EOH and EOC correlated with worse 3-year event-free survival.
The 7NB-mRNA ddPCR assay provides a reliable method for MRD detection at specific treatment stages.
Abstract
More than half of patients with high-risk neuroblastoma (NB) relapse, likely driven by chemoresistant minimal residual disease in the bone marrow (BM-MRD). Although several quantitative PCR (qPCR) and droplet digital PCR (ddPCR) assays measuring different but overlapping sets of NB-associated mRNA (NB-mRNAs) have demonstrated a significant prognostic value at various time points, the optimal combination of MRD markers (a set of NB-mRNAs) and evaluation timing remain uncertain. Here, we evaluated BM-MRD with a 7NB-mRNAs ddPCR assay quantifying CRMP1, DBH, DDC, GAP43, ISL1, PHOX2B, and TH mRNAs across clinically relevant treatment stages. We analyzed 89 bone marrow samples obtained from mostly overlapping 30 high-risk NB patients at four time points: diagnosis (Dx), end of induction (EOI), end of high-dose chemotherapy (EOH), and end of consolidation (EOC). At EOH and EOC time points,…
Genes, proteins, chemicals, diseases, species, mutations and cell lines named across the full text — each resolved to its canonical identifier and authoritative record.
Click any figure to enlarge with its caption.
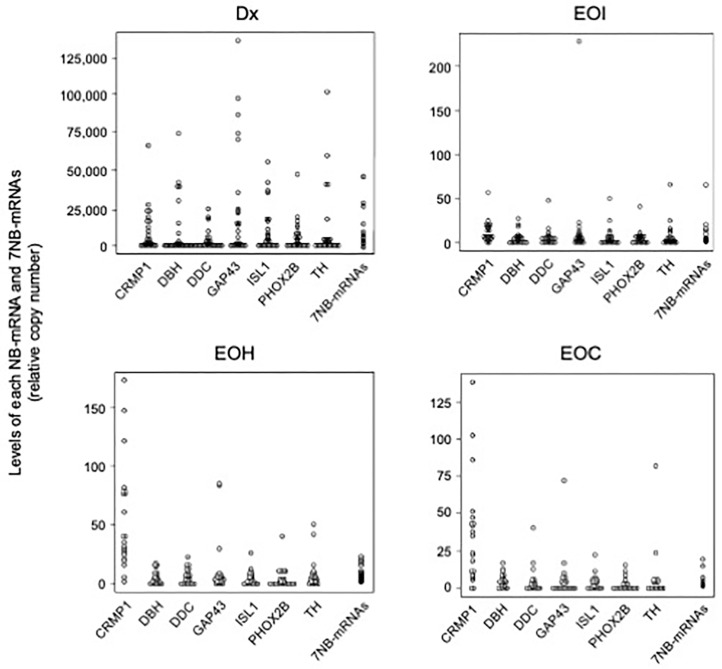 Figure 1
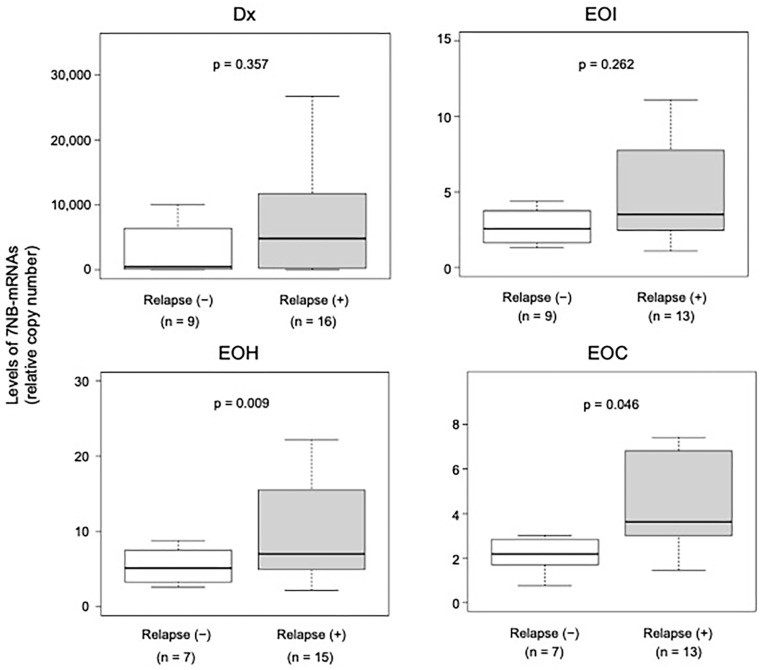 Figure 2
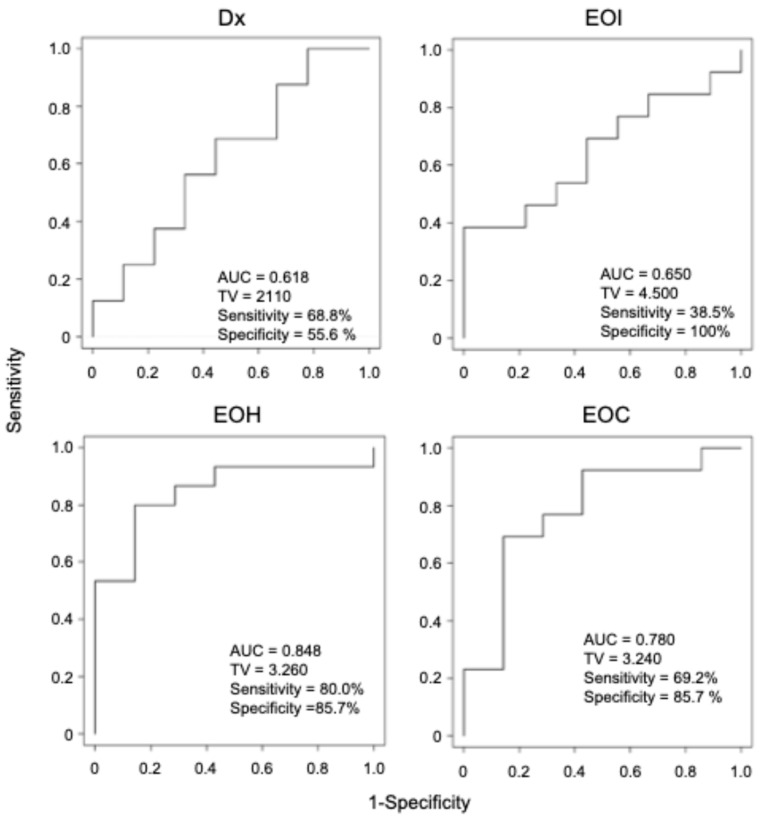 Figure 3
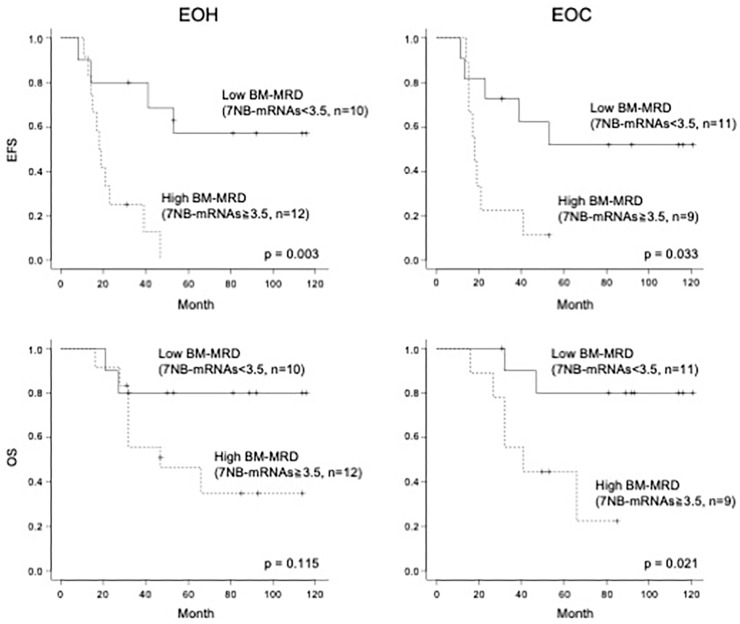 Figure 4
- —Grants-in-Aid for Scientific Research (KAKENHI) from Japan Society for the Promotion of Science
- —Japan Agency for Medical Research and Development (AMED) through the Translational Research Program
- —Children’s Cancer Association of Japan
- —Kawano Pediatric Medical Scholarship Foundation
- —Sysmex Corporation
Peer Reviews
No public reviews on file for this paper yet. If you reviewed it on a platform where reviews are public (OpenReview, ICLR, NeurIPS, ICML), you can paste yours below so the community can read it here.
Videos
No videos yet. Explain this paper in a talk, walkthrough, or lecture? Add one.
Taxonomy
TopicsNeuroblastoma Research and Treatments · Cancer, Hypoxia, and Metabolism · Glioma Diagnosis and Treatment
1. Introduction
Neuroblastoma (NB) is the most common extracranial solid malignancy of childhood, accounting for approximately 8–10% of pediatric cancers and ~15% of pediatric cancer–related deaths [1]. In Japan, more than 150 children are newly diagnosed with NB each year [2]. NB arises from neural crest-derived cells of the sympathetic nervous system and exhibits marked clinical and biological heterogeneity, ranging from spontaneously regressing tumors in infants to aggressively progressive disease in older children [3,4]. Accordingly, newly diagnosed NB patients are stratified into low-, intermediate-, and high-risk groups based on established clinical and biological prognostic factors [5,6]. While outcomes are excellent for low- and intermediate-risk patients with >90% long-term survival, high-risk patients remain below 60% long-term survival [6,7].
High-risk NB is treated with intensified multimodal therapy consisting of induction therapy (chemotherapy and surgical resection), consolidation therapy (single or tandem high-dose chemotherapy with autologous peripheral blood stem cell transplantation (PBSCT) and radiation), and post-consolidation therapy (anti-GD2 immunotherapy and isotretinoin) [7,8]. Although nearly 80% of high-risk NB patients respond to induction therapy, many harbor minimal residual disease (MRD) that can later drive relapse. Consequently, more than half of patients with high-risk NB experience relapse, which remains the leading cause of cancer-related death in this population. Accurate MRD assessment is therefore critical for monitoring disease burden and treatment response and for improving risk-adapted management [9,10].
For three decades, MRD assessment in NB has relied on sets of NB-associated mRNAs (NB-mRNAs) to detect NB cells in bone marrow (BM), peripheral blood (PB), and peripheral blood stem cell (PBSC) samples, because NB lacks highly recurrent, universally applicable genomic aberrations [11,12]. Among the available approaches, quantitative PCR (qPCR) and droplet digital PCR (ddPCR) assays that quantify different but overlapping sets of NB-mRNAs have shown a significant prognostic value for MRD in BM (BM-MRD), PB (PB-MRD), and PBSC (PBSC-MRD) [13,14,15,16,17,18,19,20,21].
The clinical significance of MRD in NB depends on the sample type (BM, PB, or PBSC), the MRD markers (a set of NB-mRNAs), and the timing of evaluation [22]. Because BM is the most common site of relapse, BM-MRD has been studied most extensively. However, prior studies assessed BM-MRD at different time points and reported inconsistent results. At diagnosis (Dx), some studies found BM-MRD to be prognostic [14,16,19], whereas others reported no significant association with outcomes [18,23]. Likewise, BM-MRD after the end of consolidation (EOC) was associated with relapse in one study [18], but not at EOC in another study [17]. These discrepancies underscore the need to define clinically informative evaluation time points. Because the expression profiles of NB-mRNAs may vary at different evaluation time points, it is important to determine the optimal combination of MRD markers (a set of NB-mRNAs) and evaluation time points for BM-MRD evaluation.
In the present study, we evaluated BM-MRD with a 7NB-mRNA ddPCR assay quantifying CRMP1, DBH, DDC, GAP43, ISL1, PHOX2B, and TH mRNA at four time points: Dx, end of induction (EOI), end of high-dose chemotherapy (EOH), and EOC [18,24]. A total of 89 BM samples (25 Dx, 22 EOI, 22 EOH, and 20 EOC) were collected from mostly overlapping 30 high-risk NB patients and subjected to BM-MRD evaluation.
2. Materials and Methods
2.1. Patients and Samples
This study included 30 patients with high-risk neuroblastoma (NB) who provided bone marrow (BM) samples at one or more of the following time points: diagnosis (Dx), end of induction (EOI), end of high-dose chemotherapy (EOH), and/or end of consolidation (EOC) between December 2012 and November 2023. Patients were diagnosed and risk-stratified according to the Children’s Oncology Group (COG) Neuroblastoma Risk Stratification System [25,26] or the International Neuroblastoma Risk Group (INRG) Classification System [5]. All patients were treated at Kobe University Hospital, Kobe Children’s Hospital, or Tottori University Hospital using the standard high-risk NB regimen in Japan, based on the JN-H-07 [27], JN-H-11 [28], or JN-H-15 (UMIN000016848) protocol of the Japanese Children’s Cancer Group (JCCG) Neuroblastoma Committee (JNBSG). Treatment consisted of induction therapy (five cycles of induction chemotherapy with or without surgical resection) followed by consolidation therapy (single high-dose chemotherapy followed by autologous peripheral blood stem cell transplantation (PBSCT), with or without surgical resection, and radiotherapy). With written informed consent, BM samples were collected at the following time points: Dx (before initiation of treatment), EOI (after completion of induction therapy), EOH (after hematopoietic recovery following single high-dose chemotherapy and autologous PBSCT), and EOC (after completion of consolidation therapy). This study was conducted in accordance with the Clinical Research guidelines of Kobe University Graduate School of Medicine and was approved by the Institutional Review Boards of Kobe University Graduate School of Medicine (No. 180278), Kobe Children’s Hospital (No. 30-80), and Tottori University Hospital (No. 18A218).
2.2. 7NB-mRNAs ddPCR Assay
7NB-mRNAs ddPCR assay was performed as previously described [18]. Briefly, nucleated cells were isolated from BM samples using a Lymphoprep (Abbott Diagnostics Technologies, Oslo, Norway). Total RNA was extracted with a TRIzol Plus RNA Purification Kit (Life Technologies, Carlsbad, CA, USA). cDNA was synthesized from 0.5 to 1.0 µg of total RNA using a QuantiTect Reverse Transcription Kit (Qiagen, Valencia, CA, USA) and stored at −80 °C until analysis. Expression of 7 NB-mRNAs (CRMP1, DBH, DDC, GAP43, ISL1, PHOX2B, and TH mRNAs) and the reference gene mRNA (HPRT1 mRNA) was quantified on a QX200 ddPCR system (Bio-Rad Laboratories, Hercules, CA, USA) in accordance with the MIQE framework and the digital MIQE guidelines for reporting quantitative PCR and digital PCR experiments [29,30]. The combined 7NB-mRNA level (7NB-mRNAs) was defined as a weighted sum of the relative copy numbers for the seven targets; for each NB-mRNA, the weight was set as the reciprocal of the 90th percentile value measured in non-NB BM control samples, as previously reported [18].
2.3. Statistical Analysis
Differences in 7NB-mRNA levels between the two groups were assessed using the Mann–Whitney U test. Receiver operating characteristic (ROC) curves were constructed to evaluate the ability of 7NB-mRNA levels to discriminate patients with and without relapse, and the area under the curve (AUC) was calculated. AUC values of 0.50–0.69 were considered low accuracy, 0.70–0.89 moderate/significant accuracy, and 0.90–1.00 high accuracy [31]. Threshold value (TV) was determined as the point that maximized the Youden index (sensitivity + specificity − 1) on the ROC curve. The cut-off value was then chosen to optimize sensitivity and specificity, with a preference for specificity, and was subsequently rounded to a clinically meaningful value. Event-free survival (EFS) and overall survival (OS) were estimated using the Kaplan–Meier method and compared with the log-rank test. EFS was defined as the time from diagnosis to relapse or progression, and OS as the time from diagnosis to death. All tests were two-sided, and p < 0.05 was considered statistically significant. Statistical analyses were performed using EZR (version 1.68), a graphical user interface for R (version 4.23) based on R Commander (version 2.92) [32].
3. Results
3.1. Patient Characteristics and Sample Availability
A total of 30 high-risk NB patients were included (Table 1). They showed the typical characteristics of high-risk NB. Most patients were ≥18 months of age (86.7%, 26/30) and had primary adrenal tumors (80.0%, 24/30). BM metastasis at diagnosis was present in 90.0% (27/30). Histology was classified as NB in 73.3% (22/30), and tumors were undifferentiated or poorly differentiated in 76.7% (23/30); MYCN amplification was observed in 43.3% (13/30). All patients received the standard high-risk regimen in Japan, which included induction therapy (five cycles of induction chemotherapy with or without surgical resection) and consolidation therapy (single high-dose chemotherapy followed by autologous PBSCT, with or without surgical resection, and radiation), but not post-consolidation therapy (anti-GD2 immunotherapy and isotretinoin). During follow-up (median, 48.5 months; range, 16–121 months), 20 relapse events and 13 deaths occurred. The estimated 3-year EFS and OS were 50.0% (95% confidence interval (CI), 31.3–66.1%) and 66.2% (95% CI, 46.3–80.2%), respectively.
A total of 89 BM samples were obtained from 30 high-risk NB patients at four time points: Dx, 25 samples; EOI, 22 samples; EOH, 22 samples; and EOC, 20 samples. On average, 3.0 BM samples were collected per patient: 1 sample (n = 5), 2 samples (n = 4), 3 samples (n = 8), and 4 samples (n = 13).
3.2. BM-MRD Dynamics Across Dx, EOI, EOH, and EOC Time Points
To examine the clinical significance of BM-MRD at Dx, EOI, EOH, and EOC time points, we first determined the levels of each NB-mRNA (CRMP1, DBH, DDC, GAP43, ISL1, PHOX2B, and TH mRNA) and 7NB-mRNAs in a total of 89 (25 Dx, 22 EOI, 22 EOH, and 20 EOC) BM samples by ddPCR. As summarized in Figure 1, each NB-mRNA and 7NB-mRNAs were detected in 75.3% (469/623) and 100% (89/89) of analyzed samples, and their overall levels were gradually decreased during the course of treatment. As described before [18,33], 7NB-mRNAs were constantly detected in all BM samples at Dx, EOI, EOH, and EOC time points, whereas each NB-mRNA was variably detected in BM samples at different time points: Dx, 92% (161/175); EOI, 69.5% (107/154); EOH, 73.4% (113/154); and EOC, 62.9% (88/140). These results indicated the superior sensitivity of 7NB-mRNAs compared to each NB-mRNA and provided the rationale for the BM-MRD detected by 7NB-mRNA expression in the present study.
3.3. Association Between Relapse and BM-MRD at Dx, EOI, EOH, and EOC Time Points
We next compared the levels of BM-MRD detected by 7NB-mRNAs expression between patients without and with relapse at each time point (Figure 2). BM-MRD levels tended to be higher in patients with relapse at all time points. Differences were not statistically significant at Dx or EOI time points. However, BM-MRD levels were significantly higher in patients with relapse at EOH (p = 0.009) and EOC (p = 0.046) time points.
To evaluate the ability to discriminate patients with and without relapse, we then generated receiver operating characteristic (ROC) curves for BM-MRD at each time point and calculated area under the curve (AUC) values (Figure 3). AUC values were 0.618 at Dx and 0.650 at EOI (both < 0.70; low accuracy), 0.848 at EOH, and 0.780 at EOC (both ≥ 0.7; significant accuracy). Together, these results indicated that BM-MRD at EOH and EOC time points were significantly associated with relapse.
3.4. Survival Stratification by BM-MRD at EOH and EOC Time Points
Given the significant association at EOH and EOC time points, we dichotomized patients at those time points into high and low BM-MRD groups and performed Kaplan–Meier analyses (Figure 4). Based on ROC analyses, cut-off values were selected to optimize sensitivity and specificity, with a preference for specificity, and then rounded to a clinically meaningful threshold of 3.5 at both EOH and EOC time points.
At the EOH time point (n = 22), the estimated 3-year EFS and OS were 50.0% (95% CI, 28.2–68.4%) and 66.0% (95% CI, 41.5–82.2%), respectively. Patients with high BM-MRD (7NB-mRNAs ≥ 3.5; n = 12) had a significantly lower 3-year EFS than those with low BM-MRD (7NB-mRNAs < 3.5; n = 10): 25.0% (95% CI, 6.0–50.5%) versus 80.0% (95% CI, 40.9–94.6%) (p = 0.003). Three-year OS was 55.6% (95% CI, 23.7–78.7%) in the high BM-MRD group and 80.0% (95% CI, 40.9–94.6%) in the low BM-MRD group (p = 0.115).
At the EOC time point (n = 20), the estimated 3-year EFS and OS were 50.0% (95% CI, 27.1–69.2%) and 73.9% (95% CI, 48.2–88.2%), respectively. The high BM-MRD group (7NB-mRNAs ≥ 3.5; n = 9) was associated with significantly worse outcomes than the low BM-MRD group (7NB-mRNAs < 3.5; n = 11): 3-year EFS, 22.2% (95% CI, 3.4–51.3%) versus 72.7% (95% CI, 37.1–90.3%) (p = 0.033); and 3-year OS, 55.6% (95% CI, 20.4–80.5%) versus 90.0% (95% CI, 47.3–98.5%) (p = 0.021). These results demonstrated that BM-MRD at EOH and EOC time points had a significant impact on clinical outcomes.
4. Discussion
In the present study, we evaluated BM-MRD with a 7NB-mRNA ddPCR assay in 89 BM samples collected at 4 time points (Dx, EOI, EOH, and EOC) from mostly overlapping 30 high-risk NB patients. BM-MRD at EOH and EOC, but not Dx and EOI, was significantly associated with relapse risk and survival outcomes (Figure 2, Figure 3 and Figure 4). To our knowledge, this is the first report demonstrating a significant prognostic value of BM-MRD at the EOH time point in high-risk NB patients.
At the EOH time point, BM sampling was performed just after hematopoietic recovery following single high-dose chemotherapy and autologous PBSCT. The observed prognostic impact suggests that relapse-causing NB cells can persist in the BM compartment at this early post-transplantation stage. Such cells may originate from the recipient (survived NB cells during high-dose chemotherapy) and/or the donor (survived/contaminated NB cells in autologous PBSC graft). As exemplified by the clinical observation that BM is the most common site of relapse in high-risk NB patients, NB cells may have therapy resistance and growth advantage and become the relapse-causing NB cells in the BM microenvironment composed of multiple stromal cell types, even after myeloablative high-dose chemotherapy. Although the clinical significance of BM-MRD at EOH has not been reported, several studies have shown that PBSC-MRD is associated with patient outcomes in high-risk NB patients [20,21,34]. Taken together, EOH may represent a particularly informative time point for BM-MRD evaluation in future studies.
At the EOC time point, BM samples were collected after completion of single high-dose chemotherapy followed by autologous PBSCT, with or without surgical resection and radiation [27,28]. In contrast to a previous study [17], we observed a significant association between BM-MRD at EOC and patient outcomes (Figure 2, Figure 3 and Figure 4).
In the present study, BM-MRD at Dx did not show prognostic significance (Figure 2 and Figure 3), although several studies have reported an association between BM-MRD at Dx and patient outcomes [14,19,35]. Likewise, BM-MRD at EOI was not significantly associated with patient outcomes, contrary to multiple prior reports [14,16,19,23,36]. These discrepancies may arise from differences in patient cohort composition, treatment protocols, and MRD markers (a set of NB-mRNAs).
The present data demonstrated that BM-MRD detected by 7NB-mRNAs’ expression had a significant predictive power of relapse in high-risk NB patients, with EOH and EOC emerging as the most informative time points. Clinically, these time points may be particularly useful to stratify high-risk NB patients for the optimal post-consolidation therapies, enabling us to incorporate the BM-MRD evaluation into a high-risk NB treatment protocol.
However, this study has limitations. One limitation is the number of patients and samples. The small number of patients and samples at each time point (n = 20–25) reduced the statistical power, increasing the likelihood of false-negative findings and restricting the generalizability of our results beyond the present cohort. The other limitation is the treatment heterogeneity, especially in post-consolidation therapy. All patients received the standard high-risk NB regimen in Japan, in which post-consolidation therapy was not uniformly administered as frontline treatment and was applied variably as second-line therapy.
5. Conclusions
In summary, we analyzed the clinical significance of BM-MRD at Dx, EOI, EOH, and EOC time points and revealed that EOH and EOC are prognostic evaluation time points for BM-MRD detected by 7NB-mRNAs expression. Notably, an earlier EOH time point provides better timing for BM-MRD evaluation in future studies.
The reference list from the paper itself. Each links out to its DOI / PubMed record.
- 1Li Q. Wang J. Cheng Y. Hu A. Li D. Wang X. Guo Y. Zhou Y. Chen G. Bao B. Long-Term Survival of Neuroblastoma Patients Receiving Surgery, Chemotherapy, and Radiotherapy: A Propensity Score Matching Study J. Clin. Med.20231275410.3390/jcm 1203075436769402 PMC 9918249 · doi ↗ · pubmed ↗
- 2Nakata K. Matsuda T. Hori M. Sugiyama H. Tabuchi K. Miyashiro I. Matsumoto K. Yoneda A. Takita J. Shimizu C. Cancer incidence and type of treatment hospital among children, adolescents, and young adults in Japan, 2016–2018 Cancer Sci.20231143770378210.1111/cas.1589237414740 PMC 10475761 · doi ↗ · pubmed ↗
- 3Matthay K.K. Maris J.M. Schleiermacher G. Nakagawara A. Mackall C.L. Diller L. Weiss W.A. Neuroblastoma Nat. Rev. Dis. Primers 201621607810.1038/nrdp.2016.7827830764 · doi ↗ · pubmed ↗
- 4Chung C. Boterberg T. Lucas J. Panoff J. Valteau-Couanet D. Hero B. Bagatell R. Hill-Kayser C.E. Neuroblastoma Pediatr. Blood Cancer 202168 e 2847310.1002/pbc.2847333818884 PMC 8785544 · doi ↗ · pubmed ↗
- 5Cohn S.L. Pearson A.D. London W.B. Monclair T. Ambros P.F. Brodeur G.M. Faldum A. Hero B. Iehara T. Machin D. The International Neuroblastoma Risk Group (INRG) classification system: An INRG Task Force report J. Clin. Oncol.20092728929710.1200/JCO.2008.16.678519047291 PMC 2650388 · doi ↗ · pubmed ↗
- 6Irwin M.S. Naranjo A. Zhang F.F. Cohn S.L. London W.B. Gastier-Foster J.M. Ramirez N.C. Pfau R. Reshmi S. Wagner E. Revised Neuroblastoma Risk Classification System: A Report from the Children’s Oncology Group J. Clin. Oncol.2021393229324110.1200/JCO.21.0027834319759 PMC 8500606 · doi ↗ · pubmed ↗
- 7Bagatell R. Park J.R. Acharya S. Aldrink J. Allison J. Alva E. Arndt C. Benedetti D. Brown E. Cho S. Neuroblastoma, Version 2.2024, NCCN Clinical Practice Guidelines in Oncology J. Natl. Compr. Cancer Netw.20242241343310.6004/jnccn.2024.004039151455 · doi ↗ · pubmed ↗
- 8Krystal J. Foster J.H. Treatment of High-Risk Neuroblastoma Children 202310130210.3390/children 1008130237628301 PMC 10453838 · doi ↗ · pubmed ↗