The Effect of Periodontitis Severity on Diabetic Retinopathy: An Optical Coherence Tomography Study
Hatice Turkogullari, Gozde Nur Aydogan, Nur Yorgancilar, Oguz Kose, Huseyin Findik

TL;DR
This study finds that severe periodontitis may worsen retinal and choroidal changes in diabetic retinopathy patients, as shown by optical coherence tomography.
Contribution
The novel contribution is identifying advanced periodontitis as a potential factor in retinal degeneration in diabetic retinopathy using OCT and OCTA.
Findings
Severe periodontitis is linked to increased retinal layer thickness and reduced ganglion cell layer thickness in advanced diabetic retinopathy.
Advanced periodontitis correlates with reduced retinal vessel density and enlarged foveal avascular zone in diabetic patients.
Peripapillary choroid-sclera interface and retinal nerve fiber layer thickness decrease with increasing periodontitis severity.
Abstract
Background: The aim of this study was to comprehensively investigate the potential degenerative effects of periodontitis severity on retinal and choroidal structures in patients with different types of diabetic retinopathy (DR). Materials and Methods: The study’s Clinical Trials Registration Number is NCT07137013. A total of 100 participants (56 females and 44 males), each group consisting of 20 individuals, were allocated into five groups: systemically healthy controls (G1), diabetic patients without DR (G2: DM+ DR−), non-proliferative DR without diabetic macular edema (G3: NPDR DME−), non-proliferative DR with diabetic macular edema (G4: NPDR DME+), and proliferative DR (G5: PDR). Ocular examinations were performed using optical coherence tomography (OCT) and OCT angiography (OCTA). Retinal layer thicknesses, choroid-sclera interface (CSI), ganglion cell layer (GCL), retinal nerve…
Genes, proteins, chemicals, diseases, species, mutations and cell lines named across the full text — each resolved to its canonical identifier and authoritative record.
Click any figure to enlarge with its caption.
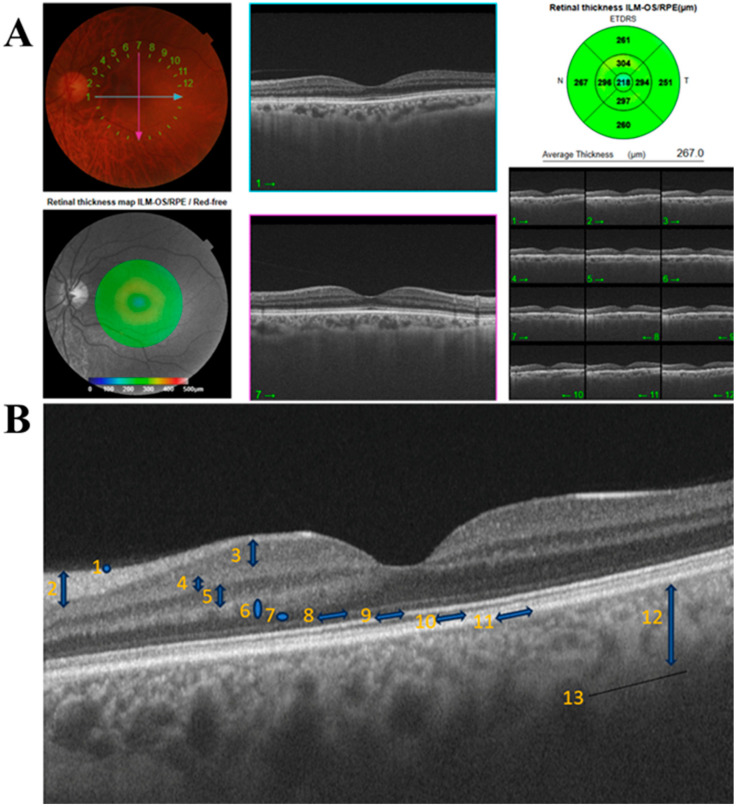 Figure 1
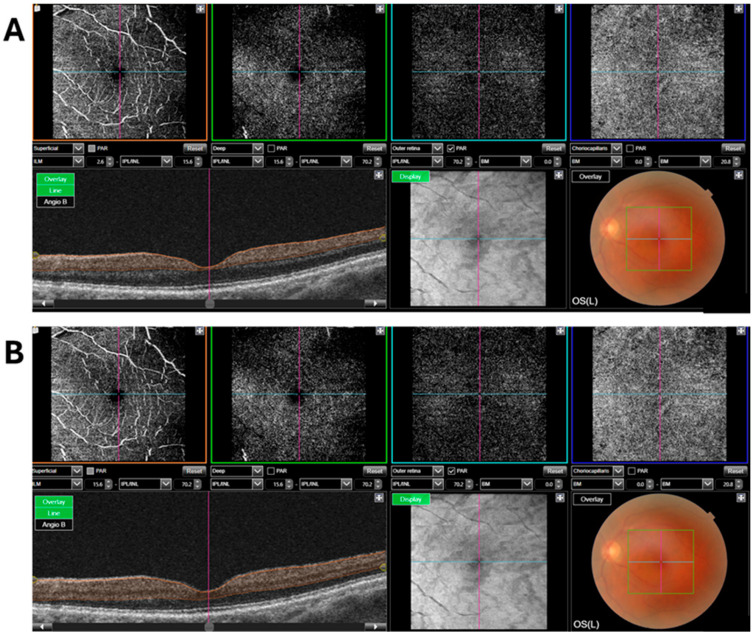 Figure 2
Peer Reviews
No public reviews on file for this paper yet. If you reviewed it on a platform where reviews are public (OpenReview, ICLR, NeurIPS, ICML), you can paste yours below so the community can read it here.
Videos
No videos yet. Explain this paper in a talk, walkthrough, or lecture? Add one.
Taxonomy
TopicsRetinal Diseases and Treatments · Oral microbiology and periodontitis research · Ocular Surface and Contact Lens
1. Introduction
Diabetic retinopathy (DR) is a common microvascular complication of diabetes mellitus (DM) and a major global public health concern, representing one of the leading causes of visual impairment among adults worldwide [1,2]. In DR, thickening of the retinal capillary basement membrane and increased vascular permeability occur, followed by progressive neovascularization and vascular proliferation within the retinal layers [3]. Contemporary imaging modalities are widely used to investigate structural and microvascular changes in the retina [4,5]. Among these, optical coherence tomography (OCT) and OCT angiography (OCTA) are currently considered gold-standard, non-invasive techniques for retinal assessment [6]. OCT enables high-resolution, contact-free measurement of retinal, choroidal, retinal nerve fiber layer (RNFL), and ganglion cell layer (GCL) thicknesses, whereas OCTA allows layer-by-layer visualization of retinal plexuses and quantitative evaluation of microvascular alterations at the capillary level [5,7]. Together, these modalities provide valuable insights into retinal structural and vascular changes in systemic diseases such as DM and periodontitis [8,9,10].
The pathogenesis of DR is primarily driven by chronic hyperglycemia, oxidative stress, inflammatory cytokine release, and endothelial dysfunction [11]. Periodontitis is likewise a chronic inflammatory disease characterized by similar pathophysiological mechanisms and affects nearly half of the global population, with a prevalence exceeding 60% among individuals aged ≥ 65 years [12,13,14,15]. DR is also more frequently observed in older individuals [16]. The association between DR and periodontitis can therefore be explained by shared pathways involving systemic inflammation, oxidative stress, and endothelial dysfunction [14]. Indeed, recent observational studies have suggested a potential link between these two diseases; however, investigations specifically addressing the impact of periodontal disease severity on retinal layer thickness in patients with DR remain limited [8,9,17,18,19,20].
In this context, the hypothesis that periodontal inflammation-induced systemic inflammatory burden may lead to microvascular alterations in the retina, thereby affecting retinal layer thickness, provides an important conceptual framework for explaining the association between DR and periodontitis. Therefore, the present study aimed to evaluate the relationship between periodontitis severity and retinal layer thickness in individuals with different types of DR using OCT and OCTA, and to comprehensively assess the potential effects of periodontal disease on retinal microstructures.
2. Materials and Methods
2.1. Ethical Approval
This cross-sectional study was conducted between February and June 2025 with the participation of 100 individuals aged ≥ 60 years (56 females and 44 males) who presented to the Department of Ophthalmology, Faculty of Medicine, Recep Tayyip Erdoğan University (RTEU). The study protocol was approved by the RTEU Non-Interventional Clinical Research Ethics Committee (Approval No: 2025/59) and was carried out in accordance with the principles of the Declaration of Helsinki. The study details were explained to all participants, and both written and verbal informed consent were obtained prior to enrollment. The study’s Clinical Trials Registration Number is NCT07137013.
2.2. Study Groups
Participants who met the inclusion criteria were allocated into five groups, each consisting of 20 individuals: Systemically healthy controls (G1), diabetic patients without DR (G2: DM+ DR−), patients with non-proliferative DR without diabetic macular edema (G3: NPDR DME−), patients with non-proliferative DR with diabetic macular edema (G4: NPDR DME+), and patients with proliferative DR (G5: PDR). All ophthalmologic diagnoses were established by an experienced ophthalmologist (H.F.).
According to the current periodontal disease classification [15], participants were further categorized into two groups based on periodontitis severity: stage I–II and stage III–IV.
A diagnosis of DM required an HbA1c level ≥ 6.5% [21]. Individuals with autoimmune diseases, osteoporosis, malignancy, those using immunosuppressive agents, oral contraceptives, or bisphosphonates, pregnant individuals, patients with vitreoretinal, optic nerve, or choroidal vascular diseases, cataract, glaucoma, retinal degeneration, uveitis, Behçet’s disease, or scleritis, a history of refractive or intraocular surgery, active infectious diseases (e.g., acute hepatitis, tuberculosis, AIDS), chronic medication use affecting periodontal tissues (e.g., cyclosporine A, phenytoin), or antioxidant supplementation were excluded from the study.
2.3. Sample Size Calculation
Sample size estimation was performed using G*Power (ver.3.1.9.7) software. Based on an effect size (d) of 0.40, a type I error rate (α) of 0.05, and a statistical power of 90% (1 − β), the total required sample size was calculated as 100 participants, with at least 20 individuals per group.
2.4. Examiner Calibration
Calibration for OCTA foveal avascular zone (FAZ) measurements and clinical periodontal measurements was performed by four examiners (H.F. and H.T., G.N.A, N.Y., respectively) in 10 individuals (5 with stage I–II and 5 with stage III–IV periodontitis) who were not included in the study, at two time points (baseline and 2 weeks later). The intraclass correlation coefficients were 0.969 for FAZ measurements and 0.978 for probing pocket depth (PPD), indicating excellent reproducibility. With a 99% confidence interval, these results were considered highly reliable (p < 0.0001).
2.5. Clinical Periodontal Measurements
Plaque index (PI) [22], gingival index (GI) [22], bleeding on probing (BOP) [23], PPD [24], and clinical attachment loss (CAL) [24] were recorded using a Williams periodontal probe (Hu-Friedy, Chicago, IL, USA). PPD was defined as the distance between the gingival margin and the deepest point of the periodontal pocket, and CAL as the distance between the cemento-enamel junction and the base of the pocket. Measurements were obtained at six sites per tooth (mesiobuccal, mid-buccal, distobuccal, mesiolingual, mid-lingual, and distolingual) for all teeth except third molars. PI and GI were assessed at four sites (mesial, distal, buccal, and palatal).
2.6. Optical Coherence Tomography Measurements
Prior to OCT imaging, pupil dilation was performed in all participants. Measurements were obtained by an experienced ophthalmologist (H.F.) using swept-source OCT and OCTA (DRI OCT Triton; Topcon, Tokyo, Japan).
Macular thickness was evaluated using a nine-sector map centered on the fovea according to the Early Treatment Diabetic Retinopathy Study (ETDRS) (Bethesda, MD, USA) grid. The central 1 mm circle represented the foveal area, the surrounding 3 mm ring corresponded to the inner retinal layers, and the outer 6 mm ring represented the outer retinal layers (Figure 1A).
Based on the ETDRS grid, retinal layer thickness, choroid–sclera interface (CSI), GCL+ (GCL + inner plexiform layer (IPL)), and RNFL thicknesses were measured in nine regions. In addition, peripapillary CSI (BM–CSI) thickness was measured in four quadrants (superior, inferior, nasal, and temporal) using grid mode 4 [25] (Figure 1B). RNFL total thickness was defined as the global average thickness obtained from a circular peripapillary scan and automatically calculated by the OCT device as the mean value of the superior, inferior, nasal, and temporal quadrants. Measurements from the right and left eyes were averaged to obtain a single subject-level value for each parameter, and all statistical analyses were conducted using average data.
2.7. Optical Coherence Tomography Angiography Measurements
OCTA was used to assess vessel density and FAZ parameters in both superficial and deep retinal layers. A 6 × 6 mm scan area was applied for all images. The superficial retinal layer was defined as the region from 2.6 to 15.6 μm from the inner limiting membrane (ILM), and the deep retinal layer as the region from 15.6 to 70.2 μm from the ILM.
Vessel density was measured in the foveal area (central 1 mm diameter) and the parafoveal ring (1–3 mm), which was further divided into four quadrants: superior, inferior, nasal, and temporal (Figure 2).
The central retinal region in which no vascular structures were detectable was defined as the FAZ. The FAZ area was manually measured in all patients. Two reference lines passing through the center of the FAZ were drawn on each image: one along the superior-inferior axis (vertical) and the other along the temporal-nasal axis (horizontal). These lines symmetrically divided the FAZ into four quadrants, thereby establishing a central reference framework. Using these reference axes, the inner boundary of the FAZ was carefully delineated manually according to the points where the surrounding capillary network began. During this process, the innermost points of the capillary loops bordering the vessel-free zone were used as reference points for boundary delineation. The resulting closed contour was subsequently measured by the analysis software to calculate the FAZ area.
2.8. Statistical Analysis
Statistical analyses were performed using SPSS Statistics version 26 (IBM Corp., Armonk, NY, USA). The normality of the distribution of continuous variables was assessed using skewness and kurtosis values. Since parametric assumptions were satisfied, independent samples t-tests were used for comparisons between two groups, and one-way analysis of variance (ANOVA) was applied for comparisons among three or more groups. The chi-square (χ^2^) test was used to analyze categorical variables such as age and sex. p value < 0.05 was considered statistically significant.
3. Results
3.1. Demographic Findings
The study population consisted of 56 females and 44 males. 57 participants were in the 60–65 age range, and 43 were 66 years and older. Chi-square analysis revealed no statistically significant differences in gender (χ^2^ = 1.440; p = 0.230) or age (χ^2^ = 1.96; p = 0.162) distributions. When the distribution of participants according to the five study groups (G1–G5) was examined, it was observed that the ratio of women to men (χ^2^ = 3.409, p = 0.492) and the age distribution (χ^2^ = 1.877, p = 0.758) were relatively balanced in each group. This indicates that the groups were demographically homogeneous (Table 1) (Supplementary Table S1) (Changes in HbA1c values are presented in Supplementary Table S1).
3.2. Association Between Retinal Layer Thickness and Periodontal Disease Severity
With increasing periodontitis stage, significant increases were observed in the 1 mm central, 3 mm superior and temporal, and 6 mm inferior retinal layer thicknesses in the G4 and G5 groups. In contrast, in the G3 group, negative correlations with periodontitis stage were detected in the 1 mm central and 6 mm temporal retinal layers. A statistically significant increase in the 6 mm nasal retinal layer thickness was observed only in the G5 group (p = 0.025) (Table 2).
3.3. Association Between CSI Values and Periodontal Disease Severity
In the G3, G4, and G5 groups, significant decreases were observed in the 1 mm central, 3 mm superior and nasal, and 6 mm nasal CSI layers as periodontitis stage increased. In addition, statistically significant reductions were detected in the temporal regions (3 mm and 6 mm) in the G3 and G5 groups. A significant decrease was observed in the 3 mm inferior region in the G3 group and in the 6 mm superior region in the G4 group. As periodontitis severity increased, a significant decrease was noted in the 6 mm nasal region in the G2 group, whereas a significant increase was detected in the 6 mm inferior region in the G1 group (p = 0.012) (Table 3).
3.4. Association Between GCL+ Values and Periodontal Disease Severity
In the G5 group, statistically significant reductions were observed in almost all regions, except for the 3 mm nasal and inferior areas. Moreover, thinning the 1 mm central GCL+ was detected in the G3 and G4 groups with increasing periodontitis stage (Table 4).
3.5. Association Between RNFL Values and Periodontal Disease Severity
In the G5 group, statistically significant decreases were observed across all regions as periodontitis stage increased. Additionally, in the superior RNFL, a significant decrease was detected in the G4 group, whereas a significant increase was observed in the G1 group (Table 5).
3.6. Association Between Peripapillary CSI (BM–CSI) Values and Periodontal Disease Severity
In all groups, a statistically significant decrease in nasal CSI was detected with increasing periodontitis stage. In the superior and temporal CSI regions, significant reductions were observed in all groups except for G1. In the inferior CSI region, a statistically significant decrease associated with periodontitis severity was observed only in the G5 group (p = 0.049) (Table 6).
3.7. Association Between Superficial Retinal Layer Vessel Density (ILM 2.6- IPL/INL15.6) and Periodontal Disease Severity
As periodontitis stage increased, statistically significant decreases in superficial retinal layer vessel density were observed in the central region in the G3 group, the inferior region in the G4 group, and the nasal region in the G5 group (Table 7).
3.8. Association Between Deep Retinal Layer Vessel Density (ILM 15.6-IPL/INL70.2) and Periodontal Disease Severity
In the G3 and G4 groups, significant decreases in vessel density were recorded in the deep central and temporal regions with increasing periodontitis stage. In addition, a similar decrease was observed in the deep temporal region in the G2 group. The reduction in vessel density was statistically significant in the deep inferior region in the G4 group and in the deep superior region in the G5 group (Table 8).
3.9. Association Between FAZ (Superficial and Deep) Values and Periodontal Disease Severity
In both superficial and deep FAZ measurements, a statistically significant increase was detected in the G2 group as periodontitis stage increased. Furthermore, in the G5 group, a significant increase was observed only in the deep FAZ (Table 9).
4. Discussion
The association between periodontitis and DR is primarily attributed to shared mechanisms involving systemic inflammation, oxidative stress, and endothelial dysfunction [12,13,14,17,18,19]. In diabetes, hyperglycemia-induced overproduction of reactive oxygen species and the accumulation of advanced glycation end products (AGEs) promote endothelial dysfunction, which underlies the development of microvascular complications. This process is closely linked to the vascular damage and heightened inflammatory response observed in DR [3,26]. Similarly, periodontitis, as a chronic source of oral inflammation, increases the systemic inflammatory burden through the release of pro-inflammatory mediators such as Tumor necrosis factor (TNF)-α, Interleukin (IL)-6, and C-reactive protein into the circulation, thereby potentially impairing endothelial function [12,27]. These mechanisms may aggravate diabetic microangiopathy and facilitate the progression of DR. Moreover, periodontitis-related systemic inflammation may contribute to pathological retinal neovascularization by enhancing Vascular Endothelial Growth Factor expression secondary to retinal hypoxia [12,13,14]. In this cross-sectional study, we comprehensively evaluated the relationship between periodontal disease severity and retinal structural changes using advanced imaging modalities. OCT and OCTA enabled the assessment of retinal thickness, CSI, GCL, RNFL, peripapillary CSI, as well as superficial and deep retinal vessel densities and FAZ areas. To our knowledge, this is the first study to demonstrate, in a layer-specific manner, the potential impact of periodontal disease severity on both retinal microvasculature and neural tissues. The findings offer a novel interdisciplinary biomarker perspective for understanding how oral inflammation is reflected in systemic microvascular structures.
In the present study revealed significant structural alterations in retinal, choroidal, and neural layers with increasing periodontal disease severity in patients with DR. The increase in retinal thickness observed particularly in the G4 and G5 groups among individuals with stage III–IV periodontitis, together with regional thinning in the G3 group, indicates that periodontal inflammation extends beyond a localized oral pathology and may influence retinal microvascular structures via systemic pathways. Consistent with our findings, a previous study evaluating intraretinal layer thickness reported significant intergroup differences across all macular regions, with thinning in DM without DR and mild DR, and thickening in moderate DR, likely reflecting edema-related changes (p < 0.001) [28]. Similarly, we observed retinal thinning in the G2 group compared with G1, whereas thickening associated with edema and proliferative changes was evident in advanced DR stages.
In DR, pathological changes including disruption of retinal vascular structures, increased blood-retina barrier permeability, and ischemia-induced microaneurysms, edema, exudation, and neovascularization extend beyond the retina and also affect choroidal thickness and volume [29,30,31]. The choroid, located beneath the retinal pigment epithelium and characterized by rich vascularization, plays a critical role in supplying the outer retinal layers [32]. Several studies have demonstrated a close relationship between DR severity and choroidal alterations [33,34,35,36]. In the cross-sectional study, choroidal thickness generally decreased with increasing periodontal disease severity, with only a few regions remaining unaffected in certain groups. This pattern may reflect a periodontitis-related systemic subclinical pro-inflammatory state. Fernández-Espinosa et al. [36] demonstrated an inverse relationship between increased retinal thickness and choroidal thickness within the underlying pathophysiological processes. Wang et al. [33] reported that in patients with type 2 diabetes and DR, choroidal thickness increased in certain regions, whereas a general thinning was observed as disease severity progressed. Supporting our findings, Lains et al. [34], found that choroidal thickness was significantly lower in patients with PDR compared with the control group. Consistent with previous studies, our findings further demonstrate, for the first time, that both retinal and choroidal layer thicknesses increase in the early stages of periodontitis and decrease in the advanced stages.
In our study, GCL and RNFL thickness progressively decreased with increasing periodontitis severity. The more pronounced alterations observed in the G5 group suggest that periodontal inflammation may interact with DR-related vascular dysfunction, thereby accelerating neurodegenerative processes. Consistent with our findings, Sung et al. [37] reported a progressive reduction in GC-IPL thickness across all retinal layers with advancing stages of DR, while another case–control study [38] demonstrated significantly reduced GC-IPL thickness in both patients with DM without DR and those with DR compared with healthy controls. [38] In a study that included control subjects, patients with DM without DR, and those with NPDR, and evaluated RNFL thickness [39], it was reported that thickness was significantly lower than in the control group only in the superior temporal region in the DM group and in the inferior temporal region in the NPDR group. Although our study is methodologically different, it is valuable in that it compares RNFL thickness according to the severity stages of periodontitis and also includes a proliferative group. Moreover, our findings indicate generally statistically significant reductions in RNFL thickness in the G5 group. In individuals with diabetes, pre-existing microangiopathy may amplify the effects of inflammatory mediators and thereby accelerate neurodegenerative processes [40]. These findings are consistent with the existing literature, suggesting that periodontitis may exert adverse effects on the retina through systemic inflammation and vascular dysfunction [41,42,43].
Interestingly, RNFL thickening was observed in individuals with stage III–IV periodontitis in the G1 group. This finding may reflect transient edema-like changes or increased local vascular permeability induced by periodontal inflammation, as suggested in previous studies [41,44,45]. Thus, in nondiabetic individuals, periodontitis may lead to edema-like reversible retinal changes rather than true neurodegeneration. Supporting this interpretation, Arslan et al. [8] reported increased RNFL thickness in individuals with advanced periodontitis compared with those with early stages. In line with the findings of Arslan et al., it is suggested that periodontitis may induce subclinical inflammatory responses, thereby affect the ocular microvasculature and potentially lead to measurable changes in RNFL thickness. Additionally, in this study, regions showing a significant decrease in peripapillary choroidal thickness also exhibited concomitant and similarly directed significant reductions in RNFL thickness. This finding indicates a positive and significant association between peripapillary choroidal thickness and RNFL thickness.
OCTA findings further demonstrated that increasing periodontal disease severity was associated with significant reductions in superficial and deep retinal vessel densities in specific regions. These results align with previous reports of decreased foveal vessel density in metabolic syndrome and periodontitis [8], reduced superficial capillary density in mild NPDR [46], and diminished deep plexus density in eyes with DME+ [47]. Studies comparing type 1 and type 2 diabetes have also shown significant alterations in both capillary plexuses [48], while others have documented superficial capillary loss in diabetic individuals [49]. Moreover, reductions in peripapillary vessel density with increasing DR severity [50] and associations between vascular density loss and disease duration and severity [48,51,52] further support our observations. The observation of significant increases in superficial and deep FAZ values, particularly in the G2 group [53,54], as the severity of periodontitis increases, indicates that the stage of periodontitis is a factor affecting the FAZ in the early stages of diabetes [8,9,55]. In advanced stages, damage to the retina over time, such as changes in retinal thickness, becomes more pronounced, potentially masking the subtle FAZ changes observed earlier.
This cross-sectional study has several important limitations. Firstly, the failure to evaluate right and left eye data separately [56] precluded the identification of potential interocular differences in retinal layer thickness. This methodological limitation may have led to the neglect of intraocular asymmetries, in addition to interindividual variability, thereby restricting both clinical interpretability and the scientific validity of the findings. Secondly, periodontal disease involves a complex pathophysiological process driven by both chronic inflammatory responses and microbial infection. Considering that these two key mechanisms may affect retinal tissues through distinct biological pathways, evaluating their effects without distinguishing between the inflammatory and infectious components may complicate the biological interpretation of our data. Thirdly, the relatively small sample size and limited number of subgroups restrict the generalizability of the results. Furthermore, the relatively high standard deviations observed in some variables and the limited sample size in the subgroups may have reduced the statistical power to detect significant differences. Another significant limitation is that, because the study design was planned as an image-based cross-sectional analysis, systemic or local inflammatory biomarkers were not evaluated. Additionally, the lack of detailed treatment-related variables, concomitant systemic conditions, and inflammatory laboratory markers may have limited a more comprehensive assessment of potential confounding factors. Finally, the short follow-up period of the study did not allow comprehensive monitoring of structural changes that may occur over time in retinal and periodontal tissues and limited the evaluation of long-term effects. Therefore, future large-scale, long-term, and multicenter studies with larger sample sizes, incorporating multidisciplinary approaches that include systemic and local biomarkers as well as infectious mechanisms, are recommended to advance understanding in this critical field.
5. Conclusions
This cross-sectional study suggests that periodontal inflammation is associated with systemic microvascular dysfunction and may contribute to the pathophysiology of DR. The effects of periodontitis severity on retinal layer thickness and vascularization appear to be more pronounced in the advanced stages of DR.
The reference list from the paper itself. Each links out to its DOI / PubMed record.
- 1Teo Z.L. Tham Y.C. Yu M. Chee M.L. Rim T.H. Cheung N. Bikbov M.M. Wang Y.X. Tang Y. Lu Y. Global Prevalence of Diabetic Retinopathy and Projection of Burden through 2045: Systematic Review and Meta-analysis Ophthalmology 20211281580159110.1016/j.ophtha.2021.04.02733940045 · doi ↗ · pubmed ↗
- 2Tan T.E. Wong T.Y. Diabetic retinopathy: Looking forward to 2030 Front. Endocrinol.202213107766910.3389/fendo.2022.1077669 PMC 986845736699020 · doi ↗ · pubmed ↗
- 3Kang Q. Yang C. Oxidative stress and diabetic retinopathy: Molecular mechanisms, pathogenetic role and therapeutic implications Redox Biol.20203710179910.1016/j.redox.2020.10179933248932 PMC 7767789 · doi ↗ · pubmed ↗
- 4Sinclair S.H. Schwartz S. Diabetic retinopathy: New concepts of screening, monitoring, and interventions Surv. Ophthalmol.20246988289210.1016/j.survophthal.2024.07.00138964559 · doi ↗ · pubmed ↗
- 5Yang Z. Tan T.E. Shao Y. Wong T.Y. Li X. Classification of diabetic retinopathy: Past, present and future Front. Endocrinol.202213107921710.3389/fendo.2022.1079217 PMC 980049736589807 · doi ↗ · pubmed ↗
- 6Ramakrishnan M.S. Kovach J.L. Wykoff C.C. Berrocal A.M. Modi Y.S. American Society of Retina Specialists Clinical Practice Guidelines on Multimodal Imaging for Retinal Disease J. Vitreo Retin. Dis.2024823424610.1177/2474126424123701238770073 PMC 11102716 · doi ↗ · pubmed ↗
- 7Tang F.Y. Chan E.O. Sun Z. Wong R. Lok J. Szeto S. Chan J.C. Lam A. Tham C.C. Ng D.S. Clinically relevant factors associated with quantitative optical coherence tomography angiography metrics in deep capillary plexus in patients with diabetes Eye Vis.20207710.1186/s 40662-019-0173-y PMC 699617232025523 · doi ↗ · pubmed ↗
- 8Arslan H. Yorgancilar N. Kose O. Aslan M.G. Altin A. Bayrakdar S.K. Yemenoglu H. Findik H. Yilmaz A. Periodontitis Provokes Retinal Neurodegenerative Effects of Metabolic Syndrome: A Cross-Sectional Study Dent. J.20241235110.3390/dj 12110351 PMC 1159282639590401 · doi ↗ · pubmed ↗