From Patient Liver Tissue to Organoids: Establishment of a Translational Platform Using Healthy, Steatotic, and Cirrhotic Tissue Sources
Robert F. Pohlberger, Katharina S. Hardt, Mark P. Kühnel, Julian Palzer, Johanna Luisa Reinhardt, Oliver Beetz, Felix Oldhafer, Franziska A. Meister, Katja S. Just, Sarah K. Schröder-Lange, Danny Jonigk, Florian W. R. Vondran, Ralf Weiskirchen, Thomas Stiehl, Anjali A. Roeth

TL;DR
Researchers developed liver organoids from patient tissue samples, including healthy, fatty, and cirrhotic livers, to better study liver diseases and test treatments.
Contribution
A high-success-rate method for generating liver organoids from diverse patient tissues, enabling disease modeling and drug testing.
Findings
45 patient-derived liver organoids were successfully established with an 82% initiation success rate.
Organoids showed high proliferation and co-expression of hepatocyte and cholangiocyte markers.
Mathematical modeling revealed a biphasic growth pattern in the organoids.
Abstract
What are the main findings? 45 patient-derived liver organoids from healthy, steatotic, and cirrhotic tissue were successfully established with an 82% initiation success rate after optimizing the Broutier protocol.The organoids exhibited high proliferation, co-expression of hepatocyte markers (Albumin and HNF4α) and cholangiocyte markers (CK19), sporadic LGR5 positivity, and a biphasic growth pattern, as revealed by mathematical modeling. 45 patient-derived liver organoids from healthy, steatotic, and cirrhotic tissue were successfully established with an 82% initiation success rate after optimizing the Broutier protocol. The organoids exhibited high proliferation, co-expression of hepatocyte markers (Albumin and HNF4α) and cholangiocyte markers (CK19), sporadic LGR5 positivity, and a biphasic growth pattern, as revealed by mathematical modeling. What are the implications of the main…
Genes, proteins, chemicals, diseases, species, mutations and cell lines named across the full text — each resolved to its canonical identifier and authoritative record.
Click any figure to enlarge with its caption.
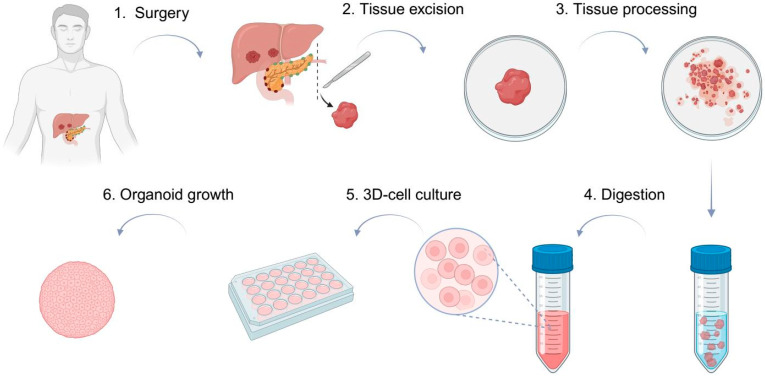 Figure 1
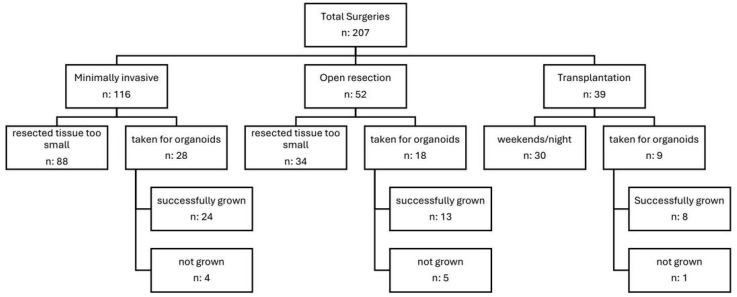 Figure 2
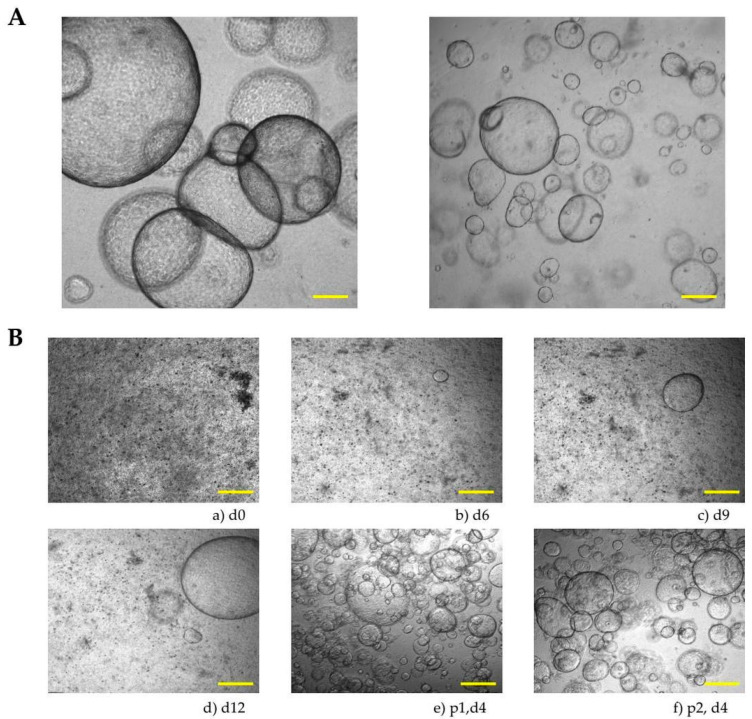 Figure 3
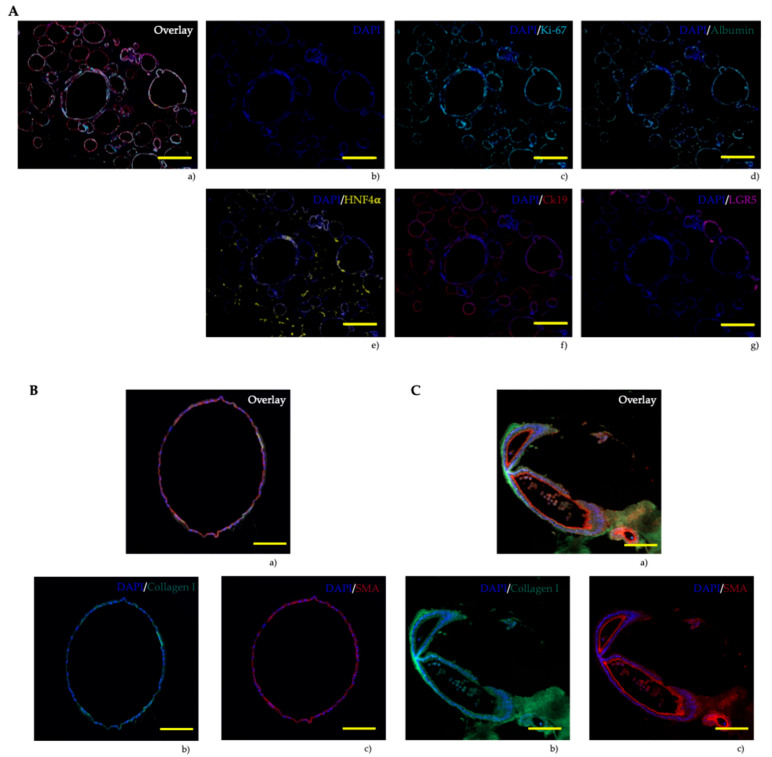 Figure 4
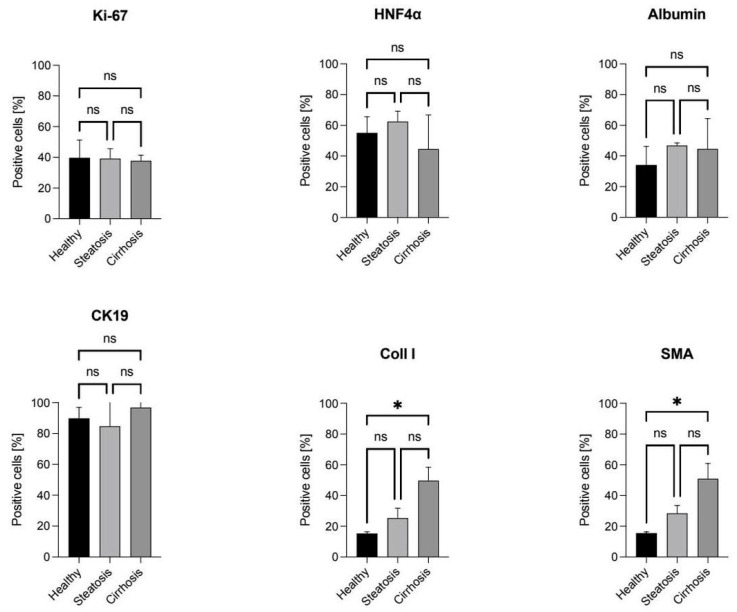 Figure 5
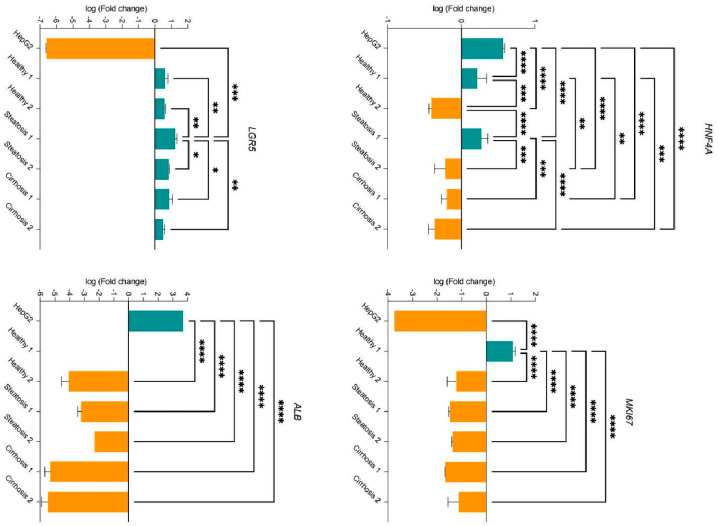 Figure 6
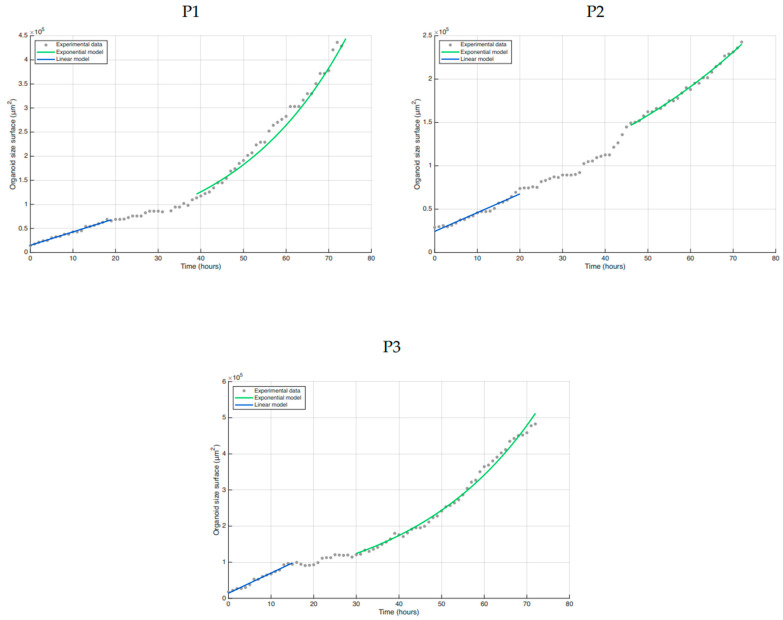 Figure 7
- —IZKF of the Medical Faculty of the RWTH Aachen
Peer Reviews
No public reviews on file for this paper yet. If you reviewed it on a platform where reviews are public (OpenReview, ICLR, NeurIPS, ICML), you can paste yours below so the community can read it here.
Videos
No videos yet. Explain this paper in a talk, walkthrough, or lecture? Add one.
Taxonomy
TopicsLiver physiology and pathology · 3D Printing in Biomedical Research · Cancer Cells and Metastasis
1. Introduction
The liver is an essential digestive organ with several hundred physiological functions, including metabolic functions, immunological functions, and detoxification [1,2]. On a cellular level, the liver is a complex structure composed of hepatocytes, cholangiocytes, stellate cells, Kupffer cells, and liver sinusoidal endothelial cells [2]. Fatty liver and its subsequent liver diseases, such as cirrhosis and hepatocellular carcinoma (HCC), are among the most prevalent and impactful health issues globally. These diseases affect more than 30% of the global population [3,4,5,6]. Metabolically dysfunction-associated steatotic liver disease (MASLD) is a spectrum of conditions, ranging from metabolically associated steatohepatitis (MASH), characterized by steatosis, inflammation, and hepatocyte ballooning, to cirrhosis, and may result in HCC [5,7,8]. It is closely associated with the metabolic syndrome, which includes cardiometabolic criteria such as obesity, insulin resistance, glucose intolerance, and type 2 diabetes mellitus [9,10,11]. MASLD is defined as a steatotic liver disease associated with at least one of the previously described cardiometabolic criteria [12].
Exploring new options for understanding liver diseases is urgently needed, as 2D cell cultures do not adequately mimic cell characteristics such as polarity, morphology, cell–cell interaction, and the (tumor) microenvironment [13,14]. 3D models, such as state-of-the-art patient-derived organoids, are among the most effective methods to overcome these challenges [15,16]. Organoids are clusters of cells with self-renewal and self-organization properties that grow in a 3D extracellular matrix and mimic the characteristics and functionality of the tissues from which they are derived, such as a healthy liver, cholangiocarcinoma, and hepatocellular carcinoma [14,16,17]. This unique ability of organoids to mimic the in vivo environment, as well as their ability to retain genetic and phenotypic characteristics, makes them valuable tools for understanding the complex nature of hepatic diseases [18,19]. These models may then be used for finding new ways to treat hepatic diseases.
In this study, we demonstrate the generation of patient-derived liver organoids obtained from surgeries performed in our hospital, with a focus on pitfalls that must be taken into account when establishing an organoid bank. Additionally, we developed a platform to investigate the organoids on the protein and mRNA level using multiplex immunohistochemical imaging, as well as quantitative PCR (qPCR) [20].
2. Materials and Methods
2.1. Tissue-Derived Liver Organoids
Human liver tissue was obtained from patients who underwent liver surgery between January 2024 and August 2025 at the Department of General, Visceral, Pediatric and Transplant Surgery of the RWTH University Hospital Aachen. Patients were screened to ensure they met our criteria. Before surgery, all patients were required to sign an informed consent for the use of their tissue for research purposes. The study was approved by the Institutional Review Board (IRB) (vote number EK206/09) beforehand. Surgeries were only included if a specific amount of tumor-free tissue could be obtained without affecting pathological examination. Resections were performed for colorectal liver metastasis (CRLM), hepatocellular carcinoma (HCC), cholangiocellular carcinoma (CCC), or transplant cases.
The protocol developed by Broutier et al. was adapted for our specific needs through multiple pilot tests (Figure 1) [21,22].
In summary, the patient’s tissue was minced into small pieces and washed twice with ice-cold Dulbecco’s Modified Eagle Medium (DMEM) containing 4.5 g/L glucose (#11995965, Gibco, Carlsbad, CA, USA) to remove any remaining fat or blood cells. After removing the supernatant, the tissue was washed with digestion media (advanced DMEM/F12 (#12634010, Gibco), 2.5 mg/mL collagenase D (#11088858001, Roche Diagnostics, Rotkreuz, Switzerland), and 0.1 mg/mL DNase I (#10104159001, Roche Diagnostics) and incubated in a shaking incubator (Infors AG, Bottmingen, Switzerland). The cell suspension was then filtered through a 70 μm cell strainer and washed with ice-cold DMEM. The pellet was resuspended in Geltrex (50 μL/24-well) (#A1413202, Gibco) and seeded as domes in 24-well plates for suspension (#662102, Greiner Bio-One GmbH, Kremsmuenster, Austria). Cells were not counted because there was a large number of erythrocytes and debris left in the pellet, which were not capable of forming organoids. The droplets were solidified (37 °C incubator, 30 min) before adding the organoid initiation medium (HepatiCult™ Human Organoid Initiation Medium (#100-0384, Stemcell Technologies, Vancouver, BC, Canada), 10 mM Rho kinase inhibitor (#ab120129, Abcam, Cambridge, UK), 500 µL per well). The media was changed every three days. On day 7, the media was switched to 500 μL per well of the organoid growth medium (HepatiCult™ Human Organoid Growth Medium (#100-0385, Stemcell Technologies). When the culture reached a high organoid density or single organoids exceeded 1 mm in diameter, passaging was performed (1:1 ratio). Here, the cell density in the droplet is approximately 20% at the time of seeding. The Geltrex domes were removed from the wells by scraping, transferred to a tube prefilled with basal medium (advanced DMEM/F12, GlutaMax (#35050061, Gibco), HEPES (#15630056, Gibco), Meropenem (#10170648, Eberth Arzneimittel, Ursensollen, Germany). The organoid suspension was centrifuged for 5 min at 140× g and 4 °C (Eppendorf Centrifuge 5810 R, Hamburg, Germany), and the supernatant was reduced to a volume of up to 2 mL. The pellet was then fragmented using a 22-gauge cannula syringe (3–5 times), split, and centrifuged again under the same conditions. The resulting pellet was cultured following the above-mentioned protocol.
2.2. Patients’ Characteristics
The following equations were used for calculating the patients’ characteristics:
2.3. Immunohistochemical Analysis
2.3.1. Sample and Serial Section Preparation for Formalin-Fixed Paraffin Embedded Blocks
Organoids were fixed with formalin (1 h, 500 µL/24-well). After removing the formalin, the domes were washed with Phosphate-Buffered Saline (#10010023, Gibco). Hematoxylin solution was added to visualize the nucleus. The wells were then filled with 2 % agarose (wide-range, #11406.02, Serva, Heidelberg, Germany) solution and left to solidify before being removed from the well plate. The fixed blocks were embedded in paraffin and cut into 2.5 µm serial sections using a microtome.
2.3.2. Hematoxylin-Eosin Staining
The serial sections were stained first with hematoxylin followed by counterstaining with eosin.
2.3.3. Immunofluorescence Multiplex Imaging
For immunofluorescence multiplex imaging, the following antibodies were used after establishing specificity on controls: mouse Albumin (1:400, #ab236492, Abcam), mouse CK19 (1:600, #ab7755, Abcam), mouse HNF4α (1:500, #ab41898, Abcam), mouse Ki67 (1:500, #M7240, Dako, Santa Clara, CA, USA), mouse LGR5 (1:500, #TA503316, Origene, Rockville, MD, USA), rabbit collagen I (1:400, #CL50151AP, Cedarlane, Burlington, Canada), and rabbit α-SMA (1:200, #ab124964, Abcam). After removing paraffin, antibody retrieval was performed using citrate buffer (#S1699, Target Retrieval Solution, Dako, Santa Clara, CA, USA) in a pressure cooker system (Decloaking Chamber, Biocare Medical, Pacheco, CA, USA), followed by blocking non-specific binding sites (#S3022, Dako). The sections were then incubated at room temperature for 30 min with the primary antibodies. Subsequently, an HRP-conjugated secondary antibody (#MP-7452-15, ImmPRESS HRP, Vector Laboratories, Newark, NJ, USA) was applied. Visualization in fluorescence imaging was achieved using the TSA-Plus Cyanine 5 System (#NEL745001KT, Akoya Biosciences, Marlborough, MA, USA), DAPI (#H-1500, Nuclei staining, Vector Laboratories), and the Opal fluorophores Opal 480 (#FP150001KT), Opal 520 (#FP1487001KT), Opal 570 (#FP1488001KT), Opal 650 (#FP1496001KT), Opal 780 (#FP1501001KT) obtained from Akoya Biosciences (Marlborough, MA, USA). If more than one antibody was used, the starting at the blocking step was repeated.
Fluorescence imaging was conducted using Tissue FAXS (TissueGnostics, Vienna, Austria) and quantitative image analysis was performed with StrataQuest Analysis Software (version 7, TissueGnostics). All antibodies used had been previously established.
2.4. Quantitative Real Time PCR
Total RNA was isolated using a RNeasy Mini kit (#74104, Qiagen, Hilden, Germany) following the manufacturer’s instructions. RNA purity, quantity, and quality were assessed with a microplate reader (Biotek Synergy HT, Winooski, VT, USA). DNA digestion was carried out using Ambion DNase I and DNase I Buffer (#AM2224, Invitrogen, Waltham, MA, USA). cDNA synthesis was performed with the iScript cDNA Synthesis Kit (#1708840, Bio-Rad, Hercules, CA, USA) according to the manufacturer’s protocol. cDNA was amplified with PowerTrack SYBR Green Master Mix (#A46012, Thermo Fisher, Waltham, MA, USA). As a positive control cDNA prepared from mRNA isolated from a human hepatoblastoma cell line (HepG2, available at ATCC), incubated at 37 °C in a humidified atmosphere containing 5% CO_2_, was used. qPCR was performed using an Applied Biosystems 7500 Real-Time PCR System (Waltham, MA, USA) for HNF4a and MKI67 and an Applied Biosystems 7300 Real-Time PCR System (Waltham, MA, USA) for LGR5 and Alb. Expression levels were normalized using the housekeeping gene 36B4 qPCR primer pair (self-designed) and GAPDH (self-designed, NM_001289726.2). The human HNF4a qPCR primer pair (#HP200437, NM_000457, Origene), human MKI67 (#HP206104, NM_002417.5, Origene), human LGR5 (NM_001277226.2, [23]), and human ALB (NM_000477.7, [24]) were used. Sequences are listed in Table 1. C_t_ values (technical triplicates) were normalized to the housekeeping gene. Relative expression levels were calculated using the ΔΔCT method [25], normalized to 36B4 expression in HNF4A and MKI67, and normalized to GAPDH expression in LGR5 and ALB.
2.5. Mathematical Modeling
The surface area of the organoid was calculated as 4πr^2^, where r represents the radius of the organoid manually extracted from time-lapse imaging (ImageXpress Pico, Molecular Devices, San José, CA, USA). The surface was used for comparison with monolayer cultures. A linear model y = a × t + b was fitted to the surfaces calculated during the initial 15 h of the experiment, with time denoted as t and surface area denoted as y. The slope a and intercept b are considered free parameters. For the surfaces calculated between hour 30 and hour 72 of the experiment, an exponential growth model, y = a × exp(b × (t − 30 h)) was used. This model includes two free parameters: the surface area at t = 30 h (a) and the proliferation rate (b). A least square cost function is minimized to measure the distance between the data and the model, with all measurements given equal weight. The linear model was fitted using the fitlm function from MATLAB R2024b (Mathworks, Natick, MA, USA), while the exponential model is fitted using fmincon with an interior-point method.
2.6. Statistical Analysis
All statistical analyses were conducted using GraphPad Prism 10.6.0. Statistical significance was set at p < 0.05, with levels indicated by asterisks (* p < 0.05, ** p < 0.01, *** p < 0.001, and **** p < 0.0001).
3. Results
3.1. Patient’s Characteristics
Patients had a male-to-female ratio of 26:19 (58.42 %), with an average age of 66.6 ± 9 years and a mean BMI of 27.7 ± 4.6 kg/m^2^ (Table 2). Most patients were classified as American Society of Anesthesiologists (ASA) III (N = 28), while fewer were classified as ASA II (N = 9) or ASA IV (N = 7). The mean MASLD score was −0.69 ± 2.38, while the mean Fibrosis-4 (FIB-4) score was 5.45 ± 8.88, and the mean Model for End-Stage Liver Disease (MELD) score was 9.6 ± 7.1, indicating a heterogeneous range of liver function and fibrosis severity [26,27,28].
3.2. Patient-Derived Organoids
Between January 2024 and August 2025, we successfully created 45 organoid lines out of 55 attempts (an 82% success rate, Table 3) using various non-cancerous liver tissues from a total of 207 liver surgeries conducted at our clinic.
These surgeries included cases of hepatocellular carcinoma (HCC), cholangiocarcinoma (CCC), colorectal liver metastasis (CRLM), and cirrhosis (Figure 2).
In total, 207 consecutive patients who underwent liver resections were divided into 116 minimally invasive procedures, 52 open resections, and 39 transplantations. Among the 88 cases of minimally invasive surgery and 34 cases of open resection, the resected tissue was too small to generate organoids. Despite these challenges, we successfully created organoids from 28 patients who underwent minimally invasive surgery and 18 patients with open resection, alongside pathological diagnosis. Overall, we achieved an initiation success rate of over 80%, which remained stable across four passages (82%) but declined after six passages (76%). We were able to consistently culture patient-derived liver organoids from healthy (N = 20), steatotic (N = 12), and cirrhotic tissues (N = 13), including samples obtained through minimally invasive procedures, open surgical resections, and transplant surgeries, under controlled laboratory conditions.
Our study revealed that various external factors, such as small resected tissue size or surgeries conducted at night or on weekends, led to unusable tissue. Approximately 20% of cases did not result in organoid growth. In three of these non-growing cases, contamination with intrahepatic bile duct bacteria was observed. To address this issue, we transitioned from standard penicillin/streptomycin antibiotics to the broad-spectrum meropenem antibiotic, which effectively eliminated contamination in most experiments. Despite the switch to meropenem, multidrug-resistant bacteria were encountered in one experiment.
All patient-derived liver organoids from our study exhibited the same morphology (Figure 3A). In the early stages, we observed small, dense cell aggregates that grew into larger organoids with well-defined borders. The organoids were cultured under stable conditions for several weeks, allowing for experiments such as immunohistochemistry or qPCR (Figure 3B).
3.3. Immunohistochemical Multiplex Analysis
All organoids were fixed in FFPE blocks for analysis of their cellular composition. Using multiplex immunohistochemistry, we applied DAPI and five selected markers to demonstrate the distribution of antibodies in the organoids. Specifically, we used a proliferation marker (Ki-67), two hepatocyte markers (Albumin and HNF4α), a cholangiocyte marker (CK19), a liver stem cell marker (LGR5), and two fibrosis markers (Collagen I and SMA).
Patient-derived liver organoids displayed high proliferation rates, with nearly equal numbers of positive cells in healthy, steatotic, and cirrhotic organoids (approximately 40%) (Figure 4), consistent with their rapid growth. Interestingly, Albumin was expressed in Ki-67-positive cells, which is atypical for the liver, where Albumin is typically expressed in differentiated hepatocytes [29,30]. Healthy tissue organoids showed 35% positive cells, while steatotic or cirrhotic tissue organoids showed slightly higher percentages (around 45%) (Figure 5).
Cells that did not test positive for proliferation showed expression of HNF4α, a characteristic hepatocyte marker [31,32]. Healthy and steatotic tissue organoids had around 60% HNF4α-positive cells, while cirrhotic tissue organoids showed lower percentages (approximately 50%). Additionally, the organoids were assessed for the presence of cytokeratin 19, a marker of cholangiocytes [33]. Our findings indicated that the organoids also exhibited cholangiocyte-specific expression patterns, suggesting liver progenitor cell (LPC) characteristics [34]. However, some parts of the organoids showed LGR5, making it difficult to definitively classify them as either stem cells or mature cells (Figure 4A). To support our findings, quantitative PCR was performed for LGR5. Additionally, Collagen I and α-SMA were stained to evaluate if the organoids retain their specific properties (healthy, steatotic, or cirrhotic) from the tissue from which they were derived. Here, we observed that both antibodies increase from organoids derived from healthy tissue to those derived from steatotic or cirrhotic tissue (Figure 5). To validate these results, quantitative real-time PCR was conducted to confirm whether the organoids exhibited comparable RNA expression patterns (Figure 6).
3.4. Quantitative Real-Time PCR
To demonstrate the feasibility of RNA detection in organoids using qPCR, we assessed the expression of HNF4A, MKI67, LGR5, and ALB in human organoid samples (Figure 6). Organoids derived from both healthy and steatotic tissue displayed significant up- and downregulation of HNF4A. However, some samples showed a particularly pronounced downregulation with a fold change of 0.50. Interestingly, organoids from cirrhotic tissue exhibited consistent downregulation of HNF4A expression. Additionally, MKI67 was slightly downregulated in most samples, with only one healthy organoid showing upregulation of proliferation. To further support our findings in Figure 4, we also assessed LGR5; the samples showed slightly upregulated levels in all organoid samples. The presence of LGR5 is consistent with the findings on protein levels. ALB was downregulated in all analyzed samples. For one organoid specimen, Albumin transcripts were below the limit of detection in the qPCR assay.
3.5. Computer Simulation
To better understand how the dynamics of organoid growth change during the experiment, we monitored the radii of individual organoids over time. Assuming a constant and uniform cell size, the surface area of a single-layered organoid is proportional to its cell number. In Figure 7, we observe a multi-phase growth dynamic.
The initial growth phase up to approximately 20 h is linear. Afterwards, a transition phase begins, followed by exponential growth dynamics until the end of the experiment at 72 h. We interpret the transition phase as the period during which cells switch between the two growth modes. The transition phase accounts for less than one population doubling, resulting in approximately a 25% increase in organoid surface area. To further quantify the growth dynamics, we fitted linear and exponential growth models to the respective time intervals. In the initial phase, we observe an increase in surface area by a factor of 3.6 in P1, 1.5 in P2, and 6.9 in P3, corresponding to 3.3 in P1, 2.0 in P2, and 2.8 in P3 population doublings, assuming that the surface change is proportional to the change in cell numbers. If we neglect cell death, the proliferation rate obtained from the exponential model is 0.037 in P1, 0.019 in P2, and 0.034 in P3, corresponding to population doubling times of 25.0 h in P1, 34.6 h in P2, and 20.6 h in P3.
Taken together, the growth dynamics of human liver organoids follow a non-trivial pattern consisting of three multiple phases.
4. Discussion
In this study, we demonstrated the production and feasibility of generating liver organoids from patients’ tissue obtained during surgery at our clinic. We achieved organoid initiation rates above 80%. By adapting the Huch Group protocol, liver organoid production from tissues under various conditions (healthy, steatotic, and cirrhotic) can be scaled up to compare patients with different diseases and conditions [21,22]. In this context, the benefits of minimally invasive surgery for patients become clear: less tissue needs to be removed, yet less tissue remains for organoid generation [35]. Brightfield microscopy confirmed the successful formation of three-dimensional organoids from the patient’s liver. Nonetheless, the generation of liver organoids from these three patient groups has limitations. For example, no additional fatty acids were added to the medium in the steatotic group. Future studies must determine the effects this addition might have on healthy liver organoids or the absence of it on steatotic organoids. Furthermore, by incorporating Hoechst staining to differentiate between cells and cell debris, these limitations could be addressed, resulting in a more accurate cell count being included in the protocol.
Additionally, we successfully analyzed organoids at the protein and RNA levels. At the protein level, organoids exhibit high Ki-67 expression, indicating their rapid growth. Furthermore, Ki-67 and Albumin were expressed by the same cells, which is not typical for the liver [36]. In addition to these cells, HNF4α was expressed, demonstrating the hepatic nature of the organoids. Moreover, all organoids show high CK19 expression, supporting the idea that liver organoids display both hepatic and biliary features. LGR5 was not fully expressed in the organoids, confirming previous observations from our laboratory [37]. Quantitative PCR supported this finding. Furthermore, using collagen I and α-SMA, we demonstrated that organoids maintain the disease status of the tissue from which they were derived. However, the varied staining patterns suggest different levels of differentiation within individual organoids, which may reflect distinct cell subpopulations or different stages of maturation. Here, the limitation of having only N = 3 per group becomes evident as more organoid lines need to be analyzed.
Additionally, gene expression analysis using quantitative PCR (qPCR) supported these results. HNF4a exhibited variable expression across samples, with some organoids showing upregulation, while others displayed lower expression compared to the reference sample. Overall, the findings suggest a diverse range of HNF4a expression levels among the organoid panel, indicating differing differentiation states. Organoids with elevated HNF4a expression likely demonstrate a more hepatocyte-like phenotype, whereas those with lower expression may suggest dedifferentiation or an immature state. Furthermore, LGR5 and ALB were investigated in order to support these findings. This variability may reflect differences in maturation or heterogeneity within the cultures, requiring further experiments for a comprehensive understanding of the underlying mechanisms. In conjunction with the immunohistochemistry multiplex results, these data highlight significant heterogeneity among organoids derived from different patients. However, the complete cell composition of the organoids remains unclear, as other liver cell types, such as hepatic stellate cells, sinusoidal endothelial cells, and Kupffer cells, have not yet been examined.
Mechanistic, mathematical, and computational modeling is the first step towards achieving a quantitative understanding of organoid growth kinetics and the related cellular processes. By applying simple growth models to the time dynamics of organoid surface area, we discovered that organoid surface area grows linearly within a specific time frame, with variations observed among patients. If the relative change in organoid surface reflects the relative change in cell numbers, an increase would suggest a high division frequency at the beginning of the experiment.
An alternative explanation for this observation could be that spatial rearrangements of cells or culture-related changes in cell diameter or shape due to culture conditions, in the early phase of the experiment, may contribute to the surface growth. In the later phases, the surface area follows an exponential growth curve, with population doubling times of approximately 20–35 h, as expected under optimal growth conditions in the absence of resource limitations. Further experiments are necessary to comprehend the mechanisms underlying the different growth phases and their transitions.
Overall, our data demonstrate that human liver organoids can be reliably generated from patients’ tissue and maintained in vitro, exhibiting growth patterns, hepatic marker expression, and gene expression profiles that are partly consistent with hepatocyte identity. Further research is needed to fully understand the initiation, growth, and cell composition of tissue-derived liver organoids.
5. Conclusions
We have demonstrated that patient-derived liver organoids can be reliably generated from surgical specimens representing healthy, steatotic, and cirrhotic tissues. These organoids can be maintained long-term and analyzed at molecular, cellular, and computational levels. Their high initiation efficiency, which preserves disease-specific phenotypes and reproducible growth kinetics, establishes these organoids as an indispensable bridge between clinical samples and mechanistic research. This paves the way for precision diagnostics and personalized therapeutics in liver disease.
The reference list from the paper itself. Each links out to its DOI / PubMed record.
- 1Duncan A.W. Dorrell C. Grompe M. Stem cells and liver regeneration Gastroenterology 200913746648110.1053/j.gastro.2009.05.04419470389 PMC 3136245 · doi ↗ · pubmed ↗
- 2Trefts E. Gannon M. Wasserman D.H. The liver Curr. Biol.201727 R 1147 R 115110.1016/j.cub.2017.09.01929112863 PMC 5897118 · doi ↗ · pubmed ↗
- 3Rinella M. Charlton M. The globalization of nonalcoholic fatty liver disease: Prevalence and impact on world health Hepatology 201664192210.1002/hep.2852426926530 · doi ↗ · pubmed ↗
- 4Cholongitas E. Pavlopoulou I. Papatheodoridi M. Markakis G.E. Bouras E. Haidich A.B. Papatheodoridis G. Epidemiology of nonalcoholic fatty liver disease in Europe: A systematic review and meta-analysis Ann. Gastroenterol.20213440441410.20524/aog.2021.060433948067 PMC 8079871 · doi ↗ · pubmed ↗
- 5Lee H.H. Lee H.A. Kim E.J. Kim H.Y. Kim H.C. Ahn S.H. Lee H. Kim S.U. Metabolic dysfunction-associated steatotic liver disease and risk of cardiovascular disease Gut 20247353354010.1136/gutjnl-2023-33100337907259 · doi ↗ · pubmed ↗
- 6Cho E.E.L. Ang C.Z. Quek J. Fu C.E. Lim L.K.E. Heng Z.E.Q. Tan D.J.H. Lim W.H. Yong J.N. Zeng R. Global prevalence of non-alcoholic fatty liver disease in type 2 diabetes mellitus: An updated systematic review and meta-analysis Gut 2023722138214810.1136/gutjnl-2023-33011037491159 · doi ↗ · pubmed ↗
- 7Anstee Q.M. Targher G. Day C.P. Progression of NAFLD to diabetes mellitus, cardiovascular disease or cirrhosis Nat. Rev. Gastroenterol. Hepatol.20131033034410.1038/nrgastro.2013.4123507799 · doi ↗ · pubmed ↗
- 8Fujii H. Ikura Y. Arimoto J. Sugioka K. Iezzoni J.C. Park S.H. Naruko T. Itabe H. Kawada N. Caldwell S.H. Expression of perilipin and adipophilin in nonalcoholic fatty liver disease; relevance to oxidative injury and hepatocyte ballooning J. Atheroscler. Thromb.20091689390110.5551/jat.205520032580 · doi ↗ · pubmed ↗