Optimal group sizes for testing group mean differences using the Bayes factor
Mirjam Moerbeek

TL;DR
This paper explores how to best choose group sizes for comparing group averages using Bayesian methods, showing that optimal sizes depend on costs, variances, and group means.
Contribution
The paper introduces optimal group sizes for Bayes factor hypothesis testing, considering variances, costs, and group means.
Findings
Optimal group sizes depend on variances, costs, and group means in Bayesian hypothesis testing.
Using conventional optimal design or equal group sizes can reduce the Bayes factor significantly.
A Shiny app is provided to apply the optimal design methodology in practice.
Abstract
Determination of group sizes is an important issue when planning a study that aims to compare mean outcomes across groups. Using equal group sizes is not the best choice in the case of heterogeneous costs and/or variances. Conventional optimal design methodology has shown that groups with higher variance and lower costs should include more subjects. However, these results are based on the framework of null hypothesis significance testing, which has received severe criticism over the past decades. The Bayesian approach to hypothesis testing has been proposed as an alternative and uses the Bayes factor to quantify the support of a hypothesis given the data. Group sizes that maximize the Bayes factor are determined, and it is shown how these optimal group sizes depend on the variances, costs and group means. Furthermore, it is shown to what degree the Bayes factor becomes smaller while…
Genes, proteins, chemicals, diseases, species, mutations and cell lines named across the full text — each resolved to its canonical identifier and authoritative record.
Click any figure to enlarge with its caption.
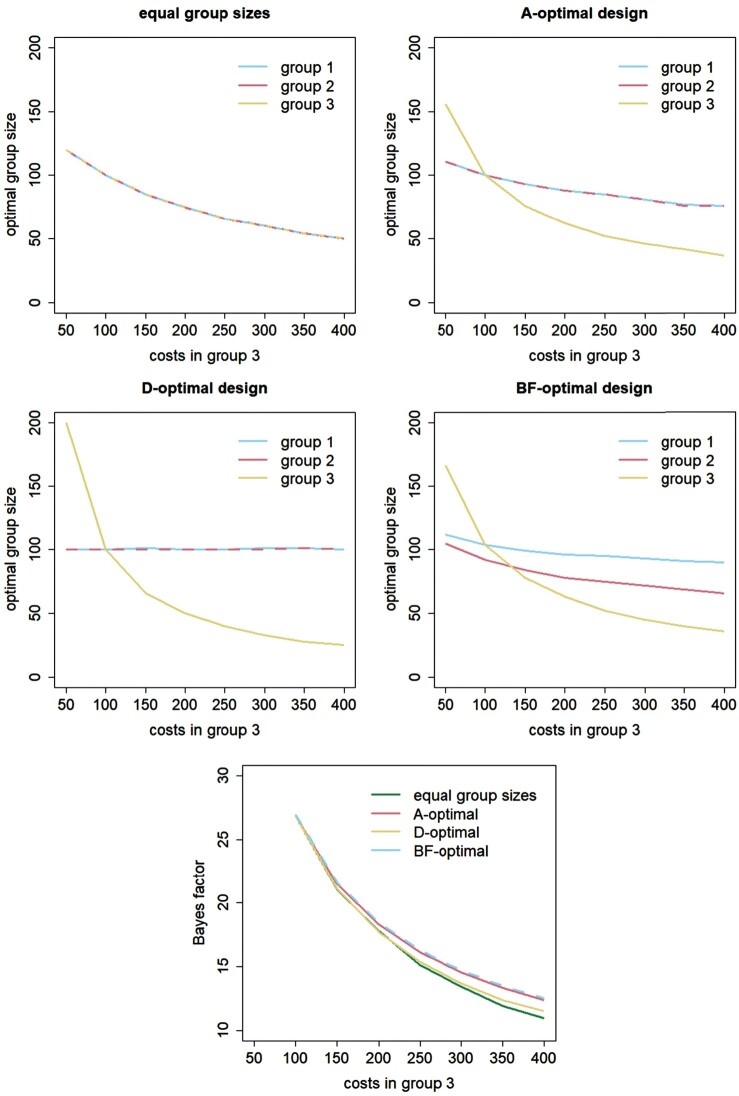 Figure 1
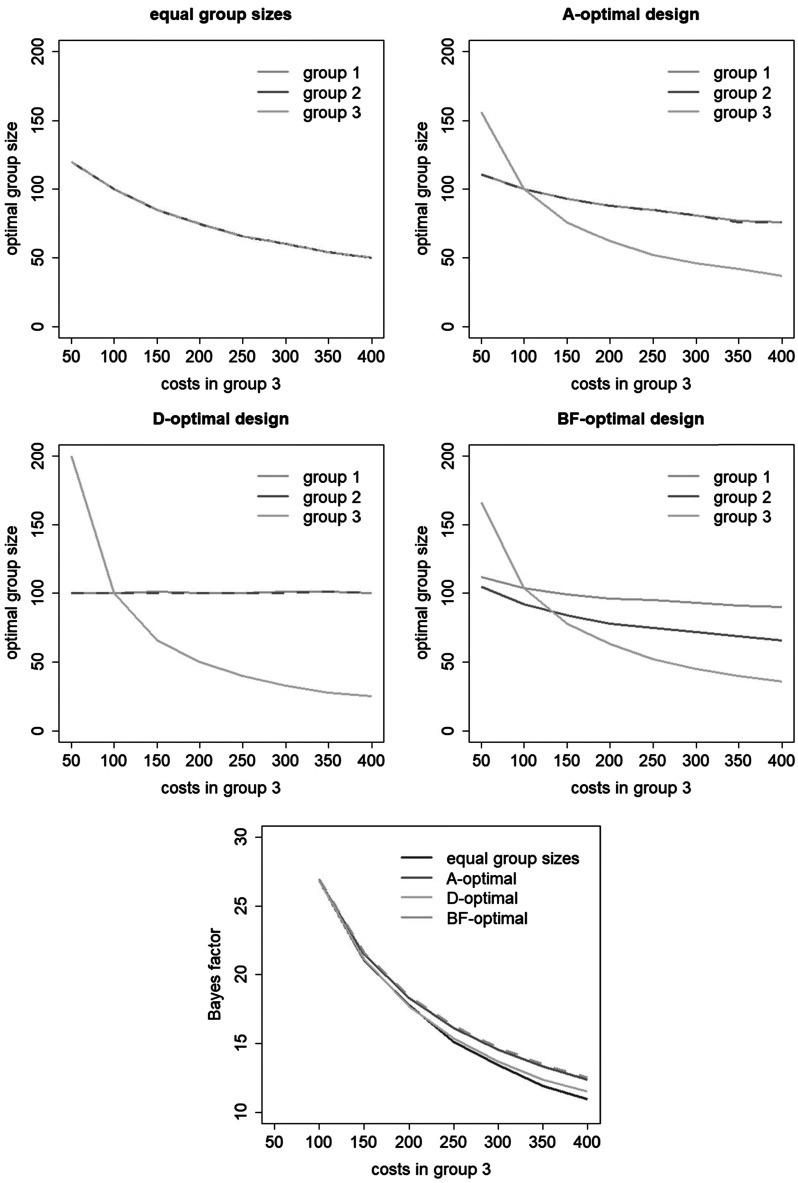 Figure 2
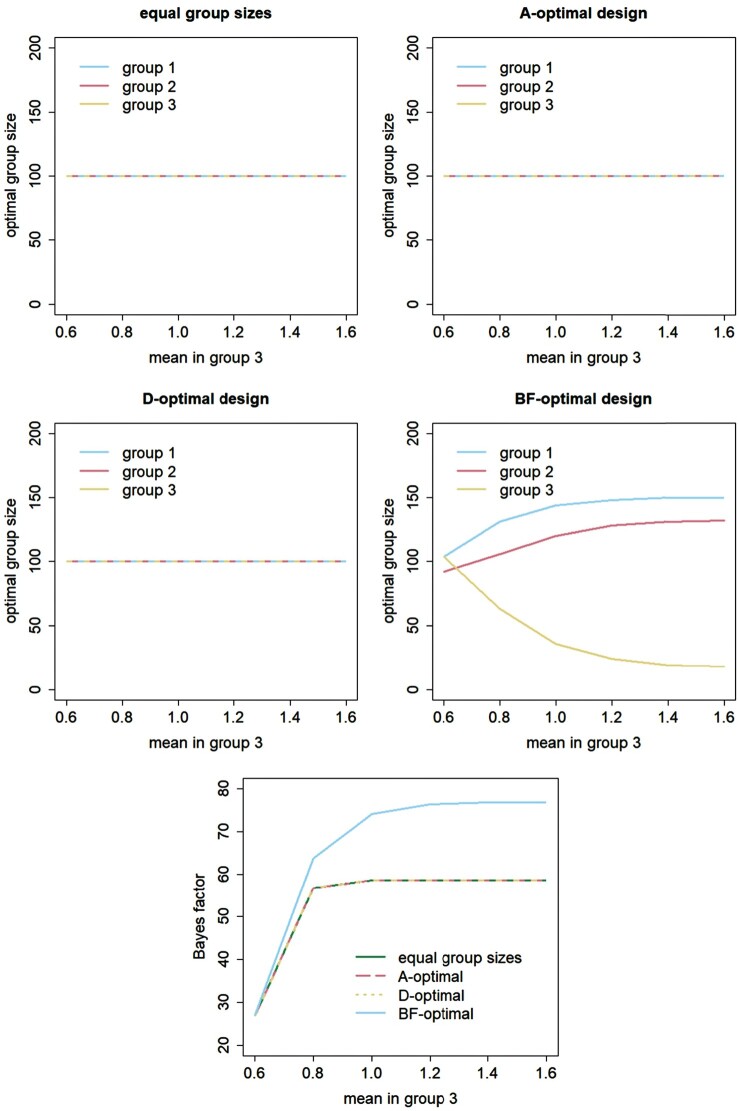 Figure 3
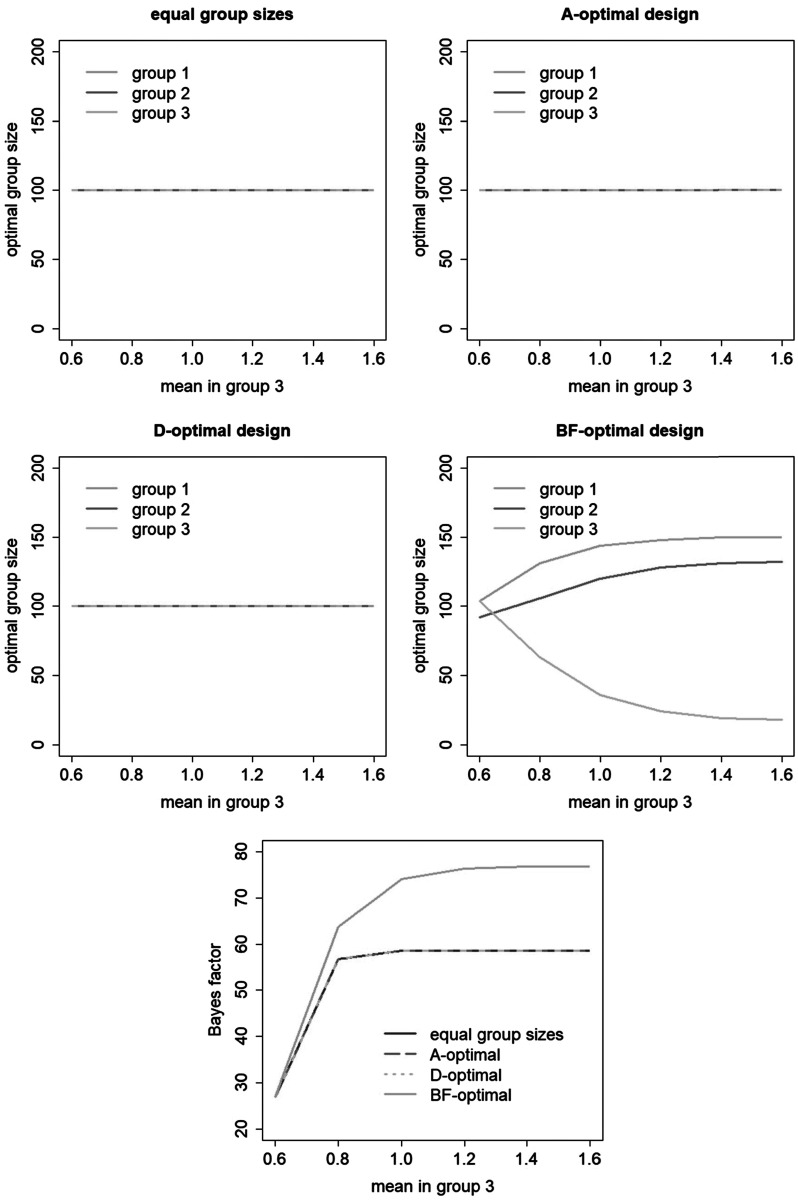 Figure 4
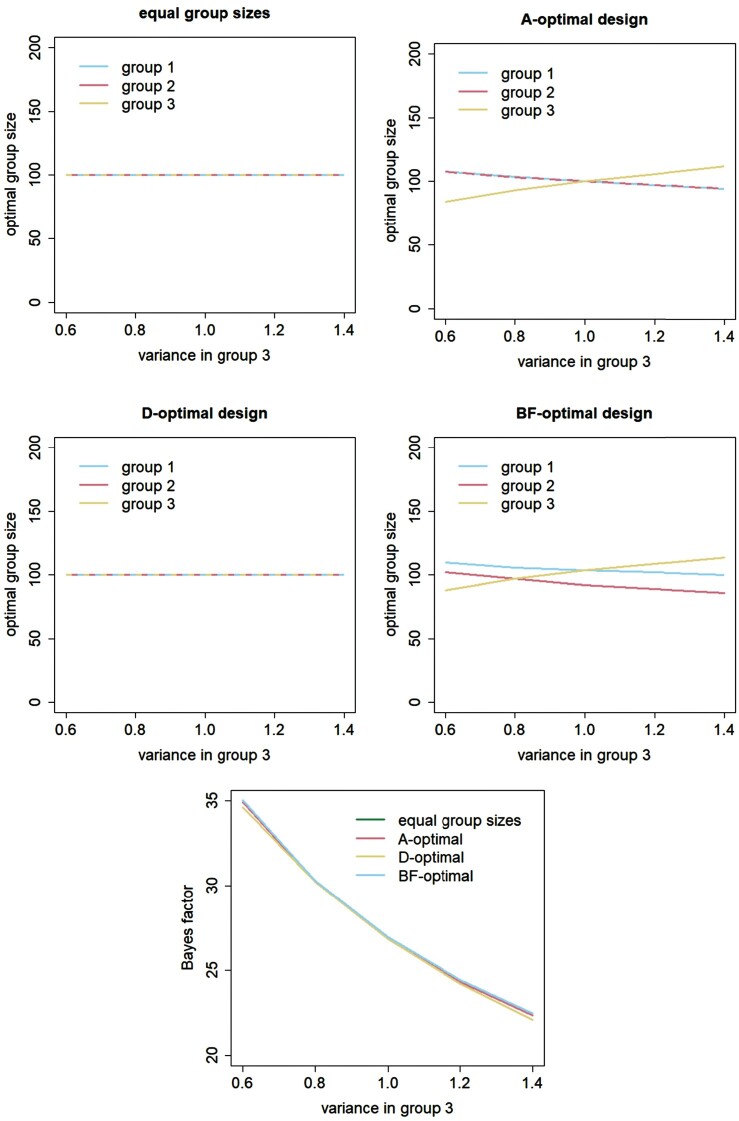 Figure 5
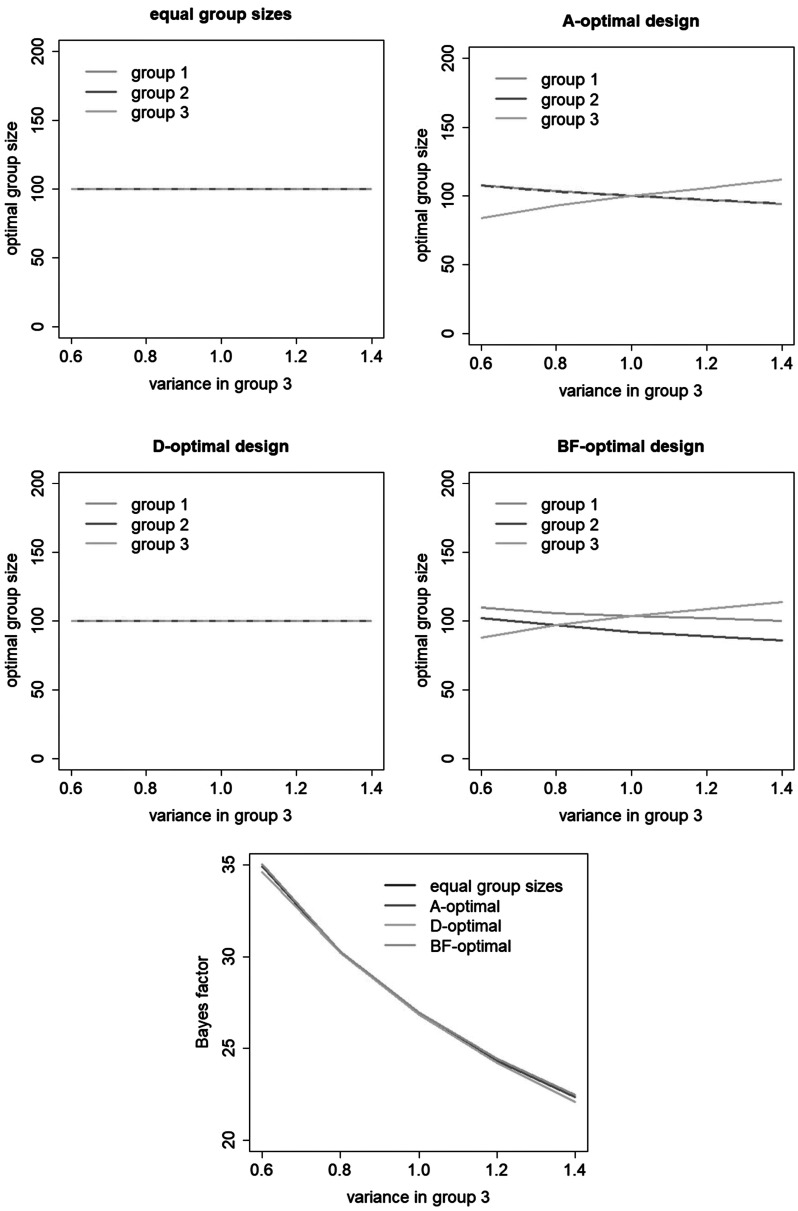 Figure 6
 Figure 7
 Figure 8
 Figure 9
 Figure 10
 Figure 11
 Figure 12
 Figure 13
 Figure 14
 Figure 15
 Figure 16
 Figure 17
 Figure 18
 Figure 19
 Figure 20
 Figure 21
 Figure 22
 Figure 23
 Figure 24
 Figure 25
 Figure 26
 Figure 27
 Figure 28
 Figure 29
 Figure 30
 Figure 31
 Figure 32
 Figure 33
 Figure 34
 Figure 35
 Figure 36
 Figure 37
 Figure 38
 Figure 39
 Figure 40
 Figure 41
 Figure 42
 Figure 43
 Figure 44
 Figure 45
 Figure 46
 Figure 47
 Figure 48
 Figure 49
 Figure 50
Peer Reviews
No public reviews on file for this paper yet. If you reviewed it on a platform where reviews are public (OpenReview, ICLR, NeurIPS, ICML), you can paste yours below so the community can read it here.
Videos
No videos yet. Explain this paper in a talk, walkthrough, or lecture? Add one.
Taxonomy
TopicsStatistical Methods in Clinical Trials · Advanced Statistical Methods and Models · Optimal Experimental Design Methods