Association between Changes in Stent Graft Volume and Type II Endoleaks after Endovascular Aneurysm Repair
Satoshi Yamamoto, Takuya Hashimoto, Takashi Endo, Masaya Sano, Osamu Sato, Juno Deguchi

TL;DR
This study found that changes in stent graft volume after aortic repair are linked to type II endoleaks, which can cause complications.
Contribution
The study identifies stent graft volume changes as a novel predictor of type II endoleaks after EVAR.
Findings
T2ELs were detected in 49% of patients two years after EVAR.
SgV ratio ≤1.23 was independently associated with T2EL in multivariate analysis.
The association between SgV ratio and T2EL was consistent across stent graft materials.
Abstract
Type II endoleaks (T2ELs) after endovascular aneurysm repair (EVAR) are associated with delayed adverse events. This study evaluated the association between changes in stent graft volume (SgV) and T2EL after EVAR. This study included 127 patients who underwent EVAR for abdominal aortic aneurysms between 2010 and 2022. SgVs were calculated using computed tomography, and SgV ratios were calculated by dividing SgV 2 years after EVAR by SgV immediately after EVAR. The association between the SgV ratio and T2EL 2 years after EVAR was evaluated. T2ELs were detected in 62 patients (49%) 2 years after EVAR. Univariate analysis revealed that age, number of patent lumbar arteries, expanded polytetrafluoroethylene (ePTFE) stent grafts, and the SgV ratio were significantly correlated with T2EL. Multivariate analysis showed that age ≥80 years, patent lumbar arteries ≥4, ePTFE stent graft, and SgV…
Genes, proteins, chemicals, diseases, species, mutations and cell lines named across the full text — each resolved to its canonical identifier and authoritative record.
Click any figure to enlarge with its caption.
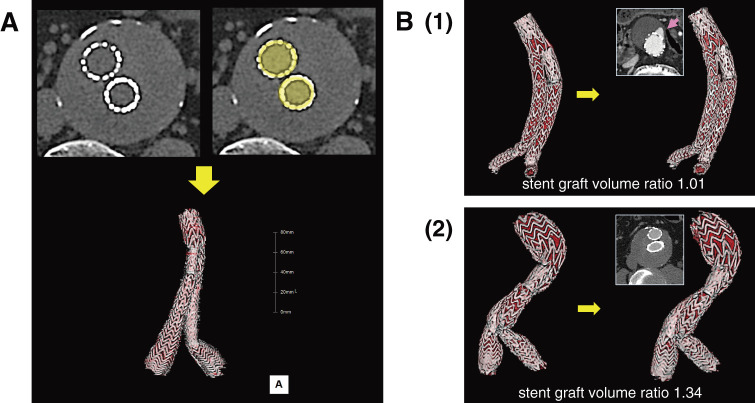 Fig. 1
| Variables | Total | Type II endoleak 2 years after EVAR | ||
|---|---|---|---|---|
| (+) | (−) | |||
| Preoperative factors | ||||
| Age, years | 76.6 ± 6.9 | 78.4 ± 7.0 | 75.0 ± 6.5 | 0.0058 |
| Male | 113 (89%) | 54 (87%) | 59 (91%) | 0.58 |
| Comorbid diseases | ||||
| Hypertension | 104 (82%) | 52 (84%) | 52 (80%) | 0.65 |
| Dyslipidemia | 72 (57%) | 33 (53%) | 39 (60%) | 0.48 |
| Diabetes mellitus | 32 (25%) | 15 (24%) | 17 (26%) | 0.84 |
| Coronary artery disease | 55 (43%) | 25 (40%) | 30 (46%) | 0.59 |
| Chronic heart failure | 7 (6%) | 5 (8%) | 2 (3%) | 0.27 |
| Cerebrovascular disease | 21 (17%) | 9 (15%) | 12 (18%) | 0.64 |
| Chronic renal failure, Grade 4 and 5 | 14 (11%) | 4 (6%) | 10 (15%) | 0.16 |
| Grade 1, 2 | 54 | 26 | 28 | |
| Grade 3a | 40 | 21 | 19 | |
| Grade 3b | 19 | 11 | 8 | |
| Grade 4 | 9 | 2 | 7 | |
| Grade 5 | 5 | 2 | 3 | |
| Respiratory disorder | 32 (25%) | 16 (26%) | 16 (25%) | 0.84 |
| Medications | ||||
| Antiplatelet and/or anticoagulant drug | 71 (56%) | 35 (56%) | 36 (55%) | 1.0 |
| Antiplatelet drug use | 61 (48%) | 30 (48%) | 31 (48%) | 1.0 |
| Anticoagulant drug use | 16 (13%) | 7 (11%) | 9 (14%) | 0.79 |
| Statin use | 61 (48%) | 31 (50%) | 30 (46%) | 0.72 |
| β blocker use | 25 (20%) | 15 (24%) | 10 (15%) | 0.27 |
| Anatomic features | ||||
| Saccular | 21 (17%) | 11 (18%) | 10 (15%) | 0.81 |
| Comorbid common iliac artery aneurysm | 53 (42%) | 30 (48%) | 23 (35%) | 0.15 |
| Comorbid thoracic aortic aneurysm | 30 (24%) | 10 (16%) | 20 (31%) | 0.062 |
| Sac diameter at EVAR, mm | 54.3 ± 9.4 | 53.0 ± 6.8 | 55.6 ± 11.3 | 0.11 |
| Proximal neck diameter, mm | 24.4 ± 3.6 | 24.0 ± 3.3 | 24.7 ± 3.9 | 0.29 |
| Proximal neck length, mm | 32.3 ± 11.3 | 33.2 ± 1.0 | 31.5 ± 12.4 | 0.40 |
| Patent inferior mesenteric artery | 102 (80%) | 50 (81%) | 52 (80%) | 1.0 |
| Inferior mesenteric artery diameter, mm | 3.1 ± 0.8 | 3.2 ± 0.7 | 3.0 ± 0.8 | 0.16 |
| Number of patent lumbar arteries | 3.8 ± 1.6 | 4.4 ± 1.4 | 3.2 ± 1.6 | <0.0001 |
| Stent graft | ||||
| Stent grafts made of expanded polytetrafluoroethylene | 80 (63%) | 54 (87%) | 26 (40%) | <0.0001 |
| Excluder | 80 | 54 | 26 | |
| Stent grafts made of polyester | 47 (37%) | 8 (13%) | 39 (60%) | |
| Endurant | 29 | 4 | 25 | |
| Zenith | 16 | 3 | 13 | |
| Aorfix | 2 | 1 | 1 | |
| Postoperative details | ||||
| Stent graft volume | ||||
| Stent graft volume within 1 month after EVAR, ml | 64.5 ± 16.4 | 62.9 ± 14.9 | 66.0 ± 17.7 | 0.28 |
| Stent graft volume 2 years after EVAR, ml | 76.7 ± 21.5 | 71.4 ± 17.9 | 81.7 ± 23.5 | 0.0061 |
| Stent graft volume ratio 2 years after EVAR | 1.19 ± 0.12 | 1.14 ± 0.08 | 1.23 ± 0.13 | <0.0001 |
| Stent graft volume ratio 2 years after EVAR ≤1.23 | – | 56 (90%) | 31 (48%) | <0.0001 |
| Stent graft length | ||||
| Stent graft length within 1 month after EVAR, mm | 294 ± 56 | 299 ± 50 | 289 ± 62 | 0.35 |
| Stent graft length 2 years after EVAR, mm | 296 ± 58 | 302 ± 52 | 291 ± 63 | 0.28 |
| Stent graft length ratio 2 years after EVAR | 1.007 ± 0.022 | 1.010 ± 0.020 | 1.005 ± 0.023 | 0.17 |
| Sac diameter | ||||
| Sac diameter 2 years after EVAR, mm | 50.3 ± 11.7 | 53.0 ± 9.4 | 47.8 ± 13.0 | 0.011 |
| ALL cases (n = 127) | ||
|---|---|---|
| Variable | OR (95% CI) | |
| Age ≥80 years | 2.89 (0.90–6.79) | 0.072 |
| Number of patent lumbar arteries ≥4 | 4.24 (1.65–10.91) | 0.0020 |
| Stent grafts made of expanded polytetrafluoroethylene | 5.55 (1.96–15.68) | 0.0008 |
| Stent graft volume ratio ≤1.23 | 7.16 (2.22–23.11) | 0.0005 |
| Variable | Expanded polytetrafluoroethylene stent grafts | Polyester stent grafts | ||||
|---|---|---|---|---|---|---|
| Type II endoleak 2 years after EVAR | Type II endoleak 2 years after EVAR | |||||
| (+) | (−) | (+) | (−) | |||
| Preoperative factors | ||||||
| Age | 78.6 ± 7.0 | 74.4 ± 5.8 | 0.0072 | 77.0 ± 7.0 | 75.4 ± 7.0 | 0.57 |
| Male | 48 (89%) | 26 (100%) | 0.17 | 6 (75%) | 33 (85%) | 0.61 |
| Comorbid diseases | ||||||
| Hypertension | 46 (85%) | 22 (85%) | 1.0 | 6 (75%) | 30 (77%) | 1.0 |
| Dyslipidemia | 29 (54%) | 14 (54%) | 1.0 | 4 (50%) | 25 (64%) | 0.69 |
| Diabetes mellitus, | 15 (28%) | 4 (15%) | 0.27 | 0 (0%) | 13 (33%) | 0.086 |
| Coronary artery disease | 24 (44%) | 9 (35%) | 0.47 | 1 (13%) | 21 (54%) | 0.052 |
| Chronic heart failure | 5 (9%) | 1 (4%) | 0.66 | 0 (0%) | 1 (3%) | 1.0 |
| Cerebrovascular disease | 6 (11%) | 4 (15%) | 0.72 | 3 (38%) | 8 (21%) | 0.37 |
| Chronic renal failure, Grade 4 and 5 | 3 (6%) | 2 (8%) | 1.0 | 1 (13%) | 8 (21%) | 1.0 |
| Respiratory disorder | 15 (28%) | 7 (27%) | 1.0 | 1 (13%) | 9 (23%) | 0.67 |
| Medications | ||||||
| Antiplatelet and/or anticoagulant | 32 (59%) | 12 (46%) | 0.34 | 3 (38%) | 24 (62%) | 0.26 |
| Antiplatelet drug use | 28 (52%) | 9 (35%) | 0.16 | 2 (25%) | 22 (56%) | 0.14 |
| Anticoagulant drug use | 6 (11%) | 2 (8%) | 1.0 | 1 (13%) | 7 (18%) | 1.0 |
| Statin use | 27 (50%) | 10 (38%) | 0.35 | 4 (50%) | 20 (51%) | 1.0 |
| β blocker use | 14 (26%) | 5 (19%) | 0.59 | 1 (13%) | 5 (13%) | 1.0 |
| Anatomic features | ||||||
| Sacclurar | 9 (17%) | 3 (12%) | 0.74 | 2 (25%) | 7 (18%) | 0.64 |
| Comorbid common iliac artery aneurysm | 28 (52%) | 9 (35%) | 0.16 | 2 (25%) | 14 (36%) | 0.70 |
| Comorbid thoracic aortic aneurysm | 9 (17%) | 7 (27%) | 0.37 | 1 (13%) | 13 (33%) | 0.40 |
| Sac diameter at EVAR, mm | 53.0 ± 6.6 | 53.8 ± 13.7 | 0.77 | 52.7 ± 8.9 | 56.8 ± 9.3 | 0.26 |
| Proximal neck diameter, mm | 24.2 ± 3.4 | 24.2 ± 4.2 | 0.94 | 22.8 ± 2.6 | 25.1 ± 3.6 | 0.051 |
| Proximal neck length, mm | 33.2 ± 9.7 | 29.3 ± 8.9 | 0.088 | 33.4 ± 12.4 | 33.0 ± 14.1 | 0.94 |
| Patent inferior mesenteric artery | 43 (80%) | 22 (85%) | 0.76 | 7 (88%) | 30 (77%) | 0.67 |
| Inferior mesenteric artery diameter, mm | 3.1 ± 0.7 | 3.1 ± 0.7 | 0.87 | 3.8 ± 1.0 | 2.9 ± 0.8 | 0.044 |
| Number of patent lumbar arteries | 4.3 ± 1.4 | 3.3 ± 1.8 | 0.013 | 5.1 ± 1.2 | 3.2 ± 1.6 | 0.0028 |
| Postoperative details | ||||||
| Stent graft volume | ||||||
| Stent graft volume within 1 month after EVAR, mL | 63.7 ± 14.8 | 62.6 ± 16.2 | 0.79 | 57.7 ± 15.7 | 68.3 ± 18.4 | 0.12 |
| Stent graft volume 2 years after EVAR, ml | 71.9 ± 18.2 | 73.9 ± 23.3 | 0.70 | 67.6 ± 17.0 | 86.9 ± 22.4 | 0.017 |
| Stent graft volume ratio 2 years after EVAR | 1.13 ± 0.08 | 1.18 ± 0.11 | 0.043 | 1.18 ± 0.10 | 1.28 ± 0.12 | 0.032 |
| Stent graft volume ratio 2 years after EVAR ≤1.21 | 46 (85%) | 16 (62%) | 0.024 | – | ||
| Stent graft volume ratio 2 years after EVAR ≤1.22 | – | 6 (75%) | 11 (28%) | 0.019 | ||
| Expanded polytetrafluoroethylene stent grafts (n = 80) | ||
|---|---|---|
| Variable | OR (95% CI) | |
| Age ≥80 years | 3.90 (1.07–14.16) | 0.039 |
| Number of patent lumbar arteries ≥4 | 2.17 (0.73–6.47) | 0.16 |
| Stent graft volume ratio ≤1.21 | 3.73 (1.12–12.41) | 0.032 |
| Polyester stent grafts (n = 47) | ||
| Variable | OR (95% CI) | |
| Inferior mesenteric artery diameter ≥3.1 mm | 15.98 (0.99–256.29) | 0.051 |
| Number of patent lumbar arteries ≥4 | 20.95 (1.20–366.92) | 0.037 |
| Stent graft volume ratio ≤1.22 | 19.31 (1.55–241.18) | 0.022 |
Peer Reviews
No public reviews on file for this paper yet. If you reviewed it on a platform where reviews are public (OpenReview, ICLR, NeurIPS, ICML), you can paste yours below so the community can read it here.
Videos
No videos yet. Explain this paper in a talk, walkthrough, or lecture? Add one.
Taxonomy
TopicsAortic aneurysm repair treatments · Aortic Disease and Treatment Approaches · Peripheral Artery Disease Management
Introduction
Endovascular aneurysm repair (EVAR) has been established as the treatment for abdominal aortic aneurysms (AAA) owing to its low mortality and complication rates. However, endoleaks can lead to EVAR failure. Type II endoleaks (T2ELs) after EVAR are the most prevalent type of endoleak.^1)^ The data of 17099 patients from the registry of the Japanese Committee for Stentgraft Management showed a correlation between persistent T2EL and delayed adverse events, including mortality after EVAR due to aneurysm sac enlargement, reintervention, rupture, and abdominal aortic aneurysm.^2)^ Persistent T2EL is a serious issue in radical treatment for AAA.^1,3,4)^ However, it is difficult to continue monitoring endoleaks using contrast radiography over the entire period after EVAR. T2EL often resolves spontaneously, although it is sometimes newly detected during follow-up.^2,5,6)^ Doppler ultrasound has poor sensitivity for endoleak detection, and contrast-enhanced computed tomography (CECT) is considered the standard for endoleak surveillance.^7)^ However, repeated CECT could lead to contrast-media-induced renal dysfunction and allergy compared with non-contrast CT. Trans-arterial angiography is invasive and is not routinely performed. Clinically, plain CT is often used only to check the aneurysm sac size. Therefore, an alternative indicator of T2EL is required.
We have observed that the degree of change in stent graft volume (SgV) differs among patients, although all stent grafts increase in volume over time compared to immediately after EVAR. Specifically, stent grafts show attenuated expansion when aneurysm sacs enlarge drastically because of endoleaks. We hypothesized that the degree of SgV change is associated with T2EL and may indicate EVAR success. Therefore, in this study, we investigated the association between changes in SgV and T2EL after EVAR.
Materials and Methods
Data collection
Between 2010 and 2022, 127 patients at Saitama and Ome Medical Centers who underwent EVAR for AAA and CT for the first time within 1 month and 2 years after EVAR were included in this study. Patients treated with the AFX (Endologix, Irvine, CA, USA) stent graft, which had an inner metallic endoskeleton, were excluded. None of the patients had Type I and/or Type III endoleaks at surgery. Values, including SgV, were measured on the initial and 2-year plain CT images. SgV was approximated by tracing the stent border from the top to the bottom of the stent graft in the axial images using Ziostation 2 (Ziosoft, Tokyo, Japan) (Fig. 1). SgVs were measured twice by physicians. In the Endurant (Medtronic, Minneapolis, MN, USA) and Zenith (Cook Medical, Bloomington, IN, USA) stent grafts, the non-fabric-covered top stents were not measured. In the Aorfix (Lombard Medical, Oxfordshire, UK) stent graft, the measurement boundary was defined as the midpoint of the fish-mouth-shaped portion’s ends. A 3-dimensional image was reconstructed in parallel using these procedures. The SgV ratio was calculated by dividing SgV at 2 years after EVAR by SgV immediately after EVAR. The overall length of the stent graft (SgL) was measured as the sum of the lengths of the main trunk portion, right leg, and left leg. The SgL ratio was calculated by dividing SgL at 2 years after EVAR by SgL immediately after EVAR. T2EL was assessed in CECT images or angiography, referring to clinical information, including Doppler ultrasound data. In this study, any contrast enhancement in the aneurysm sac or around the inferior mesenteric and lumbar arteries was considered T2EL. Cases with Type I, III, or IV endoleaks 2 years after EVAR were excluded.
Stent graft volume measurement. (A) Axial plain CT images before and after tracing the stent border lines, and a 3-dimensional image reconstructed from plain CT images. Stent graft volume is calculated as the integrated value by tracing the outer stent border from top to bottom in the axial images of plain CT. The inner area of the stent is displayed in red if a 3-dimensional image is reconstructed from plain CT images, and the red area in the 3-dimensional image is not contrasted. (B) Images of 2 cases as examples: (1) the stent graft with Type II endoleaks (T2EL) (arrow) and (2) the stent graft without T2EL. The 3-dimensional image of the stent graft within 1 month after EVAR (left) and the axial CT and 3-dimensional images of the stent grafts 2 years after EVAR (right) are shown for each case. The axial contrast-enhanced CT images clarify the existence or absence of T2EL, but stent graft volume is measured on plain CT images. The SgVs were 54.5 mL initially and 55.0 mL 2 years after EVAR, and the SgV ratio was calculated as 1.01 in Case 1. The SgVs were 83.8 mL initially and 111.9 mL 2 years after EVAR, and the SgV ratio was calculated as 1.34 in Case 2. EVAR: endovascular aneurysm repair; ePTFE: expanded polytetrafluoroethylene; CT: computed tomography; SgVs: stent graft volumes
Endpoints
Patients with T2EL 2 years after EVAR were considered the discriminant groups. Retrospectively, clinical findings and calculated data, including the SgV ratio, were compared between patients with T2EL and those without it, 2 years after EVAR.
Statistical analysis
Data are presented as means and standard deviations (SDs). Student’s t-test or chi-square/Fisher’s exact test was used for statistical analysis. The Youden index and the receiver operating characteristic curve were used to calculate the cut-off values of the SgV ratio, number of patent lumbar arteries, and diameter of the inferior mesenteric artery. The threshold for statistical significance was set at p <0.05. Multivariate analyses were performed to identify the risk factors for T2EL 2 years after EVAR. Only factors that achieved a level of p <0.05 after univariate testing were entered in the logistic regression analysis. Similarly, outcomes were evaluated, and values, including the SgV ratio, were compared in the expanded polytetrafluoroethylene (ePTFE) stent grafts and in the polyester stent grafts, respectively.
This study followed the ethical guidelines for medical research involving human subjects and was approved by the Institutional Review Board of Saitama Medical Center (approval no. 2024-142).
Results
Patient characteristics and outcomes
Patient characteristics and outcomes are presented in Table 1. In the whole cohort, SgV was 64.5 ± 16.4 mL at the first time point and 76.7 ± 21.5 mL at 2 years after EVAR, yielding an SgV ratio of 1.19 ± 0.12. Endoleaks were detected in 62 (49%) patients 2 years after EVAR, and all endoleaks were categorized as Type II. They resolved spontaneously in 8 patients and occurred de novo in 10 patients during the 2-year follow-up. Among the 62 T2ELs, 15 were from the inferior mesenteric and lumbar arteries, 6 from the inferior mesenteric artery, and 41 from the lumbar arteries.
Comparison of patients with T2EL and those without, 2 years after EVAR
All cases
A comparison of patients with T2EL and those without 2 years after EVAR is presented in Table 1. SgV was smaller in patients with T2EL than in those without, 2 years after EVAR (p = 0.0061), although there was no significant difference in SgV between the 2 groups at EVAR (p = 0.28). The SgV ratio was smaller in patients with T2EL than in those without, 2 years after EVAR (p <0.0001). There was no significant difference in sac diameter between the 2 groups at the time of EVAR (p = 0.11). However, sac diameter was larger in patients with T2EL than in those without, 2 years after EVAR (p = 0.011). The correlation coefficient between sac diameter change and the SgV ratio was −0.28, suggesting a weak negative correlation. The correlation coefficient between SgL and the SgV ratio was 0.067. Univariate analysis revealed that age, number of patent lumbar arteries, ePTFE stent grafts, and SgV ratio were significantly correlated with T2EL. An SgV ratio value of 1.23 was calculated as the cut-off (positive predictive value; 64%, negative predictive value; 85%, sensitivity; 52%, specificity; 90%, and area under the curve [AUC]; 0.74). Regarding the number of patent lumbar arteries, a value of 4 was calculated as the cut-off (sensitivity 58%, specificity 79%, AUC 0.70). Multivariate analysis revealed that factors independently associated with T2EL in all cases were the number of patent lumbar arteries ≥4, ePTFE stent grafts, and SgV ratio ≤1.23 (Table 2).
ePTFE stent graft subgroup
Univariate analysis revealed that age, number of patent lumbar arteries, and the SgV ratio were significantly correlated with T2EL (Table 3). An SgV ratio value of 1.21 was calculated as the cut-off (positive predictive value 74%, negative predictive value 56%, and sensitivity 38%, specificity 85%, AUC 0.59). Concerning the number of patent lumbar arteries, the cut-off was calculated as 4 (sensitivity 54%, specificity 78%, AUC 0.67). Multivariate analysis revealed that age ≥80 years and SgV ratio ≤1.21 were independently associated with T2EL (Table 4).
Polyester stent graft subgroup
Univariate analysis revealed that the diameter of the inferior mesenteric artery, the number of patent lumbar arteries, and the SgV ratio were significantly correlated with T2EL (Table 3). An SgV ratio value of 1.22 was calculated as the cut-off (positive predictive value 35%, negative predictive value 93%, and sensitivity 72%, specificity 75%, AUC 0.74). Regarding the number of patent lumbar arteries, the cut-off was calculated as 4 [sensitivity 79%, specificity 75%, AUC 0.82]. Regarding the diameter of the inferior mesenteric artery, 3.1 mm was calculated as the cut-off [sensitivity 67%, specificity 88%, AUC 0.76]. Multivariate analysis revealed that patent lumbar arteries ≥4 and SgV ratio ≤1.22 were independently associated with T2EL (Table 4).
Discussion
We demonstrated that the SgV ratio is significantly associated with T2EL and is an independent factor for T2EL. This result suggests that the SgV ratio is a promising indicator of T2EL after EVAR, with a small SgV ratio implying the existence of T2EL. There have been several studies on the usefulness of aneurysm sac volumetry after EVAR,^8,9)^ but stent graft volumetry has not been studied to date. To evaluate stent graft enlargement objectively, we adopted SgV instead of stent graft diameter. The integrated value by tracing the stent graft fabric border is the true value of SgV. However, an integrated value by tracing the stent border can be considered an approximation of the true value of SgV in the stent graft that had an outer metallic skeleton. As SgV varied widely among patients, we calculated the change in SgV relative to the initial assessment after EVAR. SgL had small changes, and the correlation between SgL and the SgV ratio was low. Compared with CT findings on axial imaging, the diameter of stents increased over time. Therefore, the stent graft volume may increase because of the dilatation of the stent graft in diameter, rather than the elongation of the stent graft in length. The SgV increased 2 years postEVAR, but only compared with immediately after EVAR, and did not exceed its original size. The stent graft may not have fully expanded within 1 month postEVAR and attained its intended size over time. However, intra-aneurysmal sac pressure may suppress full expansion to the original maximum size; therefore, volume increases can differ. There are marked differences in graft behavior after EVAR between ePTFE and polyester grafts. ePTFE grafts generally show less dilatation than polyester grafts after implantation^10)^ and tend to have T2EL more frequently than polyester stent grafts.^11)^ However, even after stratification by the graft material, the SgV ratio was an independent factor in ePTFE and polyester stent grafts. Regardless of the stent graft material, a low SgV ratio may infer the existence of T2EL after EVAR. We are considering an investigation of SgV on each stent graft model eventually.
The frequency of T2EL in this study was 49%, slightly higher than the range of 20–40%.^1)^ The higher frequency of T2EL in this study may be attributed to the following: (1) the proportion of ePTFE stent grafts was high; (2) embolization of the inferior mesenteric artery or lumbar artery concomitant with EVAR was not performed routinely; and (3) some patients without T2EL who showed obvious sac shrinkage were not included because they did not undergo CT 2 years after EVAR. It is necessary to regularly check for the presence of T2EL because T2EL may disappear or emerge during follow-up.^2,5,6)^ However, regular inspections for T2EL using contrast media are problematic because contrast radiography has some disadvantages. Because SgV can be calculated without contrast media, the SgV ratio should be useful for regular estimation of T2EL. Plain CT scans, which are often used only to check the aneurysm sac size, may also be used.
Aneurysm sac pressure has been reported to be useful in detecting intraoperative Type I and III endoleaks,^12)^ and intra-aneurysm sac pressure measurement is crucial for post-EVAR surveillance, allowing early detection of exclusion failures.^13)^ After open surgical repair for AAA, the implanted graft is free from the surrounding pressure because the aneurysm sac has been opened and dilates to its own maximum size of the graft.^14–17)^ However, a stent graft is inserted into the closed space of the aneurysm sac and continues to receive intra-aneurysmal sac pressure postEVAR. The SgV ratio may reflect the intra-aneurysm sac pressure. High intra-aneurysmal sac pressure due to T2EL may suppress stent graft enlargement to its original maximum size, whereas depressurization resulting from the absence of T2EL may allow the stent graft to enlarge to nearly its original maximum size. Dias et al. reported that the mean intra-sac pressure of 6 patients who had T2EL was 19–122 mmHg and the ratio to the aortic pressure was 22%–92%.^13)^ The intra-sac pressure due to T2EL can be high enough to suppress the expansion of the stent graft after EVAR in some cases. Several types of aneurysm sac pressure measurements have been reported, but they require invasive procedures.^18)^ If the SgV ratio proves to be strongly associated with intra-aneurysm sac pressure, it may be useful as a less invasive indicator of intra-aneurysmal sac pressure.
This study had several limitations. First, it was a retrospective study. Moreover, there was selection bias, and time and effort are required to measure SgV manually. The average measurement time of an SgV was approximately 10 min. An optimal cut-off value for the SgV ratio has not been established for ePTFE and polyester stent grafts. This study suggests that the SgV ratio is correlated with T2EL, but the SgV ratio has not been proven to be directly associated with late adverse events, including reintervention, rupture, and mortality. As previously reported, in this study, the aneurysm sac diameter was also larger in patients with T2EL than in those without it, 2 years after EVAR. An association between the SgV ratio and late adverse events also needs to be verified.
However, this study suggests some significant advantages of measuring SgV. SgV based on plain CT can be helpful in T2EL surveillance. The SgV ratio may be a dynamic indicator of intra-aneurysm sac pressure. Measurement accuracy and efficiency are expected to improve with the utilization of software, enabling automated sac volume measurement.^8,9)^ We believe that the SgV ratio may improve T2EL surveillance, and further research is required to clarify the utility of the SgV ratio after EVAR.
Conclusion
This study suggests that the SgV ratio is significantly correlated with T2EL. The SgV ratio may improve T2EL surveillance after EVAR.
The reference list from the paper itself. Each links out to its DOI / PubMed record.
- 1Wanhainen A, Verzini F, Van Herzeele I, et al. Editor’s choice - European Society for Vascular Surgery (ESVS) 2019 clinical practice guidelines on the management of abdominal aorto-iliac artery aneurysms. Eur J Vasc Endovasc Surg 2019; 57: 8–93.30528142 10.1016/j.ejvs.2018.09.020 · doi ↗ · pubmed ↗
- 2Seike Y, Matsuda H, Shimizu H, et al. Nationwide analysis of persistent type II endoleak and late outcomes of endovascular abdominal aortic aneurysm repair in Japan: a propensity-matched analysis. Circulation 2022; 145: 1056–66.35209732 10.1161/CIRCULATIONAHA.121.056581 PMC 8969842 · doi ↗ · pubmed ↗
- 3Chaikof EL, Dalman RL, Eskandari MK, et al. The Society for Vascular Surgery practice guidelines on the care of patients with an abdominal aortic aneurysm. J Vasc Surg 2018; 67: 2–77.e 2.29268916 10.1016/j.jvs.2017.10.044 · doi ↗ · pubmed ↗
- 4Wu WW, Swerdlow NJ, Dansey K, et al. Surgical treatment patterns and clinical outcomes of patients treated for expanding aneurysm sacs with type II endoleaks after endovascular aneurysm repair. J Vasc Surg 2021; 73: 484–93.32615284 10.1016/j.jvs.2020.05.062 · doi ↗ · pubmed ↗
- 5Sidloff DA, Stather PW, Choke E, et al. Type II endoleak after endovascular aneurysm repair. Br J Surg 2013; 100: 1262–70.23939840 10.1002/bjs.9181 · doi ↗ · pubmed ↗
- 6Mulay S, Geraedts ACM, Koelemay MJW, et al. Type 2 endoleak with or without intervention and survival after endovascular aneurysm repair. Eur J Vasc Endovasc Surg 2021; 61: 779–86.33632609 10.1016/j.ejvs.2021.01.017 · doi ↗ · pubmed ↗
- 7Zaiem F, Almasri J, Tello M, et al. A systematic review of surveillance after endovascular aortic repair. J Vasc Surg 2018; 67: 320–31.e 37.28662928 10.1016/j.jvs.2017.04.058 · doi ↗ · pubmed ↗
- 8van Tongeren OLRM, Vanmaele A, Rastogi V, et al. Volume measurements for surveillance after endovascular aneurysm repair using artificial intelligence. Eur J Vasc Endovasc Surg 2025; 69: 61–70.39237055 10.1016/j.ejvs.2024.08.045 · doi ↗ · pubmed ↗