LASSO regression-derived first-trimester (9–14+6 weeks) risk stratification model for gestational diabetes mellitus: development, validation, and open-access web tool in a retrospective Chinese cohort
Xiao Wang, Jin Zhang, Shitong Zhan, Xianming Xu

TL;DR
This study creates a simple and accurate model to predict gestational diabetes in early pregnancy using common clinical data and provides a free online tool for risk assessment.
Contribution
A novel, resource-efficient GDM prediction model using first-trimester clinical indicators and an open-access web tool for risk stratification.
Findings
The LASSO–1SE model achieved an AUC of 0.717 with high sensitivity and positive predictive value.
The model demonstrated robust calibration and clinical utility across risk thresholds.
An open-access web calculator was developed for practical clinical use.
Abstract
Early identification of gestational diabetes mellitus (GDM) is critical for mitigating adverse maternal and neonatal outcomes. Existing prediction models face limitations in clinical utility due to inconsistent variable selection and reliance on impractical biomarkers. This study aimed to develop and validate a resource-efficient GDM prediction model using routinely available first-trimester clinical indicators and deploy it as an open-access web tool. A retrospective cohort of 1818 pregnancies from a Shanghai tertiary hospital (2023) was randomly divided into training (70%) and validation (30%) sets. Three predictor screening strategies (traditional logistic regression, least absolute shrinkage and selection operator (LASSO) regression with 1SE rule, and LASSO–MIN rule) were compared. The model performance was assessed by the area under the receiver operating characteristic (ROC)…
Genes, proteins, chemicals, diseases, species, mutations and cell lines named across the full text — each resolved to its canonical identifier and authoritative record.
Click any figure to enlarge with its caption.
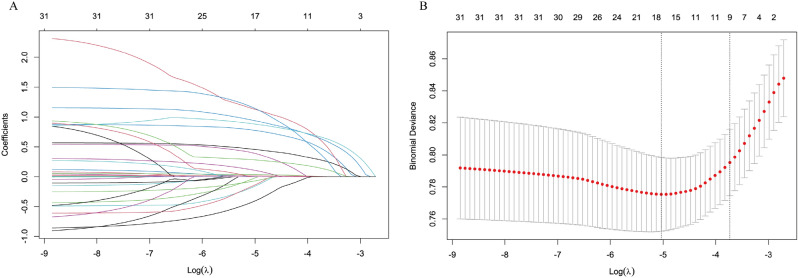 Figure 1
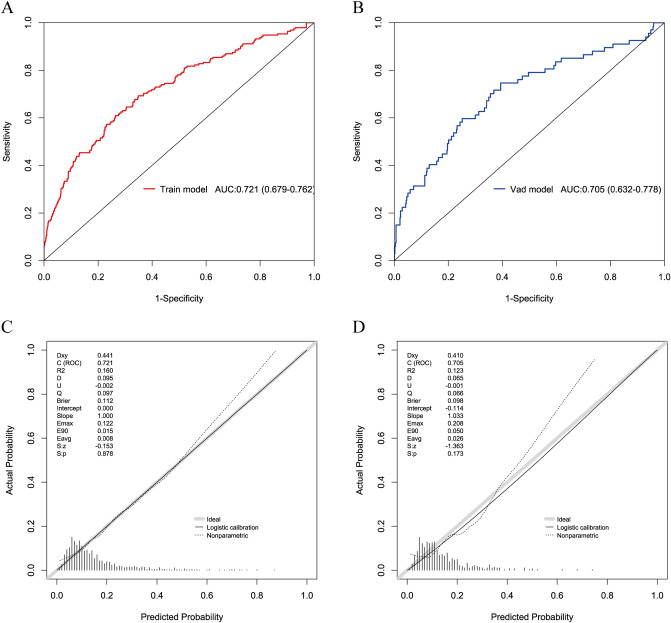 Figure 2
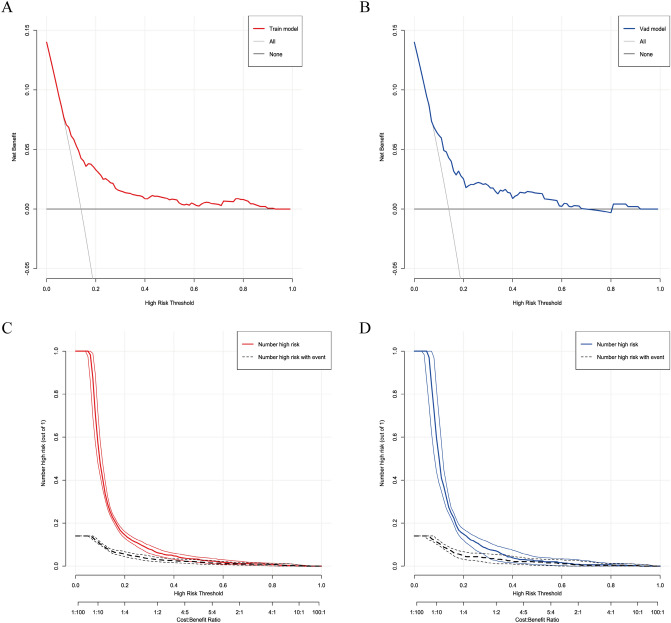 Figure 3
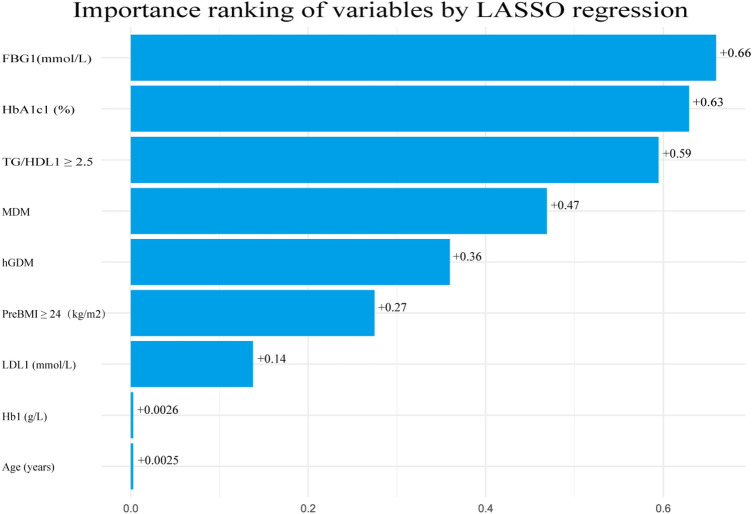 Figure 4
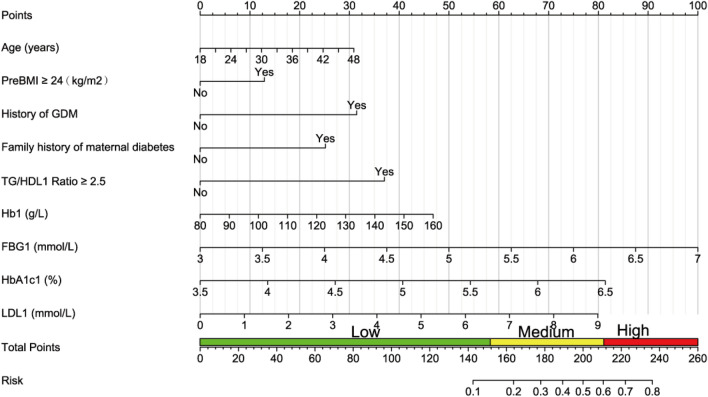 Figure 5
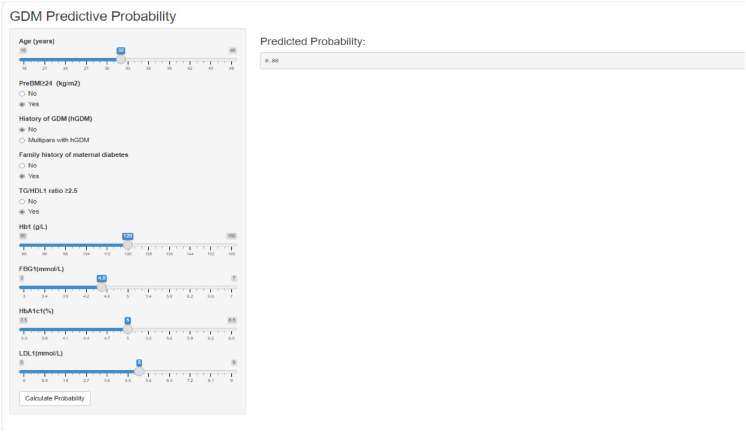 Figure 6
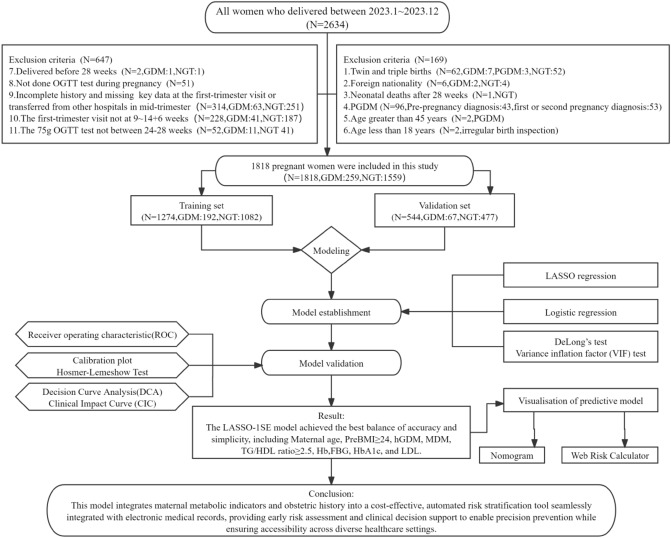 Figure 7
Peer Reviews
No public reviews on file for this paper yet. If you reviewed it on a platform where reviews are public (OpenReview, ICLR, NeurIPS, ICML), you can paste yours below so the community can read it here.
Videos
No videos yet. Explain this paper in a talk, walkthrough, or lecture? Add one.
Taxonomy
TopicsGestational Diabetes Research and Management · Preterm Birth and Chorioamnionitis · Pregnancy and preeclampsia studies
What does this study adds to the clinical work
This study developed a web-based, resource-efficient tool that uses routinely available dinical indicators from the first trimester to stratify the risk of gestational diabetes mellitus. It enables early identification of high-risk pregnancies, facilitating timely intervention at least 10 weeks earlier than the standard OGTT diagnosis.
Background
Gestational diabetes mellitus (GDM) is characterized by hyperglycemia first detected during pregnancy at glucose concentrations below the diagnostic threshold for overt diabetes. GDM affects 14–27.6% of pregnancies globally, with rising incidence linked to obesity and type 2 diabetes(T2DM) [1, 2],with variations in prevalence influenced by risk factors, screening protocols, and diagnostic criteria [1].Globally, the international association of diabetes and pregnancy study groups (IADPSG) estimates a GDM prevalence of 14.0% [3], while mainland China reports a rate of 14.8% [4].This condition poses significant maternal and neonatal risks, including pre-eclampsia, cesarean delivery, fetal macrosomia, neonatal hypoglycemia, and long-term cardiometabolic sequelae for both mother and offspring [5–9].Alarmingly, up to 31% of T2DM cases in parous women are attributable to prior GDM [10],underscoring the critical need for early post-pregnancy interventions to mitigate diabetes risk [11].
Early lifestyle modifications have demonstrated efficacy in reducing T2DM incidence and improving metabolic outcomes in offspring [12]. Currently, the diagnosis of GDM relies on a ‘one-step’ 75 g OGTT at 24–28 weeks of gestation [3],which may delay intervention, as insulin resistance and β-cell dysfunction often manifest earlier in pregnancy [13].This diagnostic lag highlights the potential of early risk stratification to guide timely interventions, such as intensive diet-exercise regimens and weight management, which effectively reduce GDM incidence in high-risk cohorts [14–17].Consequently, integrating multidimensional biomarkers—including metabolic, genetic, and hematological parameters—into early screening strategies is imperative for optimizing maternal and infant health [14, 18].
Existing prediction models for gestational diabetes mellitus (GDM) that integrate early pregnancy metabolic markers (e.g., HbA1c and lipid profiles) and clinical history face limitations in clinical utility due to inconsistencies in risk factor selection, variability in study quality, and reliance on complex or impractical biomarkers [19–21]. While machine learning (ML) approaches, particularly multi-omics integration (e.g., metabolomics and gut microbiome), demonstrate potential for improving predictive accuracy [19–21], their superiority over traditional logistic regression remains contentious [22, 23].This underscores the necessity for model selection strategies that prioritize clinical feasibility and interpretability.
To address these challenges, this study aims to develop an early GDM risk prediction tool utilizing routinely collected obstetric history and clinical indicators from the first trimester. We systematically compare traditional statistical methods with LASSO regression—a regularization technique derived from machine learning—to identify an optimal modeling approach. The clinical utility of the final model is rigorously validated through decision curve analysis (DCA) and clinical impact curve (CIC). Furthermore, key predictors are translated into a quantifiable risk score and implemented as an open-access web-based calculator. This resource-efficient solution seeks to enhance early GDM screening and enable targeted prenatal interventions, thereby improving maternal and neonatal health outcomes.
Methods
Participant’s information
This retrospective cohort study encompassed pregnant women who delivered at the southern part of Shanghai General Hospital, affiliated with Shanghai Jiao Tong University School of Medicine, from January 1 to December 31, 2023. The inclusion criteria were as follows: (1) completion of regular prenatal care and initial laboratory testing at the study center; (2) singleton live birth; and (3) absence of pre-existing chronic cardiovascular, hepatic, or renal diseases. The exclusion criteria included multiple pregnancies, foreign nationality, maternal age less than 18 years or greater than 45 years, pre-pregnancy diabetes mellitus or diagnosis of diabetes mellitus during the first or second trimester of pregnancy, neonatal death, absence of an oral glucose tolerance test (OGTT) at 24–28 weeks of gestation, initial carding not performed at 9 to 14^+6^ weeks of gestation, or missing clinically/laboratory significant data. After applying the inclusion and exclusion criteria, a total of 1818 participants (259 with GDM and 1559 with normal glucose tolerance [NGT]) were included, resulting in a GDM incidence of 14.25%. Utilizing a random seed (123) in R version 4.4.2, the cohort was divided into training (70%, n = 1274; 192 GDM cases) and validation (30%, n = 544; 67 GDM cases) sets. Ethical approval for the study was obtained from the Ethics Committee of Shanghai General Hospital (approval number: 2025KS083). Being a retrospective study, informed consent was waived by the ethics committee and adhered to the declaration of Helsinki. The details of our study process are depicted in the Flowchart.
Definitions and diagnostic criteria
GDM was diagnosed at 24–28 weeks using the IADPSG criteria via a one-step 75 g OGTT [3]. Diagnosis required meeting ≥ 1 of the following thresholds: fasting glucose ≥ 5.1 mmol/L, 1-h glucose ≥ 10.0 mmol/L, or 2-h glucose ≥ 8.5 mmol/L. Pregnancy with diabetes mellitus (PGDM) was excluded based on pre-pregnancy diabetes history or meeting any of the following criteria during the first or second trimester of pregnancy: fasting glucose ≥ 7.0 mmol/L, 2-h glucose ≥ 11.1 mmol/L, random glucose ≥ 11.1 mmol/L with hyperglycemic symptoms, or glycated hemoglobin (HbA1c) ≥ 6.5% [24].
Data collection
All pregnant women were given a detailed history by a specialized nurse at their initial visit, and an electronic history was taken. At the time of history collection, the following characteristics were obtained by reviewing the electronic medical records from the early pregnancy clinic and the history written by the obstetrician:
- Demographic information: Maternal age, geographic region, and educational level.
- Clinical history: Gravidity, parity, history of GDM (hGDM), history of previous macrosomia, conception method, polycystic ovary syndrome (PCOS), chronic hypertension, thyroid diseases, history of diabetes in first-degree relatives, etc.
- Clinical parameters: Systolic blood pressure (SBP), diastolic blood pressure (DBP), and PreBMI calculated as self-reported pre-pregnancy weight (kg)/height (m)^2^.
- First-trimester data(9 ~ 14^+6^** weeks):** Hb1, ferritin(SF1),FBG1,HbA1c1,total cholesterol (TC1), triglycerides (TG1), high-density lipoprotein cholesterol (HDL1), and LDL1.
- Second-trimester data(24 ~ 28 weeks): Hb2, SF2, FBG2, 1-h blood glucose (1 h-BG), 2-h blood glucose (2 h-BG), fasting insulin (FIN), 1-h insulin (1 h-FIN), 2-h insulin (2 h-FIN), HbA1c2,glycosylated albumin (GA),TC2,TG2,HDL2 and LDL2 and information on maternal and paediatric birth outcomes.
Since fasting insulin was not tested in early pregnancy in most pregnant women, the homeostasis model assessment of insulin resistance (HOMA–IR) was only presented at 24–28 weeks. Insulin function was assessed using the TyG index and TG/HDL-C ratio as metabolic markers [25].HOMA–IR was calculated as (FBG [mmol/L]) × (FIN [µU/mL])/22.5 to represent the insulin resistance [26].The triglyceride–glucose (TyG) index was calculated as ln (fasting TG [mg/dL] × FBG [mg/dL]/2).
Statistical methods
Data were analyzed using SPSS 27.0 (IBM) and R 4.4.2(R foundation for statistical computing).To build a robust and clinically interpretable prediction model, we adopted a machine learning-integrated analytical strategy. First, LASSO regression was employed using the glmnet package to perform automated variable selection from the initial candidate predictors. Compared with traditional stepwise regression, LASSO incorporates regularization, which reduces overfitting, improves model stability, and strengthens generalizability—key advantages of machine learning for handling multidimensional clinical data. Although the final model retains a linear form for clinical interpretability, this framework inherently supports the exploration of complex, nonlinear relationships, a capacity beyond conventional regression analysis.
The variables selected by LASSO were then incorporated into a multivariable logistic regression model (stats package) to quantify the risk of GDM. Multicollinearity was assessed using the variance inflation factor (VIF; car package). To translate the model into a clinically usable tool, it was presented visually as a nomogram and implemented as an open-access web-based calculator, facilitating straightforward and early risk assessment at the point of care.
Normality was assessed via Shapiro–Wilk tests and the shape of the histograms. Continuous variables were reported as mean ± SD (normal or approximately normal distribution) or median (Q1, Q3) (non-normal), compared using Student’s t test or Mann–Whitney U test. Categorical variables were expressed as frequencies and percentages (%), and were compared via χ^2^ or Fisher’s exact tests. There were no missing values in the disaggregated data, with less than 1% of continuous variables missing in the first trimester and less than 5% missing in the second trimester. Missing values were imputed using the mean (for normally distributed variables) or median (for non-normal variables) from five imputations. A two-tailed p value < 0.05 was considered statistically significant.
Sample size estimation
The minimum sample size was calculated using the events per predictor (EPP = 20) criterion [27, 28], with the following parameters: GDM prevalence≈14.5%, 10 predictors, target AUC = 0.7–0.8. The formula applied was:
\documentclass[12pt]{minimal} \usepackage{amsmath} \usepackage{wasysym} \usepackage{amsfonts} \usepackage{amssymb} \usepackage{amsbsy} \usepackage{mathrsfs} \usepackage{upgreek} \setlength{\oddsidemargin}{-69pt} \begin{document}$$N = \frac{{\left( {EPP \times Number of predictors} \right)}}{GDM prevalence} = \frac{{\left( {20 \times 10} \right)}}{0.145} \approx 1380$$\end{document}Our sample size (1818) met this requirement.
Model construction
Three models were constructed using three variable screening methods:
- Model_1: Variables were screened by univariate analysis (p < 0.05), VIF < 5 and backward stepwise regression, and finally MDM (Mother has diabetes mellitus), PreBMI ≥ 24, TG/HDL1 ratio ≥ 2.5, Hb1, HbA1c1, FBG1, hGDM were included.
- Model_2: Screening variables based on the‘1 standard error (1SE)’ rule (λ = 0.0239) of LASSO regression, and finally included Model_1 variables, LDL1 and age.
- Model_3: Initial screening variables based on the ‘minimum error (MIN)’ rule (λ = 0.0065) of LASSO regression, then optimized by multivariate logistic regression, and finally incorporating Model_2 variables + Parity.
The trajectories of the LASSO coefficients for different values of λ are visualized in Fig. 1. Model performance was assessed using AUC, calibration curves, DeLong’s test (in Table 4), and Hosmer–Lemeshow tests. Based on discrimination and calibration metrics, Model_2 was chosen as the final model, with subsequent development of a nomogram and web tool for clinical risk visualization. LASSO-selected variables’ contributions were visualized via bar plots to improve interpretability. DCA and CIC further evaluated net benefit and clinical utility.Fig. 1A: LAACO coefficient paths showing the variables with non-zero coefficients selected at the optimum λ. B: tenfold cross-validation curves: vertical dashed lines indicate log (λ) values for ‘1SE’ (λ = 0.0239, right) and ‘MIN’ (λ = 0.0065, left)
Results
Participant characteristics
The study included 1818 participants, with a GDM prevalence of 14.25%, consistent with prior reports [1, 4]. The cohort was divided into training (n = 1274) and validation (n = 544) sets, with balanced demographics, obstetric history, and clinical/laboratory parameters between the two groups (Table 1, p > 0.05 for all comparisons).Table 1. Baseline characteristics of participants in training and validation cohortsCharacteristicsTotal (n = 1818)Train (n = 1274)Validation (n = 544)t/χ^2^/Z**P valueMaternal baseline informationAge (years)30.84 ± 4.0030.87 ± 3.9830.77 ± 4.04t = 0.480.632PreBMI ≥ 24 kg/m^2^377 (20.74)274 (21.51)103 (18.93)χ^2^ = 1.540.215Regionχ^2^ = 0.010.917South1384 (76.13)969 (76.06)415 (76.29)North434 (23.87)305 (23.94)129 (23.71)Educationχ^2^ = 0.230.634High school and below385 (21.18)266 (20.88)119 (21.88)College and above1433 (78.82)1008 (79.12)425 (78.12)Minority(Yes)48 (2.64)30 (2.35)18 (3.31)χ^2^ = 1.350.245FHBP(Yes)325 (17.88)223 (17.50)102 (18.75)χ^2^ = 0.400.525MHBP(Yes)274 (15.07)186 (14.60)88 (16.18)χ^2^ = 0.740.390FDM(Yes)93 (5.12)68 (5.34)25 (4.60)χ^2^ = 0.430.511MDM(Yes)81 (4.46)54 (4.24)27 (4.96)χ^2^ = 0.470.493SBP (mmHg)111.51 ± 11.15111.23 ± 11.22112.17 ± 10.99t = − 1.650.100DBP (mmHg)69.44 ± 8.3269.31 ± 8.4569.72 ± 8.02t = − 0.960.337VT1 (kg/week)0.12 ± 0.200.11 ± 0.200.13 ± 0.20t = − 1.670.096IVF(Yes)131 (7.21)92 (7.22)39 (7.17)χ^2^ = 0.000.969PCOS (Yes)57 (3.14)37 (2.90)20 (3.68)χ^2^ = 0.750.387Thyroid diseases(Yes)409 (22.50)286 (22.45)123 (22.61)χ^2^ = 0.010.940Autoimmune(Yes)12 (0.66)6 (0.47)6 (1.10)χ^2^ = 1.460.227Hypertension(Yes)22 (1.21)16 (1.26)6 (1.10)χ^2^ = 0.070.785Gravidaχ^2^ = 0.580.9011761 (41.86)536 (42.07)225 (41.36)2544 (29.92)378 (29.67)166 (30.51)3313 (17.22)223 (17.50)90 (16.54) ≥ 4200 (11.00)137 (10.75)63 (11.58)Parityχ^2^ = 1.640.44101133 (62.32)795 (62.40)338 (62.13)1611 (33.61)432 (33.91)179 (32.90) ≥ 274 (4.07)47 (3.69)27 (4.96)History of GDM (hGDM)χ^2^ = 1.280.274Nullipara and Multipara without hGDM1789 (98.40)1251 (98.19)538 (98.90)Multipara with hGDM29 (1.60)23 (1.81)6 (1.10)History of macrosomiaχ^2^ = 0.230.662Nullipara and Multipara without macrosomia1777 (97.74)1244 (97.65)533 (97.98)Multipara with macrosomia41 (2.26)30 (2.35)11 (2.02)History of APO(Yes)345 (18.98)249 (19.54)96 (17.65)χ^2^ = 0.890.345Laboratory data between 9 ~ 14^+6^* weeks of pregnancyTyG1 index8.40 ± 0.388.41 ± 0.398.38 ± 0.37t* = 1.550.122TG/HDL1 ratio ≥ 2.5(Yes)24 (1.32)19 (1.49)5 (0.92)χ^2^ = 0.960.328Hb1 (g/L)127.00 ± 9.90126.79 ± 10.10127.49 ± 9.39t = − 1.370.170SF1 (ng/ml)44.30 (24.95,74.57)44.40 (25.30,75.72)43.50 (24.80,71.80)Z = − 0.610.543HbA1c1 (%)5.22 ± 0.285.22 ± 0.295.22 ± 0.26t = 0.050.963FBG1 (mmol/L)4.36 ± 0.404.37 ± 0.414.34 ± 0.38t = 1.400.163TC1 (mmol/L)4.62 ± 0.774.63 ± 0.774.61 ± 0.77t = 0.370.708TG1 (mmol/L)1.28 (1.03,1.61)1.28 (1.03,1.61)1.26 (1.03,1.60)Z = − 0.810.416HDL1 (mmol/L)1.61 ± 0.341.61 ± 0.341.62 ± 0.34t = − 0.740.458LDL1 (mmol/L)2.48 ± 0.672.49 ± 0.682.45 ± 0.65t = 0.910.365Prevalence of GDMGDM(Yes)259 (14.25)192 (15.07)67 (12.32)χ^2^ = 2.370.124HBP Hypertension, FHBP Father has HBP, MHBP Mother has HBP, DM Diabetes mellitus, FDM Father has DM, MDM Mother has DM, IVF In Vitro fertilization, APO Adverse pregnancy outcomes, VT1 Weight velocity in first trimester = (Weight1–Weight0)/week of gestation at first obstetric examination
Comparative analyses between GDM and NGT groups revealed consistent risk factors across both cohorts (Table 2). Women with GDM exhibited significantly higher maternal age (training: 31.79 vs. 30.71 years; validation: 32.12 vs. 30.58 years, p < 0.05), elevated PreBMI (≥ 24 kg/m^2^: training, 35.42% vs. 19.04%; validation, 35.82% vs. 16.56%, p < 0.05), and impaired metabolic profiles, including higher TyG index, TG/HDL ratio, HbA1c, and FBG (all p < 0.05). A history of GDM strongly predicted recurrence (training: p < 0.001; validation: p = 0.027), and SBP was elevated in GDM cases (p < 0.05). No significant differences were observed in region, education level, thyroid function, or chronic hypertension. These findings underscore the critical roles of dysregulated glucose–lipid metabolism, advanced maternal age, obesity, and prior GDM history in identifying high-risk populations.Table 2. Comparative analysis between women with GDM and those with NGT across training and validation cohortsCharacteristicsTrainValidationGDMNGTPGDMNGTP**N (%)192 (15.07)1082 (84.93)67 (12.32)477 (87.68)Maternal baseline informationAge (years)31.79 ± 4.0630.71 ± 3.94 < .00132.12 ± 4.0030.58 ± 4.020.004PreBMI ≥ 24 kg/m^2^68 (35.42)206 (19.04) < .00124 (35.82)79 (16.56) < .001Region0.9950.117South146 (76.04)823 (76.06)46 (68.66)369 (77.36)North46 (23.96)259 (23.94)21 (31.34)108 (22.64)Education0.8340.291High school and below39 (20.31)227 (20.98)18 (26.87)101 (21.17)College and above153 (79.69)855 (79.02)49 (73.13)376 (78.83)Minority(Yes)3 (1.56)27 (2.50)0.5983 (4.48)15 (3.14)0.836FHBP (Yes)33 (17.19)190 (17.56)0.90018 (26.87)84 (17.61)0.069MHBP(Yes)35 (18.23)151 (13.96)0.12211 (16.42)77 (16.14)0.954FDM (Yes)11 (5.73)57 (5.27)0.7932 (2.99)23 (4.82)0.718MDM (Yes)20 (10.42)34 (3.14) < .0015 (7.46)22 (4.61)0.480SBP (mmHg)112.77 ± 11.18110.95 ± 11.210.039115.61 ± 12.08111.68 ± 10.750.006DBP (mmHg)70.49 ± 8.5169.10 ± 8.420.03671.39 ± 9.1269.49 ± 7.840.070VT1 (kg/week)0.14 ± 0.200.11 ± 0.200.0790.17 ± 0.220.12 ± 0.200.060IVF (Yes)21 (10.94)71 (6.56)0.0313 (4.48)36 (7.55)0.510PCOS (Yes)6 (3.12)31 (2.87)0.8432 (2.99)18 (3.77)1Thyroid diseases (Yes)44 (22.92)242 (22.37)0.86614 (20.90)109 (22.85)0.720Autoimmune (Yes)1 (0.52)5 (0.46)11 (1.49)5 (1.05)0.547Hypertension (Yes)2 (1.04)14 (1.29)11 (1.49)5 (1.05)0.547Gravida0.6820.226176 (39.58)460 (42.51)24 (35.82)201 (42.14)256 (29.17)322 (29.76)17 (25.37)149 (31.24)335 (18.23)188 (17.38)15 (22.39)75 (15.72) ≥ 425 (13.02)112 (10.35)11 (16.42)52 (10.90)Parity0.2170.0240125 (65.10)670 (61.92)32 (47.76)306 (64.15)164 (33.33)368 (34.01)29 (43.28)150 (31.45) ≥ 23 (1.56)44 (4.07)6 (8.96)21 (4.40)History of GDM (hGDM) < .0010.027Nullipara and Multipara without hGDM182 (94.79)1069 (98.80)64 (95.52)474 (99.37)Multipara with hGDM10 (5.21)13 (1.20)3 (4.48)3 (0.63)History of macrosomia0.6130.893Nullipara and Multipara without macrosomia186 (96.88)1058 (97.78)65 (97.01)468 (98.11)Multipara with macrosomia6 (3.12)24 (2.22)2 (2.99)9 (1.89)History of APO(Yes)45 (23.44)204 (18.85)0.14011 (16.42)85 (17.82)0.778Laboratory data between 9 ~ 14^+6^* weeks of pregnancy*TyG1 index8.53 ± 0.398.39 ± 0.38 < .0018.49 ± 0.338.37 ± 0.370.014TG/HDL1 ratio ≥ 2.5(Yes)9 (4.69)10 (0.92) < .0011 (1.49)4 (0.84)0.483Hb1 (g/L)129.00 ± 10.33126.40 ± 10.020.001129.18 ± 9.97127.25 ± 9.290.116SF1 (ng/ml)48.25 (28.08, 77.17)43.90 (24.90, 75.47)0.26142.40 (22.25, 59.95)44.08 (25.70, 72.00)0.376HbA1c1 (%)5.33 ± 0.315.20 ± 0.28 < .0015.31 ± 0.285.21 ± 0.250.002TC1 (mmol/L)4.79 ± 0.804.60 ± 0.760.0024.53 ± 0.654.63 ± 0.780.321TG1 (mmol/L)1.34 (1.10, 1.67)1.26 (1.02, 1.59)0.0071.37 (1.12, 1.58)1.24 (1.00, 1.60)0.092HDL1 (mmol/L)1.59 ± 0.341.61 ± 0.340.3591.60 ± 0.341.63 ± 0.340.582LDL1 (mmol/L)2.68 ± 0.772.45 ± 0.66 < .0012.41 ± 0.552.46 ± 0.660.553FBG1 (mmol/L)4.55 ± 0.464.34 ± 0.39 < .0014.58 ± 0.424.31 ± 0.36 < .001
OGTT results in the second trimester and comparison of pregnancy outcomes
Table 2 demonstrates the baseline characteristics of women with gestational diabetes mellitus (GDM) and normal glucose tolerance (NGT) in the training and validation cohorts. No significant differences were observed in demographic features, metabolic parameters, or obstetric history between the two groups (all p > 0.05), confirming the balanced distribution of the data sets. Building on this, Table 3. further evaluates the metabolic profiles and maternal–neonatal outcomes between GDM and NGT in the total cohort during the second trimester (24–28 weeks of gestation). Women with GDM exhibited pronounced metabolic dysregulation, characterized by elevated TyG index (9.04 vs. 8.88, p < 0.001)—a marker linked to increased GDM risk in early pregnancy [29]—along with higher HbA1c (5.10% vs. 4.94%, p < 0.001), elevated fasting and postprandial glucose levels (e.g., 2 h-BG: 8.14 vs. 6.15 mmol/L, p < 0.001), and greater insulin resistance (HOMA–IR: 2.32 vs. 1.63, p < 0.001).Table 3OGTT results in the second trimester and comparison of pregnancy outcomesVariablesTotal (n = 1818)GDM (n = 259)NGT (n = 1559)t/χ^2^/ZPLaboratory data between 24 ~ 28 weeks of pregnancyTyG2 index8.90 ± 0.379.04 ± 0.388.88 ± 0.37t = -6.53 < 0.001TG/HDL2 ratio ≥ 2 5 (Yes)79 (4.35)20 (7.72)59 (3.78)χ^2^ = 8.280.004Hb2 (g/L)114.27 ± 9.12116.18 ± 8.87113.95 ± 9.12t = -3.65 < 0.001SF2 (ng/mL)11.90 (7.50–20.50)12.60 (7.70–22.20)11.80 (7.50–20.30)Z = − 1.400.161HbA1c2 (%)4.96 ± 0.315.10 ± 0.334.94 ± 0.29t = − 7.97 < 0.001GA (%)12.05 ± 1.0512.28 ± 1.0612.01 ± 1.04t = − 3.84 < 0.001TC2 (mmol/L)5.93 ± 0.995.85 ± 1.045.94 ± 0.98t = 1.440.149TG2 (mmol/L)2.11 (1.70–2.62)2.17 (1.79–2.68)2.09 (1.69–2.62)Z = − 2.240.025HDL2 (mmol/L)1.91 ± 0.411.87 ± 0.461.91 ± 0.41t = 1.340.181LDL2 (mmol/L)3.31 ± 0.893.25 ± 0.973.32 ± 0.88t = 1.170.24375 g OGTT between 24 ~ 28 weeks of pregnancyFBG2 (mmol/L)4.36 ± 0.414.75 ± 0.524.30 ± 0.35t = − 13.39 < 0.0011 h-BG (mmol/L)7.51 ± 1.649.69 ± 1.447.14 ± 1.36t = − 27.72 < 0.0012 h-BG (mmol/L)6.43 ± 1.288.14 ± 1.336.15 ± 1.02t = − 22.97 < 0.001FINS (pmol/L)61.95 (44.93–83.89)79.03 (57.11–103.90)59.65 (43.84–80.78)Z = − 7.85 < 0.0011 h-INS (pmol/L)502.34 (347.40–705.24)610.92 (432.22–887.25)490.51 (333.17–675.40)Z = − 6.88 < 0.0011 h-INS (pmol/L)440.33 (296.94–641.81)667.60 (505.21–932.13)415.88 (282.36–579.39)Z = − 12.55 < 0.001HOMA–IR1.70 (1.21–2.40)2.32 (1.64–3.37)1.63 (1.17–2.26)Z = − 9.61 < 0.001Maternal outcomesICP31 (1.71)6 (2.32)25 (1.60)χ^2^ = 0.320.574Gestational hypertension and pre-eclampsia165 (9.08)32 (12.36)133 (8.53)χ^2^ = 3.940.047Primary cesarean section639 (35.15)108 (41.70)531 (34.06)χ^2^ = 5.690.017Postpartum hemorrhage83 (4.57)11 (4.25)72 (4.62)χ^2^ = 0.070.791Shoulder dystocia or forceps or intermediate caesarean section67(3.69)7(2.70)60(3.85)χ^2^ = 0.820.365Neonatal outcomesNICU admission355 (19.53)54 (20.85)301 (19.31)χ^2^ = 0.340.562Neonatal jaundice (phototherapy)292 (16.06)42 (16.22)250 (16.04)χ^2^ = 0.010.942Respiratory distress syndrome22 (1.21)2 (0.77)20 (1.28)χ^2^ = 0.150.697Pneumonia176 (9.68)29 (11.20)147 (9.43)χ^2^ = 0.790.373Wet lung9 (0.50)4 (1.54)5 (0.32)χ^2^ = 4.500.034Sepsis19 (1.05)1 (0.39)18 (1.15)χ^2^ = 0.630.426Other infections37 (2.04)5 (1.93)32 (2.05)χ^2^ = 0.020.897Birth weight (g)3262.5 (2990, 3520)3250 (2995, 3530)3270 (2985, 3520)Z = − 0.260.792Macrosomia(BW ≥ 4000 g)49 (2.70)9 (3.47)40 (2.57)χ^2^ = 0.700.403LGA233 (12.82)45 (17.37)188 (12.06)χ^2^ = 5.620.018SGA130 (7.15)16 (6.18)114 (7.31)χ^2^ = 0.430.512AGA1455 (80.03)198 (76.45)1257 (80.63)χ^2^ = 2.430.119Low birth weight at term26 (1.43)3 (1.16)23 (1.48)χ^2^ = 0.010.908Hypoglycemia (< 2.6 mmol/L)12 (0.66)1 (0.39)11 (0.71)χ^2^ = 0.030.862Hypocalcemia7 (0.39)2 (0.77)5 (0.32)Fisher’s exact0.262Gestational age at delivery (weeks)39.14 (38.43, 39.86)38.86 (38.14, 39.57)39.14 (38.43, 39.86)Z = − 4.22 < 0.001Preterm birth115 (6.33)19 (7.34)96 (6.16)χ^2^ = 0.520.471Placental abruption23 (1.27)9 (3.47)14 (0.90)χ^2^ = 9.830.002Male n (%)958 (52.70)134 (51.74)824 (52.85)χ^2^ = 0.110.739Apgar score ≤ 7 at 1 min or 5 min48 (2.64)4 (1.54)44 (2.82)χ^2^ = 1.410.235Bold value means P value < 0.05, which indicates statistically significantFINS Fasting insulin, ICP Intrahepatic cholestasis of pregnancy, LGA large for gestational age, SGA small for gestational age, AGA appropriate for gestational age (defined as birth weight between the 10th and 90th percentiles for gestational age), NICU neonatal intensive care unit
In addition, the GDM group showed significantly higher rates of adverse perinatal outcomes, such as large-for-gestational-age infants (LGA: 17.4% vs. 12.1%, p = 0.018), placental abruption (3.5% vs. 0.9%, p = 0.002), gestational hypertension/pre-eclampsia (12.4% vs. 8.5%, p = 0.047), primary cesarean delivery (41.7% vs. 34.1%, p = 0.017), and neonatal wet lung syndrome (1.5% vs. 0.3%, p = 0.034). Notably, while the overall preterm birth rate (< 37 weeks) in the cohort was 6.33%, consistent with national estimates (6.1%, 95% CI 5.1–7.4) [30], no significant difference was observed between GDM and NGT groups (p = 0.471). These findings systematically highlight the detrimental effects of GDM on mid-to-late pregnancy metabolic homeostasis and its strong association with adverse maternal–neonatal outcomes, underscoring the imperative for early clinical intervention.
Key predictors and model performance
Comparative analyses of the three models revealed comparable discriminative performance between Model_2 and Model_3 via DeLong’s test (p > 0.05, Table 4). However, Hosmer–Lemeshow tests indicated superior calibration for Model_1 (χ^2^ = 8.933, P = 0.345) and Model_2 (χ^2^ = 8.160, p = 0.418), while Model_3 showed significant misfit (χ^2^ = 20.351, p = 0.009). Integrating these results, Model_2 based on LASSO regression with 1SE rule was selected for its balance of parsimony and accuracy.Table 4. Predictive models constructed from three predictor screening strategies were subjected to DeLong’s testComparison groupTrain(AUC, AUC, p)Validation(AUC, AUC, p)All data(AUC, AUC, P)Model_1 vs. Model_20.702 vs. 0.721, 0.0210.698 vs. 0.705, 0.5710.702 vs. 0.717, 0.007**Model_1 vs. Model_30.702 vs. 0.727, 0.0120.698 vs. 0.670, 0.0120.702 vs. 0.719, 0.005**Model_2 vs. Model_30.721 vs. 0.727, 0.3020.705 vs. 0.670, 0.0490.717 vs. 0.719, 0.470Model_1: MDM, PreBMI ≥ 24, TG/HDL1 ratio ≥ 2.5, Hb1, HbA1c1, FBG1, hGDMModel_2: MDM, PreBMI ≥ 24, TG/HDL1 ratio ≥ 2.5, Hb1, HbA1c1, FBG1, hGDM, LDL1, AgeModel_3: MDM, PreBMI ≥ 24, TG/HDL1 ratio ≥ 2.5, Hb1, HbA1c1, FBG1, hGDM, LDL1, Age, Parity^*^p < 0.05, **p < 0.01, ***p < 0.001
Based on the DeLong’s test in Table 4 and the multicollinearity test in Table 5, this study empirically validates the key advantages of machine learning methods—particularly LASSO regression—in handling multidimensional clinical data with potentially complex interdependencies. Through its built-in regularization mechanism, LASSO enables automatic and objective variable selection, mitigating overfitting while enhancing model stability and generalization capability. This data-driven automated process proves more efficient than traditional stepwise regression relying on statistical significance thresholds, reliably identifying feature sets with the highest predictive value. Precisely, because of these advantages—especially the optimal balance between parsimony and performance demonstrated under the 1SE criterion—we ultimately selected the LASSO–1SE (λ = 0.0239) criterion for predictor selection and constructed an early GDM prediction model. This choice laid a solid foundation for the model’s robust performance and subsequent clinical interpretation.Table 5GDM prediction model through LASSO regression with the 1SE rule and VIF test resultsPredictorsBSEWaldpOR95% CIVIFAge (years)0.0480.0187.4410.0061.0491.014–1.0861.036PreBMI ≥ 24 (kg/m^2^)0.5500.15812.0870.0011.7331.271–2.3631.057hGDM1.1640.4127.9810.0053.2031.428–7.1831.022MDM0.8140.2738.9140.0032.2571.323–3.8521.013TG/HDL1 ratio ≥ 2.51.2980.4528.2610.0043.6631.511–8.8791.009Hb1 (g/L)0.0210.0087.1540.0071.0211.006–1.0361.039FBG1 (mmol/L)1.1620.1937.24703.1982.201–4.6451.059HbA1c1 (%)1.0370.27114.66302.8201.659–4.7931.071LDL1(mmol/L)0.2070.1014.1560.0411.2301.008–1.5001.032constant − 17.3251.92680.8900
The GDM prediction model was based on Model_2 (LASSO–1SE rule, λ = 0.0239) identified nine independent predictors: maternal age, PreBMI ≥ 24 kg/m^2^, hGDM, MDM, TG/HDL ratio, Hb1, FBG1, HbA1c1 and LDL1. These variables exhibited minimal multicollinearity (VIF < 1.1) and significant associations (p < 0.05). Key metabolic markers, including FBG1 (OR = 3.20, 95% CI 2.20–4.65) and HbA1c1 (OR = 2.82, 95% CI 1.66–4.79), were the most influential predictors, followed by lipid abnormalities (TG/HDL ratio ≥ 2.5, OR = 3.66) and obesity (PreBMI ≥ 24 kg/m^2^, OR = 1.73). The model exhibited robust discriminative performance in both training (AUC = 0.721, 95% CI 0.679–0.762) and validation cohorts (AUC = 0.705, 95% CI 0.632–0.778), alongside excellent calibration (Hosmer–Lemeshow p = 0.510 and 0.385, respectively).This model emphasizes dysglycemia, dyslipidemia, and metabolic history as critical targets for early GDM risk stratification (Table 5).
Comparative analysis
The GDM prediction model showed good predictive performance with an AUC of 0.717 (95% CI 0.681–0.753) and a high positive predictive value (PPV = 0.923), suggesting strong discrimination and reliability in identifying true positives. It balanced sensitivity (69.7%) and specificity (64.9%), outperforming individual predictors such as HbA1c, FBG and LDL in overall accuracy. By integrating different biomarkers and anthropometric factors, the model enables comprehensive risk stratification, highlighting its clinical utility for targeted early intervention (Table 6).Table 6. Performance metrics (AUC, accuracy, sensitivity, specificity, PPV, NPV, cutoff) of individual predictors and the integrated clinical prediction modelPredictorsAUC (95% CI)AccuracySensitivitySpecificityPPVNPVCut offAge (years)0.583 (0.546–0.620)0.7100.7690.3550.8780.20433.5PreBMI ≥ 24 (kg/m^2^)0.586 (0.555–0.617)0.7510.8170.3550.8840.244hGDM0.520 (0.506–0.534)0.8560.9900.0500.8620.448MDM0.530 (0.512–0.549)0.8400.9640.0970.8650.309TG/HDL1 ratio ≥ 2.50.515 (0.503–0.527)0.8550.9910.0390.8610.417Hb1 (g/L)0.573 (0.536–0.611)0.5120.4910.6410.8920.173126.79FBG1 (mmol/L)0.648 (0.610–0.686)0.6670.6860.5480.9010.2254.52HbA1c1 (%)0.619 (0.581–0.657)0.6750.7090.4710.8900.2125.39LDL1(mmol/L)0.562 (0.523–0.600)0.6230.6500.4560.8780.1782.64Training0.721 (0.679–0.762)0.7160.7350.6090.9140.2900.159Validation0.705 (0.632–0.778)0.6230.6060.7460.9440.2100.123The GDM prediction model0.717 (0.681–0.753)0.6900.6970.6490.9230.2630.14
Model discrimination and calibration
The GDM prediction model exhibited good discrimination, with an AUC of 0.721 in the training set and 0.705 in the validation set (Fig. 2A, B). Calibration performance was excellent, as evidenced by low Brier scores (training: 0.112; validation: 0.098) and near-ideal calibration slopes (training: 1.000; validation: 1.033). Minimal deviations from perfect calibration were observed (Emax: training = 0.122, validation = 0.208), confirming the model’s reliability for clinical risk stratification. Calibration plots demonstrated strong agreement between predicted and observed probabilities in both data sets (Fig. 2C, D).Fig. 2A–B: ROC curves for the GDM early prediction model with training set AUC = 0.721, 95% CI 0.679–0.762 and validation set AUC = 0.705, 95% CI 0.632–0.778, respectively. C–D: The calibration curves show the probabilistic accuracy of the GDM prediction model for the training and validation sets, respectively. y axis is the actual number of GDM cases, x axis is the predicted risk probability, and the solid line reflects the agreement of the model predections of the actual observations
Clinical validity and utility
DCA revealed that the model provided superior net benefit compared to “all” or “none” intervention strategies across risk thresholds of 0.1–0.9 in training set and 0.1–0.7 in validation set, indicating that further diagnosis is beneficial when the predicted risk value is within the above range, and the model has better generalization and consistent performance (Fig. 3A, B).The CIC further validates the clinical utility of the model. For early GDM screening, a threshold close to 1:2–4:5 was used to balance sensitivity (60–80% of cases detected) and precision (20–40% true positives) to optimize timely diagnosis of actionable high-risk pregnancies while avoiding excessive false positives. The stability of the model during the training and validation phases demonstrates its reliability in different clinical settings. This range optimizes timely diagnosis for actionable high-risk pregnancies while avoiding excessive false alarms (Fig. 3C, D).Fig.3A–B are the DCA curves for the GDM risk model of the training and validation sets, respectively. The y axis estimates the net benefit, the transverse solid line represents the probability of risk that pregnant women have no GDM, and the oblique solid line represents the probability of risk that pregnant women have GDM. C–D Solid line: Predicted high-risk; dashed line: Actual cases. The term “Number high risk with event” (true positives) reflects the proportion of individuals correctly identified as high-risk who actually develop GDM. At a cost benefit ratio threshold of 1:2–4:5, the model captures 60–80% of high-risk individuals (“Number high risk” − 0.5–0.8) while ensuring that 20–40% of these flagged cases truly develop GDM (“Number high risk with event” − 0.2–0.4). Lower thresholds (eg., 1:100) increase sensitivity (capturing 100% of high-risk cases) but yield poor precision (only 20% true positives), risking unnecessary interventions. Conversely, stricter thresholds (eg., 10:1) prioritize specificity (100% true positives) but miss 60–80% of cases, delaying critical interventions
Key predictors by LASSO regression
LASSO regression identified FBG1 and HbA1c1 as the most critical predictors of GDM risk, followed by TG/HDL1 ≥ 2.5 and MDM. History of GDM,PreBMI ≥ 24 and LDL1 also had a significant effect, whereas Hb1 and Age were not strongly associated (Fig. 4). These findings highlight the dominant role of glycometabolic and lipid dysfunction in GDM pathogenesis.Fig. 4. Absolute value of the coefficient
Key predictors and nomogram development
The nomogram was developed to translate cumulative scores (0–260) into probabilistic risk estimates (Fig. 5), with glycaemic indices (FBG1, HbA1c1) contributing most significantly. Pre-pregnancy BMI ≥ 24 kg/m^2^, TG/HDL-C ratio ≥ 2.5, and maternal diabetes family history further underscore metabolic and genetic influences. The tool integrates continuous (e.g., Hb1: 80–160 g/L) and binary variables (e.g., hGDM), enabling flexible application across diverse clinical profiles.Fig. 5. Nomogram to estimate the probability of GDM
Risk stratification and threshold selection
Early screening for GDM aims to maximize sensitivity and minimize underdiagnosis, so we chose 0.14 as the low-risk threshold based on the cutoff value of the ROC curve, and 0.6 as the medium-to-high-risk threshold in conjunction with the cost–benefit ratio in the CIC charts and the net benefit curve of the DCA, a range that corresponds to a controllable cost of intervention and a high net benefit. The conclusive risk stratification parameters and evidence-based clinical guidelines have been formally established, with comprehensive details provided in Table 7. This stratification balances statistical performance, cost-effectiveness, and clinical practicality, offering a framework for personalized GDM management. Prospective studies are recommended to validate its impact on maternal and neonatal outcomes. In resource-limited settings, the high-risk threshold may be adjusted upward (e.g., > 0.7) to balance sensitivity and cost-effectiveness.Table 7. Final risk stratification thresholds and clinical recommendationsRisk categoryPredicted probabilityClinical interventionPrimary objectiveLow risk < 0.14Routine maternity check-ups, educating patients on self-monitoring of symptoms (e.g., excessive drinking, excessive urination);no additional monitoringMinimize unnecessary interventionsMedium risk0.14–0.60Ensure monthly patient monitoring, simplify screening processes (e.g., fingertip glucose + HbA1c), and provide diet and exercise guidanceBalance early detection and resource allocationHigh risk ≥ 0.60Prioritize OGTT, continuous glucose monitoring (CGM) monitoring, dietician consultations to ensure rapid interventionPrioritize high-risk cases to prevent adverse outcomes
Online risk calculator implementation
The web-based GDM risk calculator (https://wangxiao0922.shinyapps.io/20250309/) utilizes nine clinical indicators to enable early identification of high-risk pregnancies. It provides real-time risk stratification and specific intervention guidance, such as prompting OGTT for high-risk cases. By shifting initial GDM screening from 24 to 14 weeks of gestation, the tool facilitates lifestyle interventions at least 10 weeks earlier. Its compatibility with electronic health records and user-friendly design support efficient integration into routine prenatal care, significantly optimizing clinical workflow while maintaining data security. Interface of the online GDM risk calculator is depicted in Fig. 6.Fig. 6. Interface of the online GDM risk calculator (“GDM predictive probability”)
Discussion
GDM arises from a complex interplay of insulin resistance, β-cell dysfunction, placental hormone-mediated glucose metabolism disorders, and gut microbiota alterations [2, 19, 31], with placental immune microenvironment also implicated [32]. Emerging evidence highlights roles for inflammatory markers (e.g., CRP and IL-6), adipokines (lipocalin, leptin) [19, 33], metabolomic profiles (plasma branched-chain amino acids, free fatty acids) [34], proteomic markers (IGFBP0) [35, 36], and genetic polymorphisms [21], while imaging techniques such as subcutaneous/visceral fat ultrasound assessment (SAT/VAT) [37] and continuous glucose monitoring [38, 39] enhance risk stratification in high-risk populations. Current GDM prediction models face an “accuracy-practicality” trade-off: simplified models based on basic indicators (e.g., age and PreBMI) exhibit limited discrimination (AUC 0.69) [40], whereas advanced models integrating metabolic markers (e.g. OGTT), genomics, or machine learning achieve higher AUC (0.82–0.87) [21, 41] but suffer from high costs and poor clinical feasibility.
Our LASSO-derived nomogram addresses these limitations by incorporating nine accessible predictors: age ≥ 33.5 years (linked to age-related insulin resistance) [2, 42], PreBMI (chronic inflammation and obesity-driven insulin resistance) [23, 42, 43], prior GDM (OR 10.4 for recurrence; tenfold elevated postpartum T2DM risk) [2, 11, 44], maternal diabetes history (the ORs for this study were 2.257; mitochondrial DNA mutations and epigenetic programming) [45–48], early HbA1c (threshold 5.2–5.6%, reflecting pregnancy-specific glycemic dynamics, possibly related to haemodilution and changes in iron metabolism during pregnancy) [39] [49, 50], FBG(early pregnancy FBG is an independent risk factor for GDM) [40, 51, 52], TG/HDL ratio ≥ 2.5 (lipid-driven insulin resistance and systemic inflammatory response) [25, 53], LDL (synergistic lipid-inflammatory effects) [54, 55], and Hb (threshold effect via oxidative stress and iron metabolism) [56–58]. The model demonstrated moderate discrimination (AUC 0.721 training, 0.705 validation) with robust calibration (Hosmer–Lemeshow p = 0.418) and clinical utility across risk thresholds (DCA and CIC-confirmed). Key strengths include cost-effectiveness, interpretability, and adaptability to resource-limited settings via a web-based nomogram.
Notably, lipid indices (TG/HDL, LDL) outperformed traditional obesity-centric metrics, particularly in Asian populations with lower baseline adiposity [25, 53]. Maternal diabetes history exhibited stronger predictive power than paternal history (p > 0.7 for FDM), underscoring intrauterine epigenetic programming as a critical pathway [45–48]. While HbA1c and FBG provided synergistic glycemic insights, their pregnancy-specific thresholds require validation against erythrocyte turnover dynamics and hemodilution effects [39, 50].The web tool’s integration with routine prenatal data enables real-time risk stratification without additional costs, addressing a critical gap in low-resource settings.
This study has several limitations. First, due to its retrospective design and reliance on routine electronic medical records, we were unable to directly obtain and quantify key lifestyle variables during pregnancy, such as detailed dietary patterns, physical activity frequency, and intensity. To partially compensate for this, we used region (as a rough proxy for dietary differences between northern and southern China) and educational attainment (as a general indicator of health awareness and behavior) for approximate assessment. However, it must be acknowledged that these proxy variables cannot accurately reflect individual energy intake and expenditure, potentially introducing residual confounding. Second, although we calculated the rate of weight gain in early pregnancy (VT1) to reflect initial gestational weight change, this variable did not show a statistically significant difference between the GDM and non-GDM groups in our cohort, suggesting its limited independent predictive value and indicating a potential need for more refined anthropometric measures (e.g., waist-to-hip ratio). These data-level constraints may partially explain why the model's predictive performance (AUC = 0.717) did not achieve higher levels.
A critical and inherent limitation is the model's uncertain generalizability. Developed from a single-center Shanghai cohort, its core predictive strength lies in the biological universality of established risk factors (e.g., pre-pregnancy BMI, age, family history of diabetes, FBG, and lipid profiles). While this provides a rationale for testing in other settings, its performance may be limited in populations with significantly different genetic backgrounds, lifestyle patterns (e.g., diet and physical activity), or healthcare practices, which could alter the specific weight and calibration of model variables. Therefore, the model should be viewed as a promising but require validation framework rather than a directly deployable tool for dissimilar populations.
To address these limitations and advance the model toward responsible clinical application, we propose a focused future research agenda structured around three sequential goals:
- Prospective data enrichment and model refinement: Future studies should adopt a prospective design to systematically collect detailed lifestyle data using validated tools, such as food frequency questionnaires, physical activity scales, or wearable devices. Concurrently, the integration of accessible, low-cost biomarkers (e.g., serum adiponectin and C-reactive protein) and the exploration of dynamic clinical indicators—such as the early pregnancy systolic blood pressure growth rate, suggested by our findings—should be investigated to enhance the model's discriminatory ability and biological plausibility.
- Rigorous multicenter external validation and calibration: A pivotal next step is to evaluate the model's transportability through prospective, multicenter validation. We recommend an initial collaborative study across 3–5 medical centers in China that represent major geographic and socioeconomic regions (e.g., Northeast, North, South, Northwest, and Southwest). This study must employ standardized protocols for data collection and GDM diagnosis (preferably IADPSG criteria). The analysis will not only test the model's overall performance but also conduct subgroup analyses (e.g., by region and ethnicity) to identify where and for whom the model works, leading to necessary recalibration or adjustment for specific subpopulations.
- Clinical implementation science evaluation: Following successful validation, research should shift toward implementation. This involves packaging the validated model into user-friendly clinical tools (e.g., web calculators and EHR integrations) and conducting pilot studies to evaluate its real-world feasibility, clinician acceptance, impact on high-risk patient identification, and ultimately, its effect on promoting timely intervention within routine prenatal care workflows.
By following this logical progression—from enriching the model’s inputs, to rigorously testing its generalizability, and finally to assessing its practical utility—future work can systematically transform this proof-of-concept framework into an evidence-based tool suitable for broader application.
Conclusion
This GDM prediction model integrates maternal metabolic indicators and obstetric history into a cost-effective stratification tool that enables automated risk scoring and clinical decision support through integration with electronic medical record systems. An online calculator provides real-time, user-friendly risk stratification and seamless integration with antenatal management to provide actionable guidance for timely intervention. To maintain clinical utility, the model requires regular calibration to optimize risk thresholds. Future studies should validate its generalizability, integrate emerging biomarkers such as immune-inflammatory markers to enhance predictive efficacy, and evaluate scalable early intervention strategies in perinatal care. By integrating predictive analytics with clinical workflow, this approach advances precision prevention while ensuring accessibility across different healthcare settings.