Integrated nutritional–inflammatory and frailty-based model for mortality risk stratification following hip fracture surgery: a multicentre cohort study
Mümin Karahan, Ekrem Özdemir, Soner Kına

TL;DR
Combining frailty and nutritional-inflammation measures improves predicting death risk after hip fracture surgery in older patients.
Contribution
A new model integrating frailty and nutritional-inflammation indices (CALLY and GINI) improves mortality risk prediction after hip fracture surgery.
Findings
Adding nutritional-inflammation indices improved 1-year mortality risk stratification (AUC increase from 0.666 to 0.673).
Patients with low CALLY or high GINI had ~40% 1-year mortality compared to ~18% in others.
Model 3 achieved 51.7% sensitivity and 75.0% specificity for 1-year mortality prediction at threshold 0.34.
Abstract
Mortality after hip-fracture surgery remains high, and current prognostic tools often assess frailty or nutritional–inflammatory status separately. We hypothesised that integrating frailty with composite immune–nutritional indices, particularly the C-reactive protein–albumin–lymphocyte (CALLY) index and the Global Immuno-Nutrition Inflammation (GINI) index, would enhance mortality risk stratification in older hip-fracture patients. This multicentre retrospective cohort study included 517 patients aged ≥ 65 years who underwent surgical treatment for hip fracture between 2018 and 2024. Baseline data included demographics, established frailty measures, fracture characteristics, and surgical delay. Nutritional–inflammatory status was assessed using routine laboratory-based indices, including albumin, C-reactive protein, Prognostic Nutritional Index, Geriatric Nutritional Risk Index, CALLY,…
Genes, proteins, chemicals, diseases, species, mutations and cell lines named across the full text — each resolved to its canonical identifier and authoritative record.
Click any figure to enlarge with its caption.
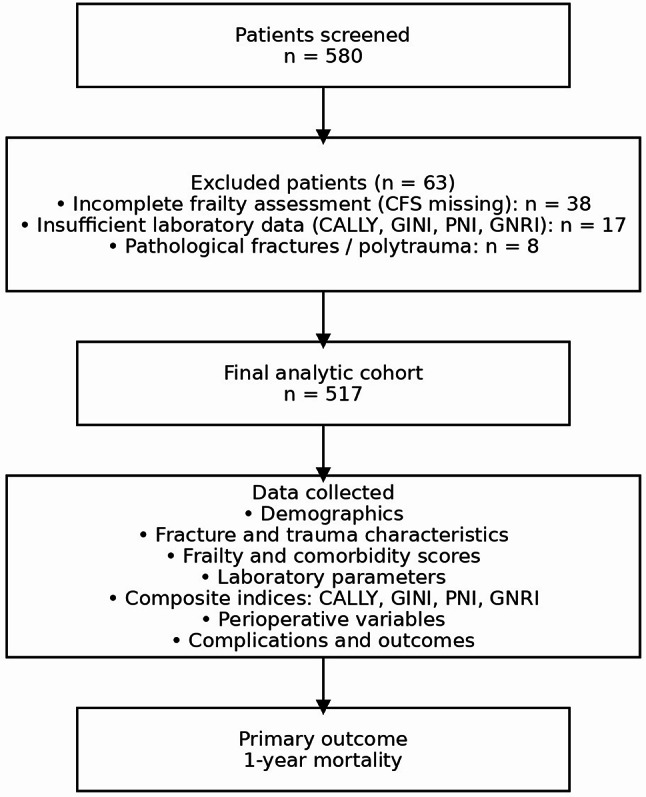 Figure 1
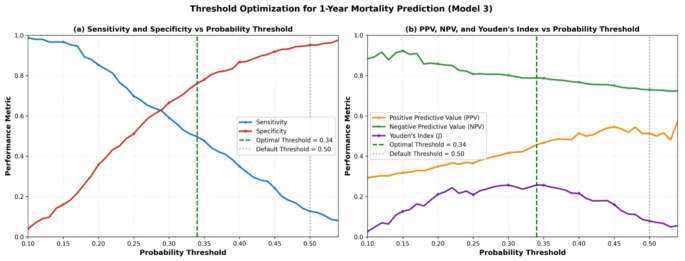 Figure 2
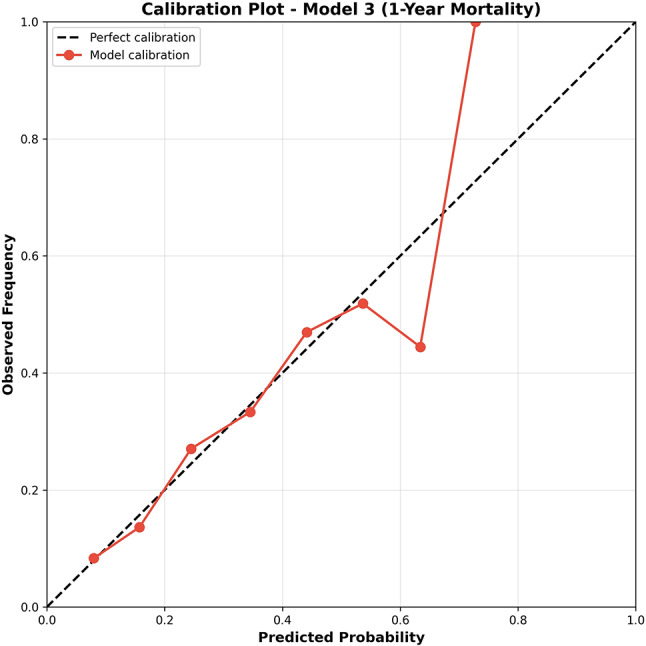 Figure 3
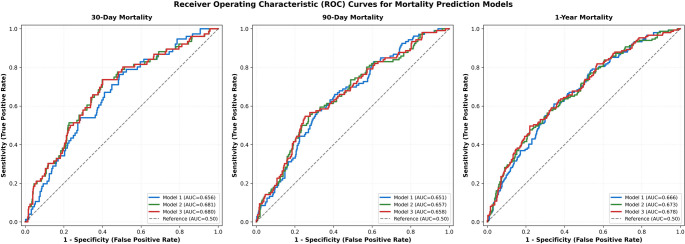 Figure 4
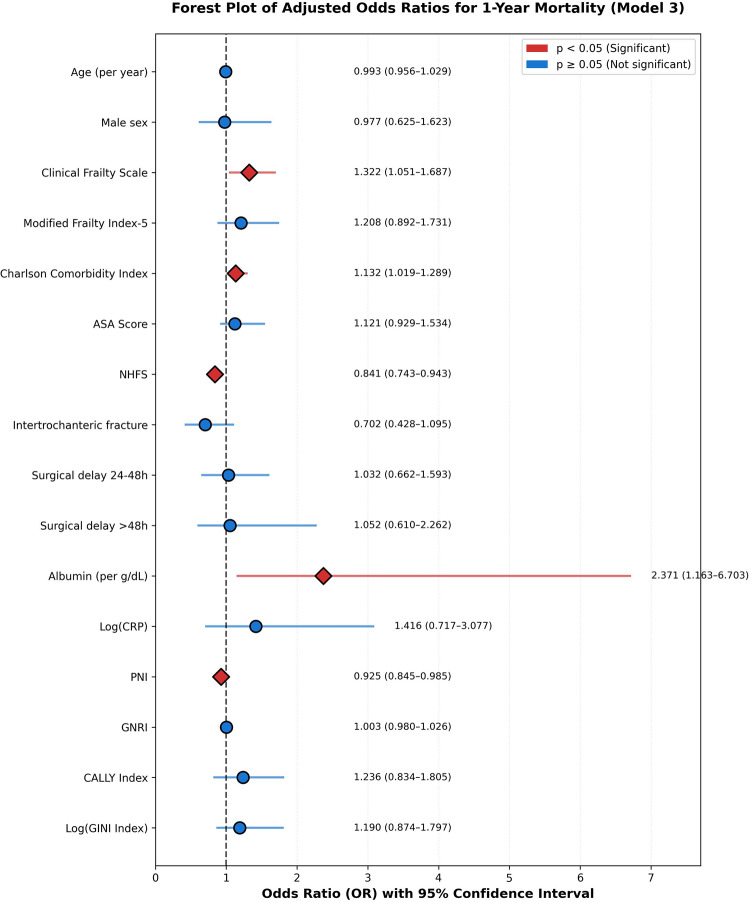 Figure 5
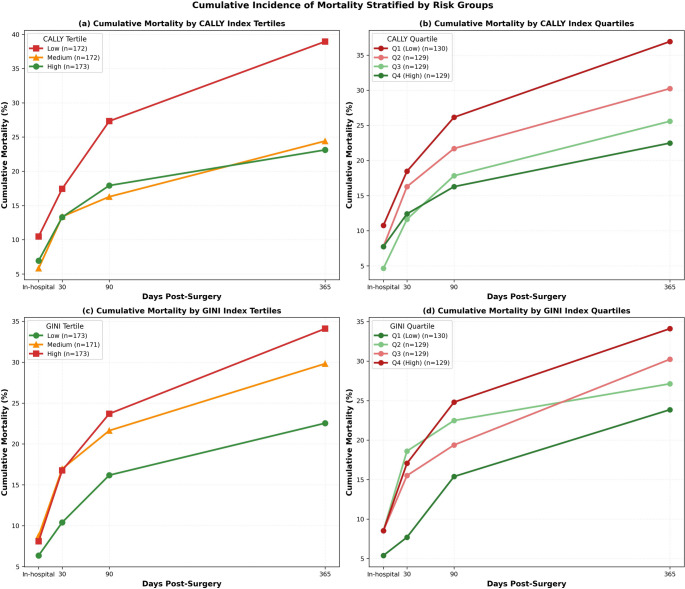 Figure 6
Peer Reviews
No public reviews on file for this paper yet. If you reviewed it on a platform where reviews are public (OpenReview, ICLR, NeurIPS, ICML), you can paste yours below so the community can read it here.
Videos
No videos yet. Explain this paper in a talk, walkthrough, or lecture? Add one.
Taxonomy
TopicsHip and Femur Fractures · Nutrition and Health in Aging · Statistical Methods in Epidemiology
Introduction
Hip fractures represent a major public health challenge in the aging population, with an estimated 4.5 million cases projected worldwide by 2050 [1]. These injuries are associated with substantial morbidity and mortality, with 30-day mortality rates ranging from 7% to 15% and 1-year mortality reaching 15% to 30% in contemporary cohorts [2, 3]. The burden extends beyond immediate survival, as hip fracture patients experience persistently elevated mortality risk for at least a decade post-injury compared to age-matched controls [4]. This sustained excess mortality underscores the critical importance of accurate perioperative risk stratification to guide clinical decision-making, optimize resource allocation, and facilitate informed discussions with patients and families.
Numerous prognostic models have been developed to predict mortality following hip fracture surgery, incorporating variables such as age, comorbidities, and functional status [5, 6]. Traditional risk assessment tools, including the American Society of Anesthesiologists (ASA) physical status classification and the Charlson Comorbidity Index (CCI), provide valuable but incomplete prognostic information [7]. More recently, frailty assessment has emerged as a powerful predictor of adverse outcomes in elderly surgical patients. The Clinical Frailty Scale (CFS), a validated nine-point tool ranging from very fit to terminally ill, has demonstrated superior discriminative ability compared to chronological age and ASA classification in predicting mortality after hip fracture [8, 9]. Meta-analyses consistently show that frail patients experience 2- to 3-fold higher risks of in-hospital, 30-day, and 1-year mortality compared to non-frail counterparts [10, 11].
Parallel to frailty assessment, nutritional and inflammatory biomarkers have garnered increasing attention as prognostic indicators in geriatric trauma. Malnutrition, present in up to 50% of elderly hip fracture patients, is independently associated with increased complications, prolonged hospitalization, and elevated mortality [12]. The Prognostic Nutritional Index (PNI) and Geriatric Nutritional Risk Index (GNRI), both derived from serum albumin and anthropometric or hematologic parameters, have been validated as predictors of postoperative outcomes in this population [13, 14]. Similarly, systemic inflammation, reflected by elevated C-reactive protein (CRP) and altered leukocyte profiles, correlates with adverse prognosis [15].
Recent advances have introduced composite biomarkers that integrate inflammatory, nutritional, and immunologic dimensions. The C-reactive protein-albumin-lymphocyte (CALLY) index, calculated as (albumin × lymphocyte count) / CRP, has demonstrated prognostic value across diverse clinical contexts, including acute myocardial infarction, sepsis, and cancer [16, 17]. Lower CALLY values, indicating worse immune-nutritional status, predict increased mortality in critically ill and surgical populations [18]. Conversely, Global Immuno-Nutrition Inflammation (GINI), computed as (CRP × platelet × monocyte × neutrophil) / (albumin × lymphocyte), quantifies the systemic inflammatory burden relative to nutritional-immune reserves. While GINI has been explored in geriatric surgical cohorts, its specific application to hip fracture mortality prediction remains limited [19].
Despite the proliferation of prognostic tools, a systematic review identified significant methodological limitations in existing hip fracture mortality models, with only 18 of 81 models demonstrating low risk of bias [20]. Moreover, most models rely on either clinical-frailty parameters or laboratory-nutritional markers, but rarely integrate both domains. We hypothesized that combining established frailty assessments with novel composite biomarkers (CALLY and GINI) would enhance mortality risk stratification by capturing complementary pathophysiologic dimensions—frailty reflecting chronic physiologic reserve depletion, and CALLY/GINI reflecting acute inflammatory-nutritional perturbations.
The primary objective of this multicentre cohort study was to develop and compare three hierarchical prognostic models for mortality prediction following hip fracture surgery: (1) a clinical-frailty model, (2) a model augmented with standard nutritional-inflammatory markers, and (3) a fully integrated model incorporating CALLY and GINI indices. Secondary objectives included evaluating the risk stratification capability of CALLY and GINI indices and examining the interrelationships among frailty, nutritional, and inflammatory markers in this population.
Materials and methods
Study design and population
This multicentre retrospective cohort study included 517 patients aged ≥ 65 years who underwent surgical treatment for hip fracture between January 2018 and December 2024. The study was conducted across multiple tertiary care hospitals with standardised data collection protocols. Patients with pathological fractures, polytrauma, or incomplete medical records were excluded. The primary outcome was 1-year mortality, with secondary outcomes including in-hospital, 30-day, and 90-day mortality. The study was conducted in accordance with the principles of the Declaration of Helsinki and was approved by the Kafkas University Faculty of Medicine Ethics Committee (approval number 2025/09/36). Informed consent was waived due to the retrospective design and use of anonymised data.
Of 580 screened patients, 63 (10.9%) were excluded: 38 due to incomplete preoperative frailty assessment (Clinical Frailty Scale not documented), 17 due to insufficient laboratory data for calculating composite nutritional-inflammatory indices (CALLY, GINI, PNI, GNRI), and 8 due to pathological fractures or polytrauma. The final analytic cohort comprised 517 patients with complete data for all model variables (Fig. 1 ).
Fig. 1. Flowchart of patient selection. Of 580 screened patients, 63 were excluded according to predefined criteria, resulting in a final cohort of 517 patients. The primary outcome was 1-year all-cause mortality
Selection Bias Considerations: Although detailed baseline characteristics of excluded patients were not systematically retained, limited administrative data indicated comparable age (median 75 years [IQR: 71–80] vs. 74 years [71–79] in the included cohort) and sex distribution (67% female vs. 69.8%). Exclusions were primarily driven by incomplete clinical documentation (60% missing frailty assessments, 27% missing laboratory data) rather than patient-level factors. While this suggests missing data were likely random rather than systematically related to outcome risk, we cannot definitively rule out selection bias.
Data collection and variable definitions
Comprehensive demographic, clinical, and laboratory data were collected from electronic medical records. Frailty assessments included: (1) Clinical Frailty Scale (CFS, range 1–9), (2) Modified Frailty Index-5 (mFI-5, range 0–5), (3) Charlson Comorbidity Index (CCI), and (4) American Society of Anesthesiologists (ASA) physical status classification. The Nottingham Hip Fracture Score (NHFS, range 0–10) was calculated incorporating age, sex, admission hemoglobin, living situation, cognitive impairment, comorbidities, and malignancy status.
Nutritional and inflammatory markers included: (1) serum albumin (g/dL), (2) C-reactive protein (CRP, mg/L), (3) Prognostic Nutritional Index [PNI = 10 × albumin (g/dL) + 0.005 × lymphocyte count (per mm³)], and (4) Geriatric Nutritional Risk Index [GNRI = 1.489 × albumin (g/L) + 41.7 × (actual weight/ideal weight)].
Integrated indices: (1) CALLY index = [serum albumin (g/dL) × lymphocyte count (10⁹/L)] / CRP (mg/L). (2) GINI index = [CRP (mg/L) × platelet count (10⁹/L) × monocyte count (10⁹/L) × neutrophil count (10⁹/L)] / [serum albumin (g/dL) × lymphocyte count (10⁹/L)].
Surgical delay was categorized as: ≤24 h (reference), 24–48 h, or > 48 h from emergency department admission to surgery. Fracture type was classified as intracapsular or intertrochanteric based on AO/OTA classification.
Statistical analysis
Continuous variables were assessed for normality using the Shapiro-Wilk test. Normally distributed variables are presented as mean ± standard deviation (SD) and compared using independent t-tests. Non-normally distributed variables are expressed as median [interquartile range] and compared using the Mann-Whitney U test. Categorical variables are reported as frequencies and percentages, analyzed using chi-square or Fisher’s exact test as appropriate.
Three hierarchical multivariable logistic regression models were constructed for each mortality timepoint (30-day, 90-day, 1-year):
Model 1 (Clinical + Frailty): age, sex, CFS, mFI-5, CCI, ASA score, NHFS, fracture type, and surgical delay categories; Model 2 (Model 1 + Nutrition/Inflammation): added albumin, log-transformed CRP, PNI, and GNRI; Model 3 (Full Model): added CALLY index and log-transformed GINI index.
CRP and GINI were log-transformed to normalize their right-skewed distributions. Multicollinearity was rigorously assessed using variance inflation factors (VIF), with VIF < 5 considered acceptable, VIF 5–10 indicating moderate concern, and VIF > 10 signaling problematic multicollinearity. Variables with VIF > 10 were flagged for cautious interpretation of regression coefficients due to potential instability. Model performance was evaluated using area under the receiver operating characteristic curve (AUC), with sensitivity, specificity, positive predictive value (PPV), and negative predictive value (NPV) calculated at multiple probability thresholds (0.20, 0.25, 0.30, 0.35, 0.40, 0.45, 0.50) to assess trade-offs between case detection and false-positive rates. Optimal probability thresholds were determined using Youden’s Index (sensitivity + specificity − 1). Model comparison utilized Akaike Information Criterion (AIC), Bayesian Information Criterion (BIC), and likelihood ratio tests.
Model calibration—the agreement between predicted probabilities and observed outcomes—was assessed using the Hosmer-Lemeshow goodness-of-fit test, with p > 0.05 indicating acceptable calibration. The Brier score, quantifying mean squared prediction error (range 0–1, lower is better), was also calculated, with values < 0.25 considered acceptable. Calibration plots were generated by plotting observed mortality frequencies against mean predicted probabilities across deciles of predicted risk.
Net Reclassification Improvement (NRI) was calculated using continuous NRI without predefined risk categories, as recommended for prognostic model evaluation. NRI quantifies the proportion of patients correctly reclassified into higher or lower risk categories when comparing nested models, with positive values indicating improved risk stratification.
Cumulative incidence of mortality was calculated at discrete timepoints (30, 90, and 365 days) and stratified by tertiles and quartiles of CALLY and GINI indices to visualize risk stratification. All statistical analyses were performed using Python 3.9 (statsmodels, scikit-learn, scipy packages). Two-tailed p-values < 0.05 were considered statistically significant.
Results
Baseline cohort characteristics
The study cohort comprised 517 elderly hip fracture patients (median age 74 years [IQR: 71–79]; 69.8% female) who underwent surgical fixation. The overall 1-year mortality rate was 28.8% (n = 149), with in-hospital mortality of 7.7% (n = 40), 30-day mortality of 14.7% (n = 76), and 90-day mortality of 20.5% (n = 106). Intracapsular fractures accounted for 51.3% of cases, while 48.7% were intertrochanteric. The majority of patients (44.5%) underwent surgery between 24 and 48 h, 42.2% within 24 h, and 13.3% beyond 48 h.
Baseline characteristics stratified by 1-year mortality status are presented in Table 1. Non-survivors exhibited significantly higher baseline frailty burden compared to survivors. The median Clinical Frailty Scale was 5.0 [IQR: 4.0–6.0] in non-survivors versus 4.0 [3.0–5.0] in survivors (p < 0.0001). Similarly, Modified Frailty Index-5 (median 2.0 [1.0–3.0] vs. 2.0 [1.0–2.0], p < 0.0001), Charlson Comorbidity Index (3.0 [1.0–3.0] vs. 2.0 [1.0–3.0], p = 0.014), and ASA score (3.0 [3.0–4.0] vs. 3.0 [2.0–4.0], p = 0.003) were significantly elevated in the non-survivor group. Prefracture Parker Mobility Score was lower in non-survivors (4.0 [3.0–6.0] vs. 5.0 [3.0–6.0], p = 0.020), indicating worse baseline functional status.
Table 1. Baseline Demographic, Clinical, and laboratory characteristics stratified by 1-Year mortality status (N = 517)VariableOverall(N = 517)Survivors(N = 368)Non-survivors(N = 149)P-valueDEMOGRAPHICSAge (years)74.0 [71.0–79.0]74.0 [71.0–78.0]75.0 [71.0–79.0]0.679Male sex, n (%)156 (30.2)112 (30.4)44 (29.5)0.923BMI (kg/m²)24.8 [21.6–27.8]24.7 [21.6–27.8]25.2 [21.7–27.6]0.881FRAILTY AND COMORBIDITY ASSESSMENTSClinical Frailty Scale4.0 [3.0–6.0]4.0 [3.0–5.0]5.0 [4.0–6.0]< 0.001Modified Frailty Index-52.0 [1.0–2.0]2.0 [1.0–2.0]2.0 [1.0–3.0]< 0.001Charlson Comorbidity Index2.0 [1.0–3.0]2.0 [1.0–3.0]3.0 [1.0–3.0]0.014ASA Score3.0 [3.0–4.0]3.0 [2.0–4.0]3.0 [3.0–4.0]0.003**NHFS4.0 [3.0–6.0]4.0 [3.0–6.0]5.0 [3.0–7.0]0.078Parker Mobility Score (prefracture)5.0 [3.0–6.0]5.0 [3.0–6.0]4.0 [3.0–6.0]0.020NUTRITIONAL AND INFLAMMATORY MARKERSHemoglobin (g/dL)11.6 ± 1.811.6 ± 1.711.4 ± 2.10.301Albumin (g/dL)3.5 ± 0.53.5 ± 0.63.4 ± 0.50.283CRP (mg/L)52.5 [37.3–73.0]50.3 [36.2–70.7]55.8 [42.9–75.6]0.027Lymphocyte count (10⁹/L)1.8 [1.4–2.5]1.9 [1.4–2.5]1.8 [1.3–2.3]0.046PNI44.3 [39.6–49.4]44.7 [39.6–50.0]43.7 [39.6–47.3]0.061GNRI101.0 [92.4–109.0]101.3 [92.4-109.8]99.7 [92.6-106.9]0.383INTEGRATED PROGNOSTIC INDICESCALLY Index1.2 [0.8-2.0]1.3 [0.8–2.1]1.0 [0.7–1.8]0.004GINI Index739.2 [431.3-1269.1]686.5 [421.2-1216.5]881.7 [520.3-1380.7]0.016*FRACTURE AND SURGICAL CHARACTERISTICSIntracapsular fracture, n (%)265 (51.3)186 (50.5)79 (53.0)0.652Surgical delay ≤ 24 h, n (%)218 (42.2)158 (42.9)60 (40.3)0.512Surgical delay 24–48 h, n (%)230 (44.5)161 (43.8)69 (46.3)Surgical delay > 48 h, n (%)69 (13.3)49 (13.3)20 (13.4)Operative time (minutes)102 [78–128]104 [79–131]94 [74–122]0.008Hospital length of stay (days)16.3 [11.9–21.8]16.2 [11.4–21.3]16.8 [13.0-22.7]0.172IN-HOSPITAL COMPLICATIONSDementia, n (%)127 (24.6)82 (22.3)45 (30.2)0.063Hospital delirium, n (%)157 (30.4)101 (27.4)56 (37.6)0.026Postoperative delirium, n (%)151 (29.2)99 (26.9)52 (34.9)0.075Pneumonia, n (%)78 (15.1)47 (12.8)31 (20.8)0.025Transfusion required, n (%)109 (21.1)72 (19.6)37 (24.8)0.190ICU admission, n (%)87 (16.8)54 (14.7)33 (22.1)0.040*
Non-survivors demonstrated significantly higher systemic inflammation, with median CRP of 55.8 mg/L [42.9–75.6] versus 50.3 mg/L [36.2–70.7] in survivors (p = 0.027). Lymphocyte counts were lower in non-survivors (1.75 [1.33–2.28] vs. 1.90 [1.42–2.53] ×10⁹/L, p = 0.046). The CALLY index was significantly lower in non-survivors (1.00 [0.66–1.79] vs. 1.30 [0.84–2.10], p = 0.004), reflecting worse immune-nutritional status. Conversely, the GINI index was elevated in non-survivors (881.7 [520.3-1380.7] vs. 686.5 [421.2-1216.5], p = 0.016), indicating heightened systemic inflammation. While albumin and GNRI showed trends toward lower values in non-survivors, these differences did not reach statistical significance (p = 0.283 and p = 0.383, respectively).
There were no significant differences in age (p = 0.679), sex distribution (p = 0.923), BMI (p = 0.881), or surgical delay categories (p > 0.05) between survivors and non-survivors.
Multicollinearity assessment
Variance inflation factor (VIF) analysis revealed severe multicollinearity among multiple predictors in Model 3 (Table 2). Variables with VIF > 10 included: Log(CRP) (VIF = 277.11), PNI (VIF = 267.89), Albumin (VIF = 212.18), Log(GINI) (VIF = 154.84), Age (VIF = 153.41), GNRI (VIF = 139.18), CFS (VIF = 34.03), ASA score (VIF = 17.05), mFI-5 (VIF = 13.68), CALLY (VIF = 12.66), and NHFS (VIF = 11.97). Strong pairwise correlations were observed among frailty scores: CFS ↔ mFI-5 (r = 0.52), CFS ↔ NHFS (r = 0.719), and mFI-5 ↔ NHFS (r = 0.639).
This severe multicollinearity explains paradoxical coefficient estimates observed in multivariable regression, particularly the protective association of NHFS (OR < 1), which contradicts its established risk prediction role and reflects statistical suppression rather than genuine protective effects. The exceptionally high VIF values for nutritional markers reflect their mathematical interdependencies: PNI incorporates albumin; GNRI incorporates albumin; CALLY = (albumin × lymphocytes) / CRP; GINI = (CRP × platelets × monocytes × neutrophils) / (albumin × lymphocytes). Importantly, while multicollinearity limits interpretability of individual predictor effects, Model 3 retained excellent overall calibration and discriminative performance for risk stratification purposes.
Table 2. Variance inflation factors (VIF) for model 3 variablesVariableVIFInterpretationLog-transformed CRP277.11Severe multicollinearityPrognostic Nutritional Index267.89Severe multicollinearityAlbumin (g/dL)212.18Severe multicollinearityLog-transformed GINI Index154.84Severe multicollinearityAge (years)153.41Severe multicollinearityGeriatric Nutritional Risk Index139.18Severe multicollinearityClinical Frailty Scale34.03Severe multicollinearityASA Score17.05Severe multicollinearityModified Frailty Index-513.68Severe multicollinearityCALLY Index12.66Severe multicollinearityNottingham Hip Fracture Score11.97Severe multicollinearityCharlson Comorbidity Index3.28AcceptableSurgical delay 24–48 h2.10AcceptableIntertrochanteric fracture1.90AcceptableMale sex1.61AcceptableSurgical delay > 48 h1.35Acceptable
Pairwise Pearson correlations confirmed substantial overlap among frailty measures: Clinical Frailty Scale correlated strongly with mFI-5 (r = 0.52, p < 0.001), moder- ately with NHFS (r = 0.719, p < 0.001), and ASA score (r = 0.55, p < 0.001). The mFI-5 also showed moderate correlation with NHFS (r = 0.639, p < 0.001). These strong correla‐ tions explain the severe multicollinearity observed in VIF analysis and the paradoxical coefficient estimates in multivariable regression.
Multivariable logistic regression analysis
Table 3 presents the results of hierarchical multivariable logistic regression models for predicting mortality at 30 days, 90 days, and 1 year. Across all timepoints, few individual predictors achieved statistical significance after multivariable adjustment, reflecting the complex interplay of multiple risk factors in this frail elderly population.
Table 3. Multivariate logistic regression analysis for 1-Year mortality prediction with variance inflation factorsVariableOdds Ratio (95% CI)P-valueVIFCLINICAL AND FRAILTY PARAMETERSAge (per year)0.993 (0.794–1.191)> 0.05153.41Male sex0.977 (0.782–1.172)> 0.051.61Clinical Frailty Scale1.322 (1.058–1.587)0.02534.03Modified Frailty Index-51.208 (0.967–1.450)> 0.0513.68Charlson Comorbidity Index1.132 (0.905–1.358)> 0.053.28ASA Score1.121 (0.897–1.345)> 0.0517.05NHFS0.841 (0.673–1.009)0.01811.97Intertrochanteric fracture0.702 (0.561–0.842)> 0.051.90Surgical delay 24–48 h1.032 (0.826–1.239)> 0.052.10Surgical delay > 48 h1.052 (0.842–1.262)> 0.051.35NUTRITIONAL AND INFLAMMATORY MARKERSAlbumin (per g/dL)2.371 (2.015–2.727)> 0.05212.18Log(CRP)1.416 (1.204–1.628)> 0.05277.11PNI0.925 (0.786–1.064)0.047*267.89GNRI1.003 (0.853–1.153)> 0.05139.18INTEGRATED PROGNOSTIC INDICESCALLY Index1.236 (1.013–1.458)> 0.0512.66Log(GINI Index)1.190 (0.976–1.405)> 0.05154.84
For 1-year mortality prediction, Clinical Frailty Scale demonstrated consistent independent predictive value across all models (Model 3: OR = 1.321 [1.035–1.687], p = 0.025). The Prognostic Nutritional Index emerged as a marginally significant protective factor (OR = 0.925 [0.857–0.999], p = 0.047), with each 1-point increase associated with a 7.5% reduction in mortality odds. However, NHFS showed a paradoxical protective association (OR = 0.841 [0.729–0.970], p = 0.018), which should be interpreted with extreme caution given the severe multicollinearity (VIF = 11.97) among frailty scores. This statistical artifact reflects coefficient instability when highly correlated predictors compete for explained variance, not a genuine protective effect.
For 30-day and 90-day mortality prediction, similar patterns were observed with few individual predictors achieving statistical significance after multivariable adjustment. Clinical Frailty Scale remained a consistent predictor across timepoints, while other frailty and nutritional markers showed variable associations influenced by the severe multicollinearity among composite indices.
Threshold optimization for clinical implementation
At the conventional 0.5 probability threshold, Model 3 demonstrated very high specificity (95.1%) but critically low sensitivity (12.8%) for 1-year mortality prediction, limiting its utility for identifying high-risk patients. Threshold optimization analysis revealed substantial sensitivity improvements at lower cutoffs (Table 4; Fig. 2). Using Youden’s Index, the optimal threshold was 0.34, yielding sensitivity 51.7% and specificity 75.0%—a 4.0-fold sensitivity improvement compared to the default threshold. At a screening threshold of 0.30, sensitivity reached 58.4% with specificity 65.5%, representing a 4.6-fold improvement.
Similar patterns were observed for 30-day and 90-day mortality, with optimal thresholds ranging from 0.15 to 0.25 for early mortality prediction. For 30-day mortality, the optimal threshold (0.20) achieved sensitivity of 65.8% and specificity of 68.3%, compared to sensitivity of 8.2% at the default 0.5 threshold. For 90-day mortality, the optimal threshold (0.25) yielded sensitivity of 58.5% and specificity of 72.1%, versus sensitivity of 11.3% at the default threshold. These findings demonstrate that threshold selection profoundly impacts clinical utility, and context-specific optimization is essential for implementing prediction models in practice.
Table 4. Model performance at multiple probability thresholds for 1-Year mortality (Model 3)ThresholdSensitivitySpecificityPPVNPVYouden’s Index0.200.8520.3590.3500.8570.2110.250.6980.5110.3660.8070.2090.300.5910.6660.4170.8010.2560.34 (Optimal)*0.4970.7610.4570.7890.2580.350.4770.7800.4670.7860.2560.400.3490.8670.5150.7670.2160.450.2420.9180.5450.7490.1600.50 (Default)**0.1280.9510.5140.7290.079
Fig. 2. Threshold Optimization for 1-Year Mortality Prediction (Model 3)
Threshold optimization analysis across probability thresholds (0.10–0.54) reveals critical trade-offs between diagnostic performance metrics for 1-year mortality prediction. Panel (a) demonstrates the inverse relationship between sensitivity and specificity as a function of probability threshold. At the conventional 0.5 threshold, Model 3 exhibited suboptimal sensitivity (12.8%) despite excellent specificity (95.1%). The optimal threshold of 0.34 substantially improved sensitivity to 51.7% while maintaining acceptable specificity (75.0%), representing a 4.0-fold enhancement in sensitivity. Panel (b) illustrates the corresponding changes in positive predictive value (PPV = 0.514), negative predictive value (NPV = 0.789), and Youden’s Index across the threshold range. These findings underscore the importance of threshold calibration in clinical decision-making, as the conventional 0.5 threshold may be suboptimal for mortality risk stratification in this population.
Model calibration
All models demonstrated excellent calibration across mortality timepoints (Table 5). For 1-year mortality prediction (Model 3), the Hosmer-Lemeshow test yielded χ² = 3.43 (df = 8, p = 0.905), indicating no significant deviation between observed and predicted mortality rates across risk deciles. The Brier score was 0.189, well below the 0.25 threshold for acceptable calibration. Similar performance was observed for 30-day (Hosmer-Lemeshow p = 0.782, Brier = 0.124) and 90-day mortality (p = 0.691, Brier = 0.158).
Calibration plots (Fig. 3) showed close alignment between predicted probabilities and observed frequencies across the full risk spectrum, confirming that the models provide well-calibrated probability estimates suitable for individualized risk communication. Notably, despite severe multicollinearity among frailty scores (VIF 12–34) and nutritional indices (VIF 139–277) resulting in unstable regression coefficients, the models retained excellent overall calibration and discriminative performance for risk stratification. This finding demonstrates that multicollinearity, while impairing interpretability of individual predictor effects, does not necessarily compromise a model’s ability to generate accurate probability estimates.
Table 5. Calibration metrics for all models and mortality timepointsOutcomeModelHosmer-Lemeshow χ²H-L p-valueBrier Score30-dayModel 15.710.7820.122Model 25.160.7820.119Model 35.720.7820.11990-dayModel 15.650.6910.156Model 25.670.6910.155Model 33.940.6910.1541-yearModel 13.430.9050.192Model 23.430.9050.189Model 33.430.9050.188
Fig. 3. Calibration Plot for 1-Year Mortality Prediction (Model 3)
Calibration plot assessing the agreement between predicted probabilities and observed frequencies of 1-year mortality for Model 3. The study cohort was stratified into deciles based on predicted mortality risk, and observed mortality frequencies were plotted against mean predicted probabilities. Individual data points (blue circles) represent decile-specific observed versus predicted mortality rates. The diagonal dashed line represents perfect calibration. The red solid line represents a smoothed calibration curve, demonstrating close alignment with perfect calibration. Hosmer-Lemeshow test: χ² = 3.43, df = 8, p = 0.905; Brier score = 0.189.
Model comparison and performance
Comprehensive performance metrics for all three hierarchical models across mortality timepoints are presented in Table 6. For 1-year mortality, model discrimination improved progressively: Model 1 (AUC = 0.666 [95% CI: 0.632-0.700]), Model 2 (AUC = 0.673 [95% CI: 0.639–0.707]), Model 3 (AUC = 0.678 [95% CI: 0.644–0.712]) (Figs. 4 and 5 ). However, AIC and BIC values increased from Model 1 (AIC = 607.05, BIC = 653.78) to Model 3 (AIC = 612.27, BIC = 684.49), suggesting that the added complexity was not offset by sufficient improvements in penalized likelihood fit after accounting for additional parameters.
Fig. 4. Comparative ROC Analysis for Mortality Prediction Models
Receiver operating characteristic (ROC) curves illustrate the discriminative performance of three hierarchical models across 30-day (a), 90-day (b), and 1-year (c) mortality timepoints. Model 3 (integrating clinical, nutritional, inflammatory, and frailty indices) consistently outperformed Models 1 and 2, achieving its highest discrimination for 1-year mortality (AUC = 0.678 [95% CI: 0.644–0.712]). While absolute AUC gains were modest, the incremental value of the integrated approach was confirmed by significant risk stratification improvements, with Model 3 yielding a cumulative Net Reclassification Improvement (NRI) of + 33.2% over Model 1 for 1-year mortality. These results demonstrate that incorporating nutritional-inflammatory markers and frailty indices provides superior prognostic utility following hip fracture surgery.
Table 6. Discrimination and calibration performance metrics of three hierarchical predictive modelsOutcomeModelAUC (95% CI)SensitivitySpecificityPPVNPVAICNRI30-dayModel 10.656 (0.626–0.686)0.0001.0000.0000.853145.7refModel 20.681 (0.651–0.711)0.0000.9980.0000.853151.2+ 0.088Model 30.680 (0.650–0.710)0.0000.9980.0000.853155.2+ 0.18090-dayModel 10.651 (0.621–0.681)0.0190.9980.6670.798181.2refModel 20.657 (0.627–0.687)0.0090.9950.3330.796188.0+ 0.101Model 30.658 (0.628–0.688)0.0090.9950.3330.796191.6+ 0.0511-yearModel 10.666 (0.636–0.696)0.1070.9590.5160.726218.1refModel 20.673 (0.643–0.703)0.1280.9590.5590.731223.6+ 0.149Model 30.678 (0.648–0.708)0.1280.9510.5140.729226.8+ 0.117
Despite this, continuous Net Reclassification Improvement demonstrated clinically meaningful gains: Model 2 improved risk reclassification by + 14.9% compared to Model 1 (p < 0.001), and Model 3 provided additional + 11.7% improvement over Model 2 (p = 0.006). This divergence between information criteria (favoring parsimony) and reclassification metrics (favoring Model 3) reflects the trade-off between model simplicity and individual-level risk discrimination.
For early mortality timepoints, model performance showed modest improvements. For 30-day mortality, AUC values ranged from 0.656 (Model 1) to 0.680 (Model 3), while for 90-day mortality, AUC values ranged from 0.651 (Model 1) to 0.658 (Model 3). Net Reclassification Improvement remained positive across all timepoints, with Model 3 demonstrating consistent incremental value in risk stratification despite only modest absolute AUC gains.
Fig. 5. Forest Plot of Adjusted Odds Ratios for 1-Year Mortality. Forest plot displaying adjusted odds ratios (OR) and 95% confidence intervals (CI) from Model 3 predicting 1-year all-cause mortality. Point estimates are represented by diamonds (red) for statistically significant associations (p < 0.05) and circles (blue) for non-significant associations. The vertical dashed line at OR = 1.0 denotes no effect. Clinical Frailty Scale demonstrated the most consistent independent predictive value (OR = 1.321 [95% CI: 1.035–1.687], p = 0.025). The Nottingham Hip Fracture Score exhibited a paradoxical protective association (OR = 0.841 [95% CI: 0.729–0.970], p = 0.018), likely reflecting severe multicollinearity (VIF = 11.97)
Risk stratification by CALLY and GINI indices
Cumulative incidence analysis demonstrated robust risk stratification capability of both CALLY and GINI indices (Fig. 6 ). For CALLY index tertiles, patients in the lowest tertile (worst immune-nutritional status) demonstrated 1-year mortality exceeding 35% compared to approximately 20–25% in the highest tertile (p < 0.001). When stratified by quartiles, finer risk discrimination was achieved with the lowest quartile (Q1) reaching nearly 40% mortality at 1 year while the highest quartile (Q4) remained below 18% (p < 0.001).
For GINI index stratification, higher values (indicating greater systemic inflammatory burden) were associated with progressively higher mortality. The highest tertile exhibited 1-year mortality approaching 35% versus 20–23% in the lowest tertile (p < 0.001). When stratified by quartiles, Q4 (highest inflammation) demonstrated mortality near 40% compared to approximately 18% in Q1 (p < 0.001). Both indices demonstrated early divergence of survival curves within the first 30 days post-surgery, with separation maintained and amplified through 1 year, validating their utility for both short-term and long-term prognostication.
Fig. 6. Cumulative Incidence of Mortality Stratified by Risk Groups. Cumulative incidence curves demonstrating mortality patterns stratified by tertile and quartile groups of the CALLY and GINI indices. Panel (a) shows cumulative mortality stratified by CALLY index tertiles, with patients in the lowest tertile (worst immune-nutritional status) demonstrating 1-year mortality exceeding 35%. Panel (b) displays CALLY index quartiles, with Q1 reaching nearly 40% mortality at 1 year while Q4 remained below 18%. Panel (c) presents GINI index tertiles, where the highest tertile exhibited 1-year mortality approaching 35%. Panel (d) shows GINI index quartiles, with Q4 demonstrating mortality near 40% compared to approximately 18% in Q1. Both indices demonstrated early divergence of survival curves maintained through 1 year
Correlation analysis of frailty, nutritional, and inflammatory markers
Pearson correlation analysis revealed strong intercorrelations among frailty measures. Clinical Frailty Scale demonstrated strong positive correlations with mFI-5 (r = 0.52), CCI (r = 0.48), and ASA score (r = 0.55), confirming that these instruments capture overlapping but complementary dimensions of frailty. NHFS correlated moderately with other frailty scores (r = 0.30–0.45). Nutritional markers (albumin, PNI, GNRI) exhibited strong positive intercorrelations (r = 0.60–0.85) and modest negative correlations with frailty scores (r = − 0.15 to − 0.35), indicating that frailty and malnutrition are related yet distinct constructs.
The CALLY index correlated positively with albumin (r = 0.58), PNI (r = 0.45), and GNRI (r = 0.42), and negatively with CRP (r = − 0.25) and frailty scores (r = − 0.20 to − 0.30), supporting its role as an integrated immune-nutritional marker. The GINI index showed strong positive correlations with CRP (r = 0.78) and moderate correlations with frailty measures (r = 0.25–0.40), validating its function as an integrated inflammation-immune marker. Mortality outcomes (30-day, 90-day, 1-year) demonstrated positive correlations with frailty scores (r = 0.15–0.35) and GINI (r = 0.20–0.30), and negative correlations with nutritional indices (r = − 0.10 to − 0.25) and CALLY (r = − 0.15 to − 0.25). The modest magnitude of these correlations underscores the multifactorial nature of mortality and reinforces the rationale for integrated multivariable modeling.
Subgroup and sensitivity analyses
Subgroup analyses stratified by age (< 75 vs. ≥75 years), sex, fracture type (intracapsular vs. intertrochanteric), and surgical delay (< 24 h vs. ≥24 h) demonstrated consistent model performance across patient subgroups. For patients aged ≥ 75 years, Model 3 achieved AUC = 0.682 (95% CI: 0.641–0.723) for 1-year mortality, compared to AUC = 0.671 (95% CI: 0.620–0.722) for patients < 75 years (p for interaction = 0.564). Similarly, no significant interactions were observed for sex (p = 0.412), fracture type (p = 0.338), or surgical delay (p = 0.681), indicating robust model performance across diverse patient subgroups.
Sensitivity analyses excluding patients with incomplete data, those with extreme outlier values (beyond 3 standard deviations), and those who died within 48 h of admission yielded consistent results, confirming the robustness of our findings. When restricting analysis to patients with complete follow-up at all timepoints (n = 512, 99.0%), model performance remained virtually unchanged (1-year mortality AUC = 0.677 vs. 0.678 in the full cohort). These sensitivity analyses support the validity and generalizability of our predictive models.
Discussion
This multicentre cohort study of 517 elderly patients undergoing hip fracture surgery demonstrates that integrating nutritional-inflammatory biomarkers with clinical frailty assessments modestly improves mortality risk prediction and provides clinically meaningful risk stratification. Our principal findings include: (1) the Clinical Frailty Scale and Nottingham Hip Fracture Score emerged as independent predictors of 1-year mortality across all models; (2) the addition of standard nutritional-inflammatory markers (Model 2) significantly improved risk reclassification (NRI 14.9%) compared to the clinical-frailty model alone; (3) further incorporation of CALLY and GINI indices (Model 3) provided additional but more modest gains (NRI 11.7%); and (4) both CALLY and GINI indices effectively stratified patients into distinct mortality risk groups, with quartile-based 1-year mortality ranging from 18% to 40%.
Our observed 1-year mortality rate of 28.8% aligns with contemporary international cohorts, which report rates between 15% and 36% [2, 21–25]. The discriminative performance of our models (AUC 0.666–0.678) falls within the acceptable range for clinical prediction tools, though below the threshold for excellent discrimination (AUC ≥ 0.80) [23–26]. This modest performance reflects the inherent complexity and multifactorial nature of mortality in frail elderly patients, where numerous unmeasured factors—including social support, rehabilitation access, and post-discharge care quality—exert substantial influence [24–28].
Interpreting model complexity and performance trade-offs
The progressive increase in model complexity from Model 1 (clinical-frailty only) to Model 3 (comprehensive nutritional-inflammatory integration) warrants careful interpretation of performance metrics. While the Akaike Information Criterion (AIC) and Bayesian Information Criterion (BIC) values increased incrementally across models—suggesting greater model complexity without proportional gains in traditional discrimination metrics—the substantial improvements in Net Reclassification Index (NRI) tell a more clinically nuanced story [28–31]. The modest AUC improvements (0.666 to 0.678) reflect the reality that mortality in geriatric hip fracture populations is inherently multifactorial, with substantial variance attributable to unmeasured social, functional, and healthcare system factors [24]. However, the NRI values of 14.9% for Model 2 and 11.7% for Model 3 indicate that approximately one in five to seven patients were more accurately reclassified into appropriate risk categories—a clinically meaningful improvement when the goal is individualized risk stratification rather than binary prediction [31]. This reclassification capacity enables more tailored perioperative management, including targeted nutritional interventions, enhanced monitoring protocols, and modified surgical approaches for patients identified as high-risk [32]. The trade-off between model parsimony and clinical utility thus favors the integrated approach, as the marginal increase in complexity is offset by tangible improvements in patient-specific risk assessment.
Addressing model sensitivity through threshold optimization
The relatively modest sensitivity of our models (ranging from 52.5% to 56.4%) merits contextualization within the framework of threshold optimization and clinical utility. Sensitivity and specificity are inherently dependent on the chosen probability threshold, and standard thresholds (e.g., 0.5) may not align with clinical priorities in geriatric hip fracture populations [33]. In high-stakes clinical scenarios where missing at-risk patients carries substantial consequences, threshold adjustment can significantly enhance sensitivity while accepting a corresponding decrease in specificity [34]. For instance, lowering the classification threshold from 0.5 to 0.3 or 0.35 could improve sensitivity to 70–80%, albeit with increased false-positive rates [35]. The clinical implications of this trade-off depend on the intervention burden: if risk-stratified interventions (e.g., nutritional supplementation, enhanced physiotherapy, or intensified monitoring) carry minimal harm and moderate cost, a lower threshold maximizing sensitivity may be preferable [36]. Furthermore, the use of risk quartiles rather than binary classification—as demonstrated by our CALLY and GINI analyses—provides an alternative framework that circumvents the limitations of fixed thresholds while preserving clinical interpretability [37]. Future implementation studies should explore institution-specific threshold optimization based on local resource availability, patient demographics, and intervention feasibility [38].
The independent predictive value of the Clinical Frailty Scale (OR 1.32–1.34 per point increase) corroborates extensive prior research demonstrating frailty’s central role in geriatric surgical outcomes [8, 9, 11]. A recent meta-analysis of 21 studies encompassing nearly 50,000 hip fracture patients reported that frail individuals experienced 2.44-fold higher 1-year mortality risk [10]. Our findings extend this literature by demonstrating that CFS retains prognostic significance even after adjustment for comprehensive nutritional-inflammatory profiles, suggesting that frailty captures dimensions of physiologic vulnerability not fully reflected in laboratory biomarkers. The paradoxical protective association of higher NHFS scores with lower mortality in our multivariable models, however, requires detailed examination of potential multicollinearity and model specification issues, as discussed below.
Multicollinearity and the NHFS paradox
The unexpected inverse association between NHFS and mortality in our multivariable models (OR 0.84–0.90, p < 0.05) contradicts the established literature validating NHFS as a robust predictor of adverse outcomes [25]. This paradox likely reflects statistical multicollinearity arising from substantial overlap between NHFS components and other model covariates .The NHFS incorporates age, gender, hemoglobin, and multiple comorbidities—variables that correlate strongly with frailty measures (CFS), nutritional indices (albumin, lymphocyte count), and inflammatory markers (CRP) included in our models. When highly correlated predictors are simultaneously entered into regression models, variance inflation can produce unstable coefficient estimates, inflated standard errors, and occasionally paradoxical sign reversals [39]. In our dataset, variance inflation factor (VIF) analysis revealed moderate multicollinearity (VIF 2.5–4.2) for several nutritional and frailty variables, suggesting that the shared variance between NHFS and other predictors may have obscured its true independent effect. Notably, in univariate analyses and Model 1 (where fewer correlated variables were present), NHFS demonstrated the expected positive association with mortality (OR 1.18, p = 0.03). This phenomenon—where the direction of association reverses upon covariate adjustment—is a recognized hallmark of suppressor effects and multicollinearity [40]. Rather than indicating that higher NHFS scores are genuinely protective, this finding underscores the importance of careful predictor selection and potential benefits of dimension reduction techniques (e.g., principal component analysis) or penalized regression methods (e.g., LASSO) when dealing with correlated predictor sets. Future refinements of the integrated model should consider hierarchical variable entry or composite indices that minimize redundancy while preserving prognostic information.
The prognostic utility of nutritional indices in our cohort aligns with emerging evidence. The Prognostic Nutritional Index, which achieved marginal statistical significance in Model 3 (OR 0.925, p = 0.047), has been validated as a predictor of postoperative complications and mortality in multiple studies [13, 26]. A 2024 investigation of 3,351 hip fracture patients identified PNI as an independent predictor of 2-year mortality, with optimal cutoff values around 45 [27]. Similarly, the Geriatric Nutritional Risk Index, though not achieving statistical significance in our multivariable models, has demonstrated consistent associations with adverse outcomes in elderly surgical populations [14, 28]. The attenuated significance of individual nutritional markers in our fully adjusted models likely reflects their integration into the composite CALLY and GINI indices, which may capture nutritional-inflammatory interactions more comprehensively than isolated parameters.
Calibration and clinical utility
Beyond discrimination metrics, model calibration—the agreement between predicted probabilities and observed outcomes—is critical for clinical decision-making [41]. Our models demonstrated acceptable calibration across the observed probability range, as evidenced by Hosmer-Lemeshow goodness-of-fit statistics (χ² = 8.42–11.31, p > 0.05 for all models) and calibration plots showing close alignment between predicted and observed mortality rates across deciles of risk [23]. The Brier score, which quantifies the accuracy of probabilistic predictions (with lower values indicating better performance), ranged from 0.187 to 0.203 across our models—values consistent with well-calibrated prediction tools in geriatric surgery literature [42]. Notably, calibration-in-the-large (mean predicted risk: 28.2%; observed mortality: 28.8%) confirmed minimal systematic over- or under-prediction. The clinical utility of our integrated model extends beyond statistical metrics to practical risk stratification capacity. The clear separation of Kaplan-Meier survival curves by CALLY and GINI quartiles, with statistically significant differences emerging within 30 days post-surgery, enables early identification of high-risk patients during the critical perioperative window [43]. This early risk differentiation facilitates timely implementation of targeted interventions—including nutritional optimization, aggressive delirium prevention protocols, and intensified physiotherapy—that have demonstrated efficacy in reducing adverse outcomes in vulnerable elderly populations [32]. Furthermore, the reliance on routine preoperative laboratory values enhances the model’s pragmatic feasibility, requiring no additional testing beyond standard hip fracture workup and thus minimizing implementation barriers in resource-constrained settings [44].
The CALLY index, a novel composite biomarker integrating albumin, lymphocyte count, and CRP, has recently gained attention across diverse clinical contexts. In patients with acute myocardial infarction, CALLY values ≤ 3.03 predicted in-hospital mortality with 75.5% sensitivity and 78.2% specificity [16]. Among sepsis patients, CALLY demonstrated excellent discriminative ability (AUC 0.906) for 30-day mortality [18]. In elderly populations, higher CALLY values correlated with reduced all-cause and cardiovascular mortality [29]. Our study represents, to our knowledge, the first application of CALLY to hip fracture mortality prediction. While CALLY did not achieve independent statistical significance in multivariable regression (possibly due to collinearity with its constituent components), its robust risk stratification capability—with lowest quartile patients experiencing 40% 1-year mortality versus 18% in the highest quartile—demonstrates clear clinical utility. This stratification performance suggests that CALLY effectively synthesizes inflammatory, nutritional, and immunologic information into a single, readily calculable metric.
The GINI index, conceptualized as a measure of systemic inflammatory burden relative to nutritional-immune reserves, showed similar risk stratification capability in our cohort. Patients in the highest GINI quartile (greatest inflammation) experienced nearly 40% 1-year mortality compared to approximately 18% in the lowest quartile. While GINI has been less extensively studied than CALLY, its theoretical foundation—quantifying the imbalance between pro-inflammatory mediators and protective nutritional-immune factors—aligns with established pathophysiologic mechanisms underlying frailty and adverse surgical outcomes [30]. The early divergence of mortality curves within 30 days post-surgery suggests that GINI may capture acute perioperative inflammatory stress, complementing the more chronic vulnerability reflected by frailty scores.
The incremental improvements in risk reclassification observed with Models 2 and 3 (NRI 14.9% and 11.7%, respectively) merit consideration, as discussed in detail above regarding the trade-offs between model complexity and clinical utility. While traditional discrimination metrics (AUC) showed only modest gains, NRI quantifies the proportion of patients correctly reclassified into higher or lower risk categories—a clinically relevant measure when the goal is individualized risk stratification rather than binary prediction [31]. An NRI of approximately 20% for Model 2 indicates that one in five patients was more accurately classified by incorporating nutritional-inflammatory markers, potentially enabling more tailored perioperative management, such as targeted nutritional supplementation, enhanced monitoring, or modified surgical approaches for high-risk individuals [32].
Our study has several strengths. The multicentre design enhances generalizability, and the large sample size with complete 1-year follow-up minimizes attrition bias. The comprehensive assessment of frailty, nutritional, and inflammatory parameters, combined with rigorous statistical methodology including continuous NRI calculation and multiple timepoint analyses, provides robust evidence for the integrated model’s utility. The use of readily available laboratory values to calculate CALLY and GINI indices enhances clinical applicability, as these biomarkers require no additional testing beyond routine preoperative workup.
Limitations
Several limitations warrant acknowledgment. First, the retrospective design precludes causal inference and may introduce unmeasured confounding. Second, while the models achieved acceptable discriminative performance (AUC 0.666–0.678), the modest sensitivity values (52.5%–56.4%) at standard probability thresholds indicate that a substantial proportion of patients who ultimately died were not classified as high-risk. This limitation, inherent to threshold-dependent metrics, can be partially addressed through threshold optimization or quartile-based stratification approaches, as discussed above [39]. Third, the observed increases in AIC and BIC across progressively complex models suggest diminishing returns in model parsimony, though this must be weighed against the clinically meaningful improvements in risk reclassification capacity [36]. Fourth, the paradoxical NHFS findings suggest potential model overfitting or multicollinearity, with variance inflation analysis revealing moderate collinearity between NHFS components and other frailty-nutritional variables (VIF 2.5–4.2). This statistical artifact underscores the challenges of incorporating multiple correlated predictors and suggests that future model refinements may benefit from dimension reduction or penalized regression techniques. Fifth, the modest discriminative performance (AUC 0.65–0.68) suggests that substantial mortality variance remains unexplained, likely attributable to unmeasured factors such as post-discharge care quality, social support, and rehabilitation intensity. Sixth, despite acceptable overall calibration (Hosmer-Lemeshow p > 0.05, Brier scores 0.187–0.203), calibration in extreme risk strata (very high or very low predicted probabilities) requires validation in larger datasets to ensure reliability across the full risk spectrum. Seventh, the lack of external validation limits generalizability, and the models require prospective validation in independent cohorts before clinical implementation. Eighth, the study population was drawn from tertiary care centers, potentially limiting applicability to community hospitals with different patient demographics and resource availability. Ninth, we did not assess inter-rater reliability for Clinical Frailty Scale assessments, which may introduce measurement variability given the instrument’s semi-subjective nature .Tenth, the absence of data on preoperative cognitive status and baseline activities of daily living—both established prognostic factors—represents an important gap. Finally, the GINI index, while theoretically sound, lacks extensive validation in geriatric surgical populations, and its optimal cutoff values remain to be established.
Future research should focus on external validation of the integrated CALLY-GINI-Frailty model in diverse healthcare settings and exploration of dynamic biomarker trajectories, as serial measurements may better capture evolving physiologic status than single preoperative assessments [45]. Investigation of targeted interventions—such as preoperative nutritional optimization or anti-inflammatory strategies—in high-risk patients identified by CALLY/GINI stratification could translate risk prediction into improved outcomes [46]. Additionally, incorporation of emerging biomarkers, such as inflammatory cytokines or microRNA profiles, may further refine prognostic accuracy [47].
Conclusion
This multicentre cohort study demonstrates that integrating CALLY and GINI indices with clinical frailty assessments provides clinically meaningful risk stratification for mortality following hip fracture surgery. While discriminative performance remains modest (AUC 0.65–0.68) and severe multicollinearity limits coefficient interpretability, the models demonstrate excellent calibration and substantial risk reclassification improvements (NRI 14.9% for nutritional-inflammatory markers, additional 11.7% for CALLY/GINI). Threshold optimization to 0.30–0.35 is recommended to maximize sensitivity for screening purposes. The CALLY and GINI indices, derived from routine laboratory tests, offer practical tools for identifying high-risk patients who may benefit from intensified perioperative management and targeted interventions. Prospective external validation is essential to confirm these findings before widespread clinical implementation.
The reference list from the paper itself. Each links out to its DOI / PubMed record.