Isolation and characterization of microplastics from human blood samples by confocal RAMAN microscopy
Antonio José Sarabia, Belén Martínez, María de los Ángeles Martínez, Ricardo Rivera, María Isabel Torres, Antonio Peñas, Jorge Nicolás Domínguez

TL;DR
This paper introduces a reliable method using confocal Raman microscopy to detect and identify microplastics in human blood while minimizing contamination risks.
Contribution
A contamination-controlled, reproducible protocol for microplastic detection in human blood using confocal Raman microscopy and open-source spectral analysis.
Findings
Microplastics like polystyrene, EVA, and polyethylene were detected in human blood samples.
The method demonstrated high specificity and reliability in identifying microplastics.
Contamination sources were traced using reference materials and controls.
Abstract
Microplastics (MPs) and nanoplastics (NPs) are emerging environmental contaminants increasingly detected in human tissues and fluids, highlighting the need for reliable analytical methods capable of isolating and characterizing these particles in complex biological matrices while reducing contamination risks. This work presents a systematic, integrative, and reproducible protocol for detecting MPs in human blood using confocal Raman microscopy. The method incorporates strict contamination-control measures, includes negative and positive controls to ensure analytical reliability, and provides reference Raman spectra from commonly used clinical and laboratory materials to identify potential sources of cross-contamination. Spectral data are compared using the open-source platform Open Specy, enabling similarity matching with an extensive polymer database and improving the confidence of…
Genes, proteins, chemicals, diseases, species, mutations and cell lines named across the full text — each resolved to its canonical identifier and authoritative record.
Click any figure to enlarge with its caption.
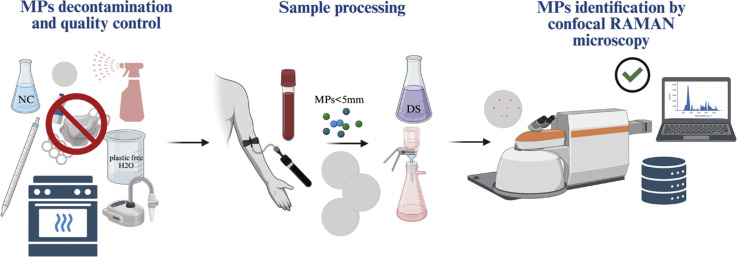 Figure 1
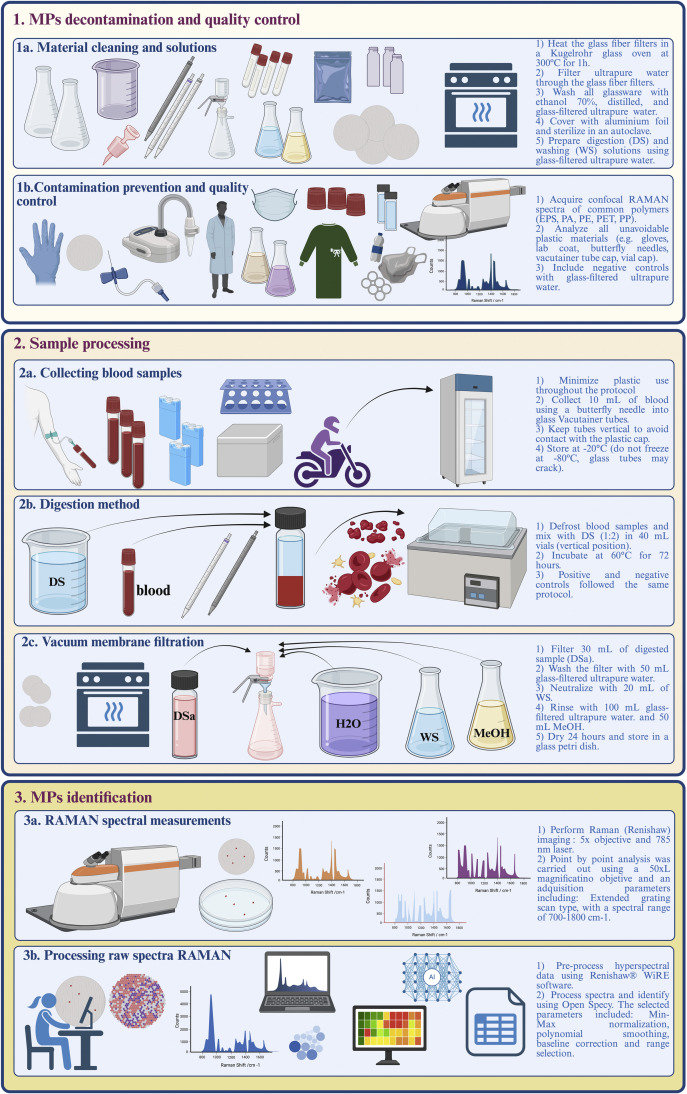 Figure 2
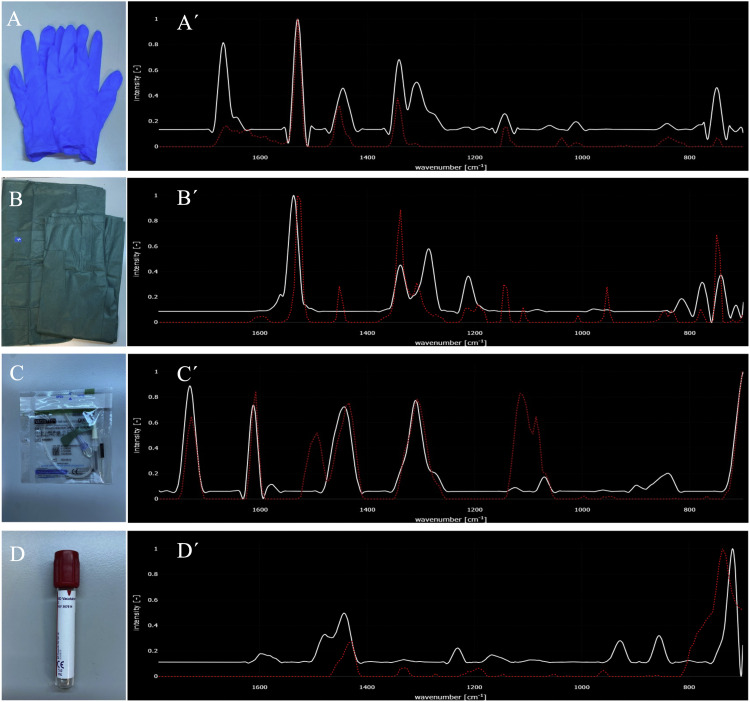 Figure 3
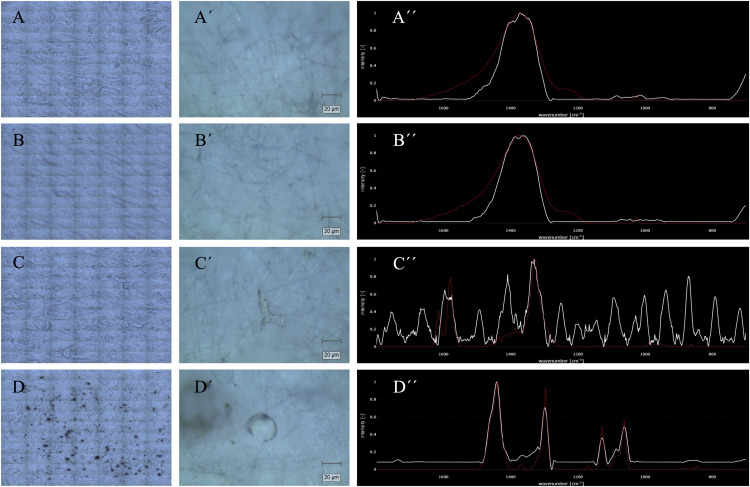 Figure 4
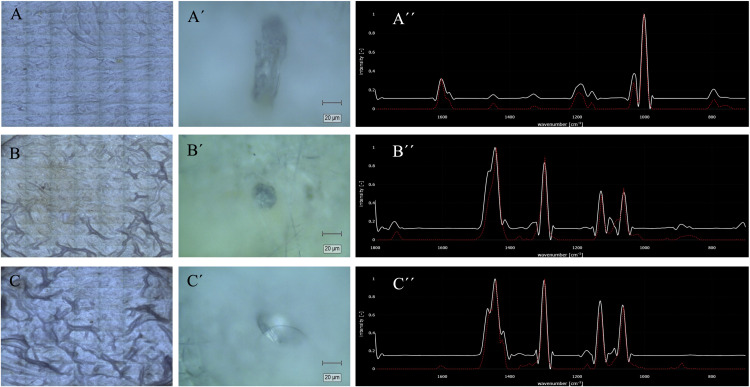 Figure 5
Peer Reviews
No public reviews on file for this paper yet. If you reviewed it on a platform where reviews are public (OpenReview, ICLR, NeurIPS, ICML), you can paste yours below so the community can read it here.
Videos
No videos yet. Explain this paper in a talk, walkthrough, or lecture? Add one.
Taxonomy
TopicsMicroplastics and Plastic Pollution · Nanoparticles: synthesis and applications · Marine Biology and Environmental Chemistry
Specifications table Subject areaChemistryMore specific subject areaRaman spectroscopy applications in biomedical researchName of your protocolThree-steps protocol for MPs identification in human bloodReagents/tools1. Ethanol 70 %2. Distilled water3. Ultrapure water (glass filtered)4. Potassium hydroxide (KOH, 10 %)5. Tween-20 (Polysorbate-20, 1 %)6. Nitric acid (HNO_3_, 67 %)7. Methanol (MeOH)8. Glass fiber filter membranes (diameter 25mm, nominal pore size (∼1.6µm), Whatman; WHA1820025)9. Kugelrohr glass oven (BUCHI 046600)10. Glass Petri dishes11. Glass flask12. Glass beakers13. 15- and 40-mL glass vials14. Glass pipettes15. Stainless steel forceps16. Aluminium foil17. Environmental aspirator (LSRFXF)18. Cotton lab coats19. Double sided adhesive tape20. Glass Petri dishes21. Standard commercial polyethylene22. Raman inVia de Renishaw23. Open Specy free platformExperimental designHuman blood samples were collected under contamination-controlled conditions, digested and filtered to isolate retained particles, and subsequently analyzed by confocal Raman microscopy using Open Specy for polymer identification.Trial registrationNot applicableEthicsAll human blood samples were obtained from voluntary donors after written informed consent. The study was conducted in accordance with the Declaration of Helsinki and approved by the appropriate institutional ethics committee.Value of the Protocol- Provides a standardized workflow for isolating and characterizing microplastics (MPs) in human blood, from sample collection to Raman-based identification.- Minimizes contamination risks through integrated decontamination and quality control steps, ensuring more reliable and reproducible results.- Offers a simple and cost-effective**approach that can be widely adopted to support future biomedical and environmental health studies.
Background
Global plastic production has increased from 1.5 million tons to approximately 359 million tons in the last 70 years [1], and it is expected to reach 500 million tons by 2025 [2]. Forward-looking analyses indicate that under current trends, production may exceed 1 billion tons annually by 2050, highlighting the increasing environmental burden of plastics and associated microplastics [3]. However, no >10 % of plastic waste is recycled [4], and most of the waste is incinerated, disposed of in landfills, or directly discharged into the environment, becoming a major source of microplastics (MPs) and nanoplastics (NPs) [5].
MPs and NPs are plastic particles smaller than 5 mm and 1 μm in diameter, respectively [6,7]. They have raised increasing concern due to their omnipresence in the environment and their potential impacts on human health, becoming a significant environmental issue in recent decades. These particles, derived from the degradation of larger plastic products such as tire wear, textile fibers, and personal care products, have been identified in virtually all ecosystems, from oceans to agricultural soils, freshwater systems, and even the air we breathe [6,8]. Due to their low density, MPs and NPs can be transported between terrestrial and aquatic ecosystems by wind and water currents, facilitating global dispersal. Consequently, MPs and NPs may enter the human body through ingestion, inhalation, and dermal contact, mainly via contaminated water, seafood, and other food sources, with potential accumulation in biological tissues and associated health risks [9].
The most common forms of plastics are resins and fibers, including polyethylene (PE), polypropylene (PP), polystyrene (PS), polyvinyl chloride (PVC), polyethylene terephthalate (PET), and polyurethane (PUR) resins, along with polyester, polyamide, and acrylic (PP&A) fibers [10,11]. Once released, MPs and NPs can be transported over long distances by water currents and wind, facilitating their global dispersal [12]. This widespread distribution facilitates their entry into aquatic ecosystems, raising serious questions about their impacts on biodiversity and the health of living organisms [13].
In line with this, MPs and NPs represent a growing threat with potential repercussions throughout the food chain [14] and, consequently, a negative impact on human health [15]. Human exposure to MPs and NPs occurs mainly through ingestion, inhalation, and dermal contact, leading to their accumulation in various organs, tissues, and body fluids [16,17]. These particles have been detected in human liver, kidneys, brain, lungs, heart, spleen, and placenta, suggesting their ability to infiltrate and persist in vital systems [[18], [19], [20]]. Evidence indicates that MPs and NPs can induce oxidative stress, inflammation, and endocrine disruption [17,21,22], while available evidence in humans, still limited and largely observational, includes associations with respiratory, digestive and nervous alterations [23], as well as recent clinical observations linking the presence of MPs in atherosclerotic plaques with an increased risk of cardiovascular events, including myocardial infarction and ischemic stroke [24,25].
Given this evidence of human exposure and potential health risks, the isolation and analysis of MPs and NPs in human biological samples is of particular interest. Although some studies have described methods to isolate MPs and NPs from tissues [19,[26], [27], [28]] or human blood using enzymatic, acidic, or alkaline digestion [[29], [30], [31]], there is still a lack of a straightforward, cost-effective, and reproducible protocol that minimizes contamination and covers the entire process, from sample collection to MPs identification. This study presents a systematic and integrative protocol for the isolation and characterization of MPs from human blood samples using confocal Raman microscopy. This method incorporates practical steps and technical recommendations to reduce plastic contamination in the surrounding environment, while preserving the structural integrity of MPs. This approach is integrated into a three-step protocol that enhances clarity and reproducibility: 1) MPs decontamination and quality control, 2) Sample processing and, 3) MPs identification**.** For practical use, a detailed workflow diagram is provided (Fig. 1) that summarizes the procedure.Fig. 1. Workflow of the three-step protocol for isolating and analyzing microplastics (MPs) from human blood samples.The workflow comprises: (1) MP decontamination and quality control, including (1a) material cleaning and solution preparation and (1b) contamination prevention and quality control; (2) sample processing, including (2a) blood collection, (2b) digestion, and (2c) vacuum membrane filtration; and (3) MP identification, consisting of (3a) Raman spectral measurements and (3b) processing of raw Raman spectra.Fig 1 dummy alt text
Description of protocol
Blood samples were collected at the Intensive Care Unit of the Hospital Universitario de Jaén, Jaén (Spain) in accordance with the Helsinki guidelines, ensuring proper human care and ethical standards. Research permits were obtained from Universidad de Jaén Ethics Committee (license code: CIOMGAB_20221121bis) and Provincial Research Ethics Committee of Jaén (license code: SICEIA-2025–000070). Written informed consent was obtained from all subjects before blood sampling.
1. MPs decontamination and quality control
1a. Material cleaning and solutions
- Glass fiber filter membranes (diameter 25 mm, nominal pore size (∼1.6 µm), Whatman; WHA1820025) were pre-treated at 300 °C for 1 h using a Kugelrohr glass oven under vacuum (Model BUCHI 046600). The vacuum environment facilitates the decomposition and removal of polymer-derived contaminants while avoiding thermo-oxidative carbonization, and additionally minimizes exposure to ambient MPs contamination by eliminating the need for carrier gases.
Note: After heating, store the filters on a clean glass Petri dish (all in the same orientation), ready for use.
-
Filter ultrapure water by using the glass fiber filter membrane.
-
All material (flasks, glass Petri dish, beakers, 15- and 40-ml glass vials, glass pipettes, forceps) was cleaned before and after any practice following the next step:
-
1First, wash with running water and a small amount of ethanol 70 %.
-
2Rinse with distilled water.
-
3Rinse with glass-filtered water.
-
4Finally, cover glass material with aluminium foil and sterilize them in an autoclave.
-
All solutions used in the protocol were made with glass-filtered water and filtered by a glass filter.
Note: This process removes any microplastics contamination from all materials.
1b Contamination prevention and quality control
To minimize the risk of plastic cross-contamination, the use of plastic materials was reduced as much as possible at every step of this protocol. The only stage where blood was in contact with some plastic surface, for a short period of time, was during extraction. This was due to the use of plastic vacuette safety butterfly needles (21Gx19cm + luer adapter, sterile; Greiner KG450081), which are the only approved devices for blood collection (Fig. 2). Additionally, a small aspirator (LSRFXF) was used to help reduce contamination from suspended particles in the environment. To further minimize airborne microplastic contamination, all procedures were carried out under controlled laboratory conditions, ensuring that the workspace remained free of synthetic fibers by using cotton laboratory coats and by routinely cleaning surfaces before sample handling.Fig. 2. Confocal Raman analysis of potential contamination sources.(A) Nitrile gloves (polyhaloolefin, PE and PP), (B) clinical clothing (polypropylene, PP), (C) butterfly needle cannula (polyhaloolefin, PE and PP), and (D) Vacutainer glass tube cap (polytetrafluoroethylene, PTFE). Panels A′–D′ display the Raman spectra obtained for each material, compared with reference spectra from Open Specy, a free online platform for spectral analysis. Additional laboratory items analyzed, together with their polymer identification, are summarized in Table 1. These spectra were used as reference controls to identify and account for potential cross-contamination during sample collection and processing.Fig 2 dummy alt text
Furthermore, all instances, both in hospital and laboratory settings, where the use of plastic materials was unavoidable were taken into account. Accordingly, every plastic material used at any stage of the protocol was analysed to obtain confocal-Raman spectra (Fig. 2; Table 1).Table 1. Identification of polymers in common laboratory items using Raman spectroscopy and analysis with Open Specy, a free online platform for spectral comparison. The table lists the items tested and their corresponding polymer types. Note that the laboratory coat used during the protocol is described in the Reagents/Tools section (100 % cotton lab coat), whereas the PET laboratory coat listed here represents a common laboratory garment included as a potential source of environmental contamination.Table 1 dummy alt textLaboratory itemsIdentified polymer (Open Specy)Similarity %Lab coatPolyethylene terephthalate (PET)97Clinical pyjamaPolypropylene (PP)54Nitrile glovesPolyolefin (PE and PP)76Latex glovesPolydiene (butadiene, isoprene)95Butterfly needlePolyolefin (PE and PP)73Vacutainer tube capPolytetrafluoroethylene (PTFE)52Bottle of KOH pelletsPolyethylene (PE)96Inner plastic of the filter boxPolystyrene (PS)96Double sided adhesive tapePolypropylene (PP)91Inner part of the vials capPolydimethylsiloxane (PDMS)98
2. Sample processing
2a. Collecting blood samples
- −Disinfect the area before proceeding with venipuncture.
- −Collect 10 ml of blood into two 5 mL glass Vacutainer tubes (BD Vacutainer 367614), with a vacuette safety butterfly needle (21Gx19 cm + luer adapter, sterile; Greiner KG450081).
- −Keep the glass tubes, containing blood, in a vertical position to prevent contact between blood and the plastic cap, and store at 4 °C during transport to the laboratory.
Note: Blood collecting should be performed by clinical staff.
- Transfer the glass vacutainer tube containing the blood sample as soon as possible into a 15 mL vial and store it in a freezer at −20 °C until the next step.
Note: Glass Vacutainer tubes do not resist low temperature and glass will fissure. In case the Vacutainer tube breaks, the vial will still contain the blood during the defrost process.
2b Digestion method
- −Prepare the digestion solution (DS): 10 % KOH+1 % Tween-20.
- −Defrost the 15 mL vials containing the glass Vacutainer tube, in which blood is stored.
Note: DS ensures effective tissue digestion while minimizing physical or chemical degradation of the most common MPs (PE, PP, PS). It is also important to measure the initial blood volume, as this allows the results to be expressed as the number of particles per milliliter of blood.
- −Add 2 vol of DS for each 1 vol of blood (e.g., 20 mL DS; 10 mL blood) in 40 mL vials.
- −Keep the tubes in a vertical position and incubate in a bath at 60 °C for 72 h. No shaking is required.
Note: Avoid covering the tubes with aluminium foil; aluminium foil is highly reactive with bases. Silicone is not affected by DS.
2c.Vacuum membrane filtration
- −Assemble the glass fiber filter (previous decontamination) before filtration.
- −Filter the digested biological sample (30 mL).
Note: After filtration, all volume of the sample is discarded.
- −Wash the glass fiber filter membrane with 50 mL of glass-filtered water.
- −Neutralize the glass filter (without vacuum) with 20 mL of wash solution (WS) (67 % HNO_3_ + 1 % Tween-20).
Note: This step was performed without vacuum to enhance the neutralization reaction. It is important to prepare WS at the time of use.
- −Wash it with glass-filtered water (100 mL).
- −Dehydrate the filter with MeOH (50 mL).
- −Dry it at room temperature for 24 h.
Note: Once the filter is dry, keep the membrane covered in a glass Petri dish until analysis by confocal-RAMAN.
3. MPs identification
3a. RAMAN spectral measurements
- Set up the filter on the top lid and stick it using double-sided adhesive tape. Finally cover it with the bottom lid.
Note: This is due to the bottom lid hit with the 50xL Raman objective.
- Make a mark on the edge of the filter to indicate its orientation to facilitate subsequent analysis.
Note: Avoid labelling with marker, pencil or pen
-
Prepare equipment:
-
1Turn on the computer and the 785 nm laser.
-
2Open the WiRE software and confirm that the laser is associated with the correct monochromator (1200I/mm).
-
Place and focus the sample:
-
1Press the “Door Release” button before opening the microscope door.
-
2Place the filter (with the bottom lid) in the microscope stage.
-
3Active the camera icon to visualize the filter
-
4Select the 5x objective lens both on the microscope and in the WiRE software.
-
5Focus manually to view clearly the surface of the filter.
-
6In the “Live Video” window, select “Set Origin” to set the centre of the filter as the (0,0) coordinate.
-
Filter Image Acquisition:
-
1In the “Live video” window, select “Snap → Montage”.
-
2Define manually the limits by entering (−6000, 6000) for both X and Y axes.
-
3Close the microscope door and press “Run” to capture the image.
-
4Save it.
-
Particle Image Acquisition:
-
1In the “Live video” window, select “Snap → Single”.
-
2Save it.
Note: Raman microspectroscopic imaging was performed through a Renishaw Centrus 24QW69 detector and a 5x magnification objective.
-
Laser Calibration:
-
1After the laser has warmed up for 10 min, go to “Tools Quick Calibration”.
-
2Confirm that a peak appears at 520 nm with an intensity of approximately 30,000 counts.
-
3Close the calibration window.
-
Point by point analysis:
-
1Lower the stage using the coarse focus knob, without moving the sample.
-
2Switch to the 50xL objective on both the microscope and the WiRE software.
Note: The 50xL magnification objective indicates a long working distance (“L”).
- 3Locate the particle of interest and focus it.
- 4Capture an image of the particle before the measurement. Go to “Live Video” → “Save Image”.
Note: Optionally, acquire a photo after the measurement to evaluate whether laser-induced changes occurred in the analysed particle.
- 5In Measurements, click New → Spectral Acquisition. Acquisition parameters:
- •Grating scan type: Extended
- •Spectral range: 700–1800 cm⁻¹
- •Exposure time: 10 s (mandatory for Extended mode)
- •Laser power: 0.1–1 %
- •Accumulations: 5–20 Note: Adjust acquisition parameters (exposure time, laser power, accumulations) based on the particle’s properties. Especially if the signal is low or the particle shows signs of degradation.
- 6Press the RUN button.
- 7Selection of random points for analysis:
- •Divide the filter into 4 quadrants.
- •Coordinates were randomly generated using an AI tool.
- •If there is no visible particle at a chosen point, define a consistent method to select the nearest one.
Note: The analysis was designed to target and characterize random particles. To minimize the risk of potential photo-damage to the sample, an appropriate ratio between laser power and exposure time was ensured.
3b Processing raw spectra RAMAN
Raman spectroscopic analysis was performed to identify polymer particles using the open-source platform Open Specy [32], which compares experimental Raman spectra with a comprehensive plastic database.
The analysis was carried out under the following standardized parameters:
Pre-processing:
- 1Min–Max normalization
- 2Smoothing with a 5th order polynomial (28)
- 3Derivative function: disabled (set to 0)
- 4Wavenumber window: 50 cm⁻¹
- 5Baseline correction: polynomial order 5 with 25 iterations
- 6Spectral range: 700–1800 cm⁻¹
Spectral identification:
- 1Spectrum type: Raman
- 2Transformation: no baseline
- 3Identification method: Full (search across the complete library)
- 4Correlation threshold: 0.7
These parameters allowed the reliable identification of several common polymers present in the analyzed samples.
Protocol validation
Using the proposed protocol, MPs were successfully isolated and analysed from human blood samples collected in a clinical setting. To assess potential sources of cross-contamination, several laboratory materials commonly used during sample collection and handling were tested by confocal Raman spectroscopy. The main items illustrated in Fig. 2 include nitrile gloves (Fig. 2A), clinical clothing (Fig. 2B), the butterfly needle cannula (Fig. 2C), and a Vacutainer glass tube (Fig. 2D), with their corresponding Raman spectra shown in panels A′–D′. For each material, representative Raman spectra were obtained and compared with reference data available in Open Specy, a free online platform for spectral analysis, to confirm their polymer composition. These materials were analysed because any contamination derived from them would be visible in the negative controls, thereby ensuring that MPs identified in blood samples could be distinguished from procedural artefacts. Additional items tested, together with their identified polymers and similarity percentages, are summarised in Table 1, which was used to compile a reference library of unavoidable laboratory-derived materials for contamination control.
Negative and positive controls were included to evaluate the reliability of the protocol and to rule out potential contamination from laboratory materials or solutions. The negative controls were designed to detect any artefactual signals that might arise during sample handling: ultrapure water filtered through a glass fiber filter (Fig. 3A), ultrapure water filtered through a glass fiber filter and passed through a butterfly needle (Fig. 3B), and digestion solution prepared with glass-filtered ultrapure water (Fig. 3C). Moreover, a positive control was included to validate the performance of the protocol, consisting of a standard commercial polyethylene (REPSOL Alcudio 1940C) (Fig. 3D). In each case, the filter images are presented on the left (Fig. 3A–D), while the central panels (Fig. 3A′–D′) display the selected particle when present; the Raman spectra are shown on the right (Fig. 3A′′–D′′). No identifiable spectra from the negative controls (Fig. 3A–C) matched any reference in the Open Specy database, confirming the absence of MPs signals. In the DS control (Fig. 3C), crystalline structures consistent with KOH are visible, but none showed spectra compatible with plastic polymers. Conversely, the positive control (Fig. 3D) produced a spectrum with similarity to the polyethylene standard, thus demonstrating the validity of the method.Fig. 3. Negative and positive controls analyzed by confocal Raman spectroscopy.(A) Ultrapure water filtered through a glass fiber filter. (B) Ultrapure water filtered through a glass fiber filter and passed through a butterfly needle. (C) Digestion solution prepared using glass-filtered ultrapure water, where crystalline KOH structures can be observed. (D) Positive control consisting of a commercial plastic standard (polyethylene). (A–D) Images of the filters; (A′–D′) images of selected particles when present; and (A′′–D′′) Raman spectra (white) compared with reference spectra from Open Specy (red). No spectra from negative controls (A–C) could be matched in the Open Specy database, confirming the absence of detectable microplastic particles. In contrast, the positive control (D) yielded a spectrum that matched the commercial polyethylene standard.Fig 3 dummy alt text
To confirm the presence and identity of MP particles, blood samples were analysed using confocal Raman spectroscopy. Representative results from three independent samples are shown in Fig. 4. For each sample, the left panels (Fig. 4A–C) display the filter images after the isolation process; the middle panels (Fig. 4A′–C′) show the corresponding particle images selected for analysis; and the right panels (Fig. 4A′′–C′′) present the Raman spectra of those particles. The spectra were compared with reference spectra using the Open Specy database, which provided matches to polystyrene (PS) for sample A, ethylene-vinyl acetate (EVA) for sample B, and polyethylene (PE) for sample C. These results illustrate the ability of confocal Raman spectroscopy to detect and identify microplastics in human blood samples with high specificity.Fig. 4. Confocal Raman analysis of MPs isolated from human blood samples.Panels A, B, and C correspond to three independent blood samples. (A–C) Images of the filters after the isolation process. (A′–C′) Images of individual particles selected for analysis. (A′′–C′′) Raman spectra of the particles (white), compared with reference spectra in the Open Specy database (red). The software provided similarity matches with polystyrene (PS) in sample A, ethylene-vinyl acetate (EVA) in sample B, and polyethylene (PE) in sample C.Fig 4 dummy alt text
Limitations
Despite the robustness and reproducibility of the proposed protocol, certain limitations inherent to Raman microscopy should be acknowledged. First, the practical lower size limit for reliable MP identification is approximately 2–3 μm; below this threshold, or in the presence of strong fluorescence, the signal-to-noise ratio often compromises spectral quality and matching confidence. Second, due to time constraints, it is not feasible to analyse the entire filter surface, and a representative subset of particles is therefore examined. To minimize potential sampling bias—particularly relevant in samples with low particle density—a randomized grid-based selection strategy was employed. While sub-sampling is a standard requirement in Raman-based analyses, the subsample size and analysis time were selected to be sufficient to reflect the overall polymer composition. Nevertheless, very rare polymer types may remain underrepresented in low-density samples. Additionally, baseline-correction algorithms can occasionally introduce artefacts in low-quality spectra, which were carefully monitored to avoid misidentification.
Digestion and filtration may also slightly modify the appearance of glass fiber filters, increasing background scattering and generating less defined spectra—an effect commonly observed in Raman analyses of complex matrices. This highlights the importance of continued refinement and expansion of spectral libraries, as well as the incorporation of complementary approaches to ensure accurate identification in challenging samples.
Overall, the protocol provides a solid and practical framework for detecting and characterizing MPs in human blood, and these considerations mainly reflect intrinsic analytical challenges rather than limitations of the methodology itself.
CRediT author statement
Antonio José Sarabia: Investigation, Visualization**,** Data Curation, Writing - Original Draft. Belén Martínez: Investigation. María de los Ángeles Martínez: Resources, Investigation. Ricardo Rivera Fernández: Resources, Investigation.María Isabel Torres: Writing – Review & Editing, Supervision. Antonio Peñas: Methodology, Validation, Writing – Review & Editing. Jorge Nicolás Domínguez: Conceptualization, Methodology, Writing – Review & Editing, Supervision, Project administration, Funding acquisition.
Declaration of generative AI and AI-assisted technologies in the writing process
During the preparation of this work, the authors used ChatGPT (GPT-5, OpenAI) to improve the readability, clarity of grammar, and to assist with translation from Spanish to English. After using this tool, the authors reviewed and edited the content as needed, and take full responsibility for the content of the published article.
Declaration of competing interest
The authors declare that they have no known competing financial interests or personal relationships that could have appeared to influence the work reported in this paper.
The reference list from the paper itself. Each links out to its DOI / PubMed record.
- 1Bui X.T.Vo T.D.H.Nguyen P.T.Nguyen V.T.Dao T.S.Nguyen P.D.Microplastics pollution in wastewater: characteristics, occurrence and removal technologies Environ. Technol. Innov.202010.1016/j.eti.2020.101013 · doi ↗
- 2Huang D.Tao J.Cheng M.Deng R.Chen S.Yin L.Li R.Microplastics and nanoplastics in the environment: macroscopic transport and effects on creatures J. Hazard. Mater.202110.1016/j.jhazmat.2020.12439933191019 · doi ↗ · pubmed ↗
- 3Khan H.S.Hasan J.Manik M.Farukh M.A.Shahjahan M.Pervasiveness of microplastics in the gastrointestinal tract of some selected fish species from Turag River alongside the capital city of Bangladesh Emerg. Contam.202410.1016/j.emcon.2024.100309 · doi ↗
- 4Tumu K.Vorst K.Curtzwiler G.Global plastic waste recycling and extended producer responsibility laws J. Environ. Manag.202310.1016/j.jenvman.2023.11924237832296 · doi ↗ · pubmed ↗
- 5Osman A.I.Hosny M.Eltaweil A.S.Omar S.Elgarahy A.M.Farghali M.Yap P.S.Wu Y.S.Nagandran S.Batumalaie K.Gopinath S.C.B.John O.D.Sekar M.Saikia T.Karunanithi P.Hatta M.H.M.Akinyede K.A.Microplastic sources, formation, toxicity and remediation: a review Environ. Chem. Lett.202310.1007/s 10311-023-01593-3PMC 1007228737362012 · doi ↗ · pubmed ↗
- 6Jiang B.Kauffman A.E.Li L.Mc Fee W.Cai B.Weinstein J.Lead J.R.Chatterjee S.Scott G.I.Xiao S.Health impacts of environmental contamination of micro- and nanoplastics: a review Environ. Health Prev. Med.202010.1186/s 12199-020-00870-9PMC 736245532664857 · doi ↗ · pubmed ↗
- 7Galloway T.S.Cole M.Lewis C.Interactions of microplastic debris throughout the marine ecosystem Nat. Ecol. Evol.201710.1038/s 41559-017-011628812686 · doi ↗ · pubmed ↗
- 8Singh J.Samuel J.Hurley R.Editorial: plastics, microplastics, and nanoplastics: management and mitigation of water contamination Front. Environ. Sci.202110.3389/fenvs.2021.803551 · doi ↗