A day sleep promoting role of phototransduction in Drosophila melanogaster
Yu-Chien Hung, Mehran Akhtar, Nithish Sattoju, Xinghua Li, Steven Head, Tobias Ollerenshaw, Clelia Siefer-Gaillardin, Jashmine Arulchelvan, Ben Warren, Ko-Fan Chen

TL;DR
This study shows that visual input through phototransduction in fruit flies is important for promoting daytime sleep.
Contribution
The study reveals a direct role of phototransduction in promoting day sleep in Drosophila.
Findings
Flies with phototransduction mutations show fragmented daytime sleep.
Hyperpolarized photoreceptors in Drosophila result in shorter daytime sleep.
Visual mutants have reduced locomotor speed, affecting sleep measurement.
Abstract
The daily sleep-wake cycle is a conserved behaviour defined by locomotion quiescence and enhanced responsive threshold to sensory stimuli. Both the circadian clock and sleep-homeostasis determine the daily sleep profile. Environmental light is a major sensory input and also regulates circadian clock and the balance between sleep and wakefulness. In Drosophila, the cellular mechanism and neural circuitry underlying light-mediated circadian synchronization are well-established, yet the direct relationship between light/visual input and sleep remains unclear. To address this knowledge gap, we measured sleep behaviour in Drosophila with mutations in genes involved in phototransduction and downstream neural transmission. We observed consistent day sleep fragmentation in flies with mutations in multiple phototransduction components. We also found that mutation that led to hyperpolarised…
Genes, proteins, chemicals, diseases, species, mutations and cell lines named across the full text — each resolved to its canonical identifier and authoritative record.
Click any figure to enlarge with its caption.
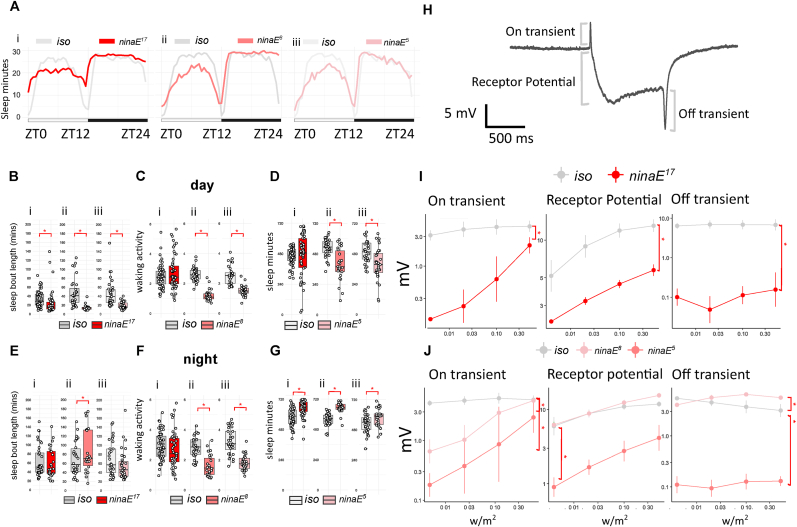 Figure 1
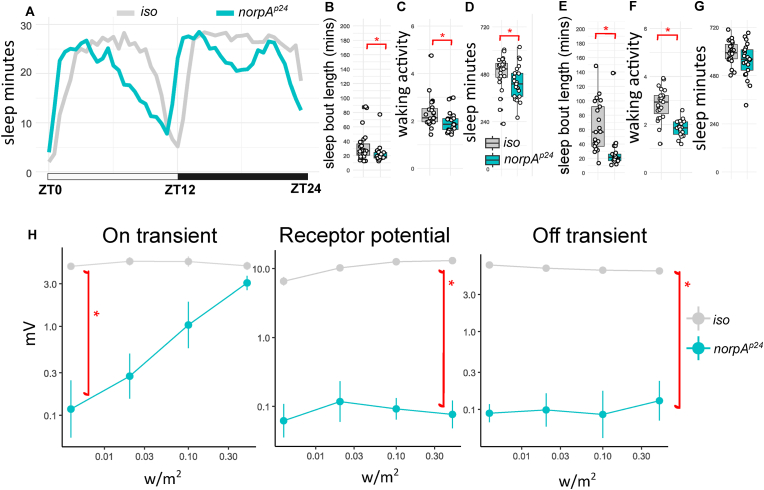 Figure 2
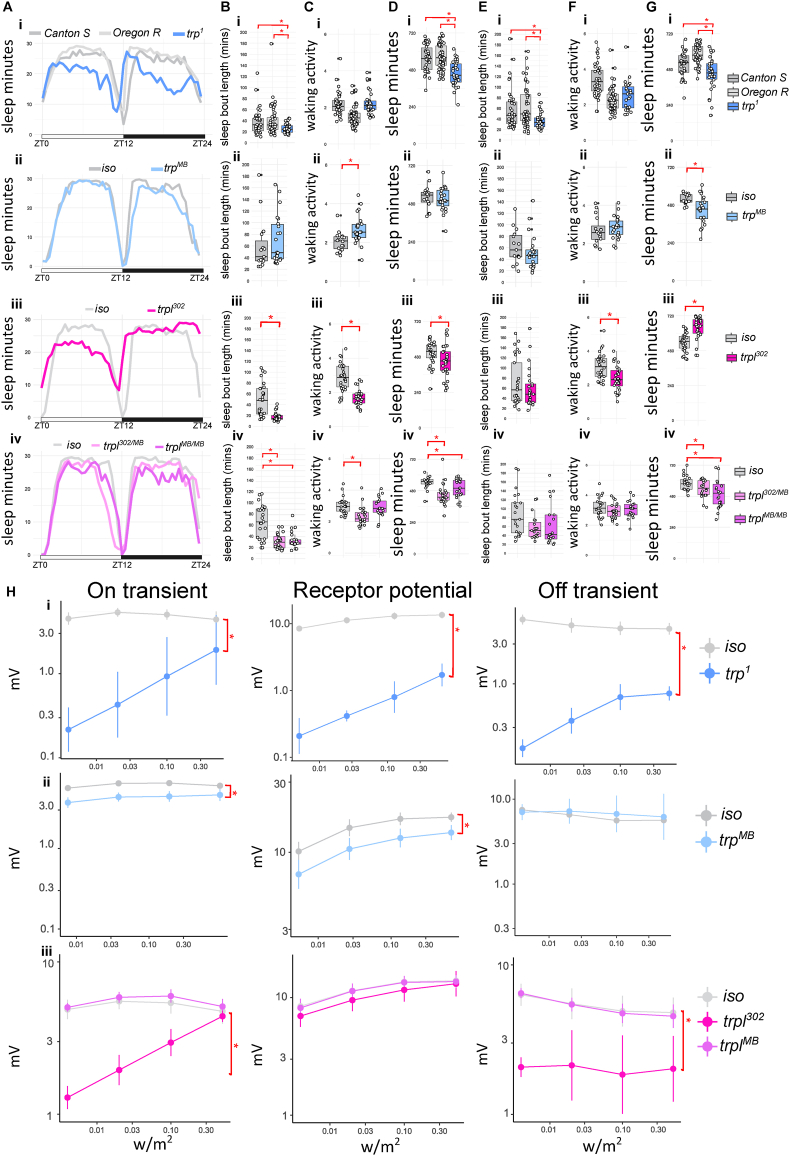 Figure 3
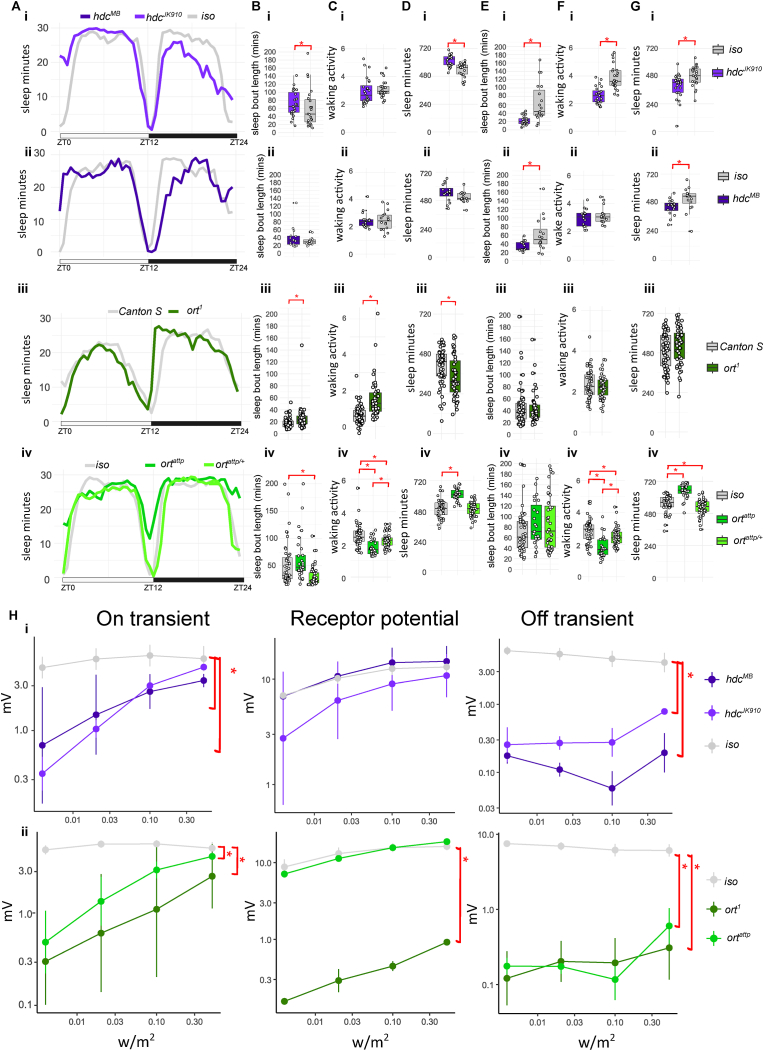 Figure 4
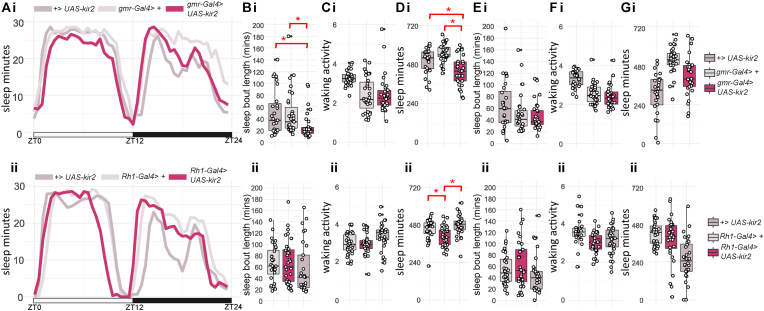 Figure 5
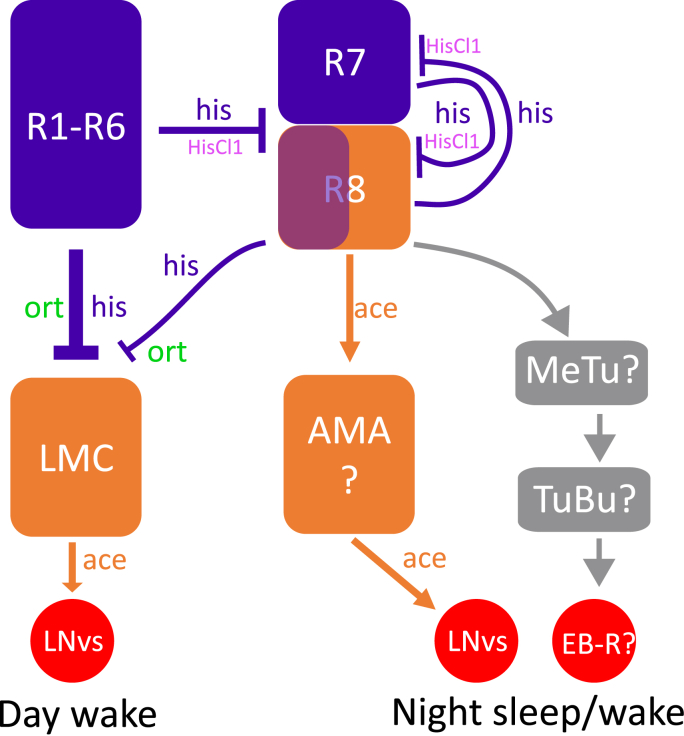 Figure 6
Peer Reviews
No public reviews on file for this paper yet. If you reviewed it on a platform where reviews are public (OpenReview, ICLR, NeurIPS, ICML), you can paste yours below so the community can read it here.
Videos
No videos yet. Explain this paper in a talk, walkthrough, or lecture? Add one.
Taxonomy
TopicsNeurobiology and Insect Physiology Research · Circadian rhythm and melatonin · Sleep and Wakefulness Research
Introduction
1
Sleep is vital for good health. Disruptions to either sleep timing and/or amount has been linked to numerous metabolic and neurological diseases (see reviews, Hartmann and Kempf, 2023; Wulff et al., 2010). Across the animal kingdom, sleep is defined by behavioural quiescence and increased arousal threshold to environmental stimuli such as light or mechanic vibrations. Arousal threshold within a period of sleep varies in stages that are associated with specific electrophysiological signatures in electroencephalogram (EEG) and local field potentials (LFPs) in the brain (Lakhiani et al., 2023). With its versatile genetic toolkit and conserved behavioural and electrophysiological features of sleep (Jagannathan et al., 2024; Shafer and Keene, 2021), the fruit fly Drosophila melanogaster has been used for identifying the biological basis and the conserved function of sleep. In parallel to murine investigations, studies in Drosophila have demonstrated that neuronal redox status may form a cellular basis of sleep (Hartmann and Kempf, 2023) and sleep stages play roles in synaptic scaling that is important for learning and memory (Dissel et al., 2015; Gilestro et al., 2009; Tainton-Heap et al., 2021; Yap et al., 2017). Recent investigations in Drosophila have also shown that sleep is required for effective maintenance of the immune system, gut microbiome, and waste clearance (Alphen et al., 2021; Vaccaro et al., 2020; Vincent et al., 2022).
Daily sleep onset and duration are regulated by two intrinsic mechanisms: the circadian clock and sleep homeostasis. The circadian clock defines the baseline sleep-wake level across 24 hours, whereas sleep homeostasis maintains the overall level of sleep amount. In Drosophila, the neural circuits that generate circadian rhythm are composed of 242 clock neurons (Reinhard et al., 2024) that express the core molecular clock mechanism. Whereas the homeostatic control of sleep is distributed across the following neural domains: Pars Intercerebralis (PI), Mushroom Body (MB), Fan-Shaped Body (FSB) and Ellipsoid Body (EB) (Jones et al., 2025; Shafer and Keene, 2021). The circadian clock and sleep homeostasis are likely coordinated, as clock neurons modulate the FSB-mediated sleep homeostat (Hsu et al., 2025).
Light is a prominent environmental stimulus that regulates both circadian clock and sleep homeostasis to maintain an animal's temporal niche and sufficient sleep. The synchronisation between environmental light regime and the neural activity of clock neurons is called circadian photoentrainment. Visual inputs are part of photoentrainment in Drosophila. The visual system in the fly is composed of peripheral light sensing neurons: photoreceptors in compound eyes, HB-eyelet and ocelli. Photoreceptors in the eye are subdivided into outer achromatic R1-R6 and inner chromatic R7/R8 neurons, both of which sends their synaptic outputs to downstream visual processing brain areas called the optic lobes and ventrolateral neuropils (Nériec and Desplan, 2016). Crucially, light signals are converted into depolarisation of the neuronal membrane via a cellular process called phototransduction in the photoreceptors of the compound eye and HB-eyelet. Phototransduction requires the light-sensing GPCR Rhodopsins 1-6 (Rh1-6) and their downstream signal cascades that ultimately activate cation channels depolarising the photoreceptors (Hardie, 2012). Activation of photoreceptors results in synaptic release of histamine or acetylcholine to communicate with clock neurons either directly or indirectly via a neural network in the optic lobes (Alejevski et al., 2019; Ogueta et al., 2018, 2020; Rieger et al., 2003; Schlichting et al., 2016; Tang et al., 2022; Xiao et al., 2023). Apart from via the visual system, Drosophila circadian clocks are entrained by cell autonomous light-sensing mechanisms mediated by cryptochrome (cry), quasimodo (qsm) or Rhodopsin 7 (Rh7) (Chen et al., 2011; Ni et al., 2017; Peschel et al., 2009).
Light can directly regulate sleep by either promoting or supressing sleep via different neural pathways in the murine system (Altimus et al., 2008; Pilorz et al., 2016). As a crepuscular species, Drosophila sleep both in the day (light) and in the night (darkness). While current evidence indicates that distinct neurogenetic networks may control day and night sleep (Chen et al., 2019; Damulewicz et al., 2020; Hsu et al., 2025; Ishimoto et al., 2012; Lamaze et al., 2018; Mazzotta et al., 2020; Sengupta et al., 2019), the mechanism underlying light-mediated regulation of the Drosophila sleep homeostat is far from clear. Previous studies indicate that midday sleep (i.e., siesta during six hours of the midday) can be enhanced by high-intensity light via the HB-eyelet-mediated cholinergic pathway (Rieger et al., 2007; Schlichting et al., 2019). Separate studies however, have shown contradictory findings for the role of compound eye photoreceptors in sleep regulation: synaptic inhibition in these photoreceptors promote sleep (Damulewicz et al., 2020), yet the optogenetic activation of the same photoreceptors in another investigation did not result in sleep suppression (Kirszenblat et al., 2019). Moreover, artificial activation of the direct downstream target of eye photoreceptors, lamina monopolar neuron 2 (L2 LMC), resulted in drastic sleep loss (Muraro and Ceriani, 2015). This finding contradicts the increased sleep observed in flies with reduced histamine (Oh et al., 2013), which is the main neurotransmitters released from photoreceptors to inhibit L2 LMC neurons (Pantazis et al., 2008). Furthermore, visual experience in light was recently found to promote night sleep in Drosophila (Kirszenblat et al., 2019), suggesting light and/or vision per se serve as sleep homeostat drivers, similar to in vertebrates (Horne and Walmsley, 1976; Korf et al., 2017; Miyamoto et al., 2003).
A recent systematic study of mutants with defects in various light input pathways indicate that only Rh7 is required for shade sleep preference in the day, but the study did not investigate the baseline sleep level in these mutants (Meyerhof et al., 2024). We therefore investigated the role of light input pathways in Drosophila sleep by focusing on the role of the visual system. Using the conventional infrared beam-based sleep assay (Chen et al., 2019; Chiu et al., 2010), we surveyed baseline sleep profiles in three groups of flies: strains with mutations in genes involved in (i) phototransduction and (ii) downstream histaminergic neurotransmission (Hardie, 2012), and (iii) those with artificial inhibition of photoreceptors. We also performed electroretinogram (ERG) examine the phototransduction/neurotransmission defects in these above mutants. By carefully examining sleep and ERG parameters, we identified a novel role of visual phototransduction in driving sleep.
Materials and methods
2
Fly husbandry
2.1
Drosophila strains were kept in standard fly food (glucose 6.93% w/v, agar 0.5% w/v, cornmeal, 6.3% w/v, yeast, 4.38% w/v, propionic acid, 0.26% v/v, 0.2% v/v nipagin) at 25^o^C 12-hour light dark cycle. Long-term fly stocks are kept in the same food and light regime at 18^o^C. The Canton S and Oregon R wildtype strains were obtained from the Kyriacou Lab (University of Leicester, UK), while w^iso31^ (i.e. iso) control was obtained from the Jepson lab (University College London, UK). The following visual mutants, Gal4 and UAS transgenic flies were ordered from Bloomington Drosophila Stock Center (Indiana University, USA) (stock number): trp^1^ (5692); trp^MB^ (23636); trpl^302^ (31433); trpl^MB^ (29134); ninaE^8^ (2001); ninaE^5^ (3531); ninaE^17^ (5701); norpA^P24^ (9048); hdc^MB^ (25260); hdc^JK910^ (64203); ort^1^ (1133); ort^attP^ (84559); Rh1-Gal4 (8691); gmr-Gal4 (1104); UAS-kir2 (6595); UAS-TeTxLC (28837); UAS-myr-mRFP (7118). All Gal4 and UAS transgenic flies were brought into the w^iso31^ background via five generation outcrossing following [w+] eye colour marker cassette. For Rh1-Gal4 outcrossing, we generated UAS-myr-mRFP/+; Rh1-Gal4/+ flies which expresses RFP in the eyes, we then crossed this line to w^iso31^ and used this RFP signal as a visible marker under a fluorescent stereoscope to ensure outcrossing offspring still contained both UAS-myr-mRFP and Rh1-Gal4 transgenes. The final stock was then established by balancer crossing with w^iso31C^;Sco/CyO; MKRS/TM6B and then w^iso31^;+/+; MKRS/TM6B for removing UAS-myr-mRFP. Among other lines, hdc^MB^, ort^attP^, trp^MB^, and trpl^MB^ contained either GFP or RFP visible markers, but the rest are classic missense mutations, making outcrossing without laborious PCR-based sequencing difficult. For simplicity, sleep experiments for all non-Gal4/UAS mutants were conducted without outcrossing and the only consistent results among mutant alleles of each gene were interpreted. Following the unexpected but consistent night sleep among hdc mutants, we decided to minimise the genetic background difference among these lines: since the precise genetic lesion of hdc^JK910^ on the hdc loci at the 2nd chromosome is unknown, only the 1st and 3rd chromosomes of hdc^JK910^ were replaced with those from w^iso31^ stock via the following successive crossings with balancer lines (gifts from Jepson lab):
Separately, hdc^MB^ flies were brought into the w^iso31^ background via five generation outcrossing following the GFP eye marker.
Sleep recording and analysis
2.2
Drosophila sleep, particularly day time sleep, is highly dependent on by sex, mating and nutrient status (Dove et al., 2017; Duhart et al., 2023; Isaac et al., 2010; Wu et al., 2018). Typically, mated females can sleep for as little as 150-200 minutes compared to the 300-400 minutes shown by males (out of the total 720 minutes of day time). To capture both sleep increase and decrease upon genetic manipulation, we focused our investigation on virgin male flies. Moreover, by focusing on males, our data is comparable to the previous decades of photoentrainment investigations of Drosophila circadian research that has been conducted mainly on male visual mutants (e.g. Rieger et al., 2003 and see review in Mazzotta et al., 2020). As such, we would caution against extending our findings to those of sleep in female flies.
Prior to the sleep experiment, Drosophila strains or crossings were reared in food with a richer recipe (wheat germ 1% w/v, soy 0.8% w/v, glucose/sucrose 3.3%/1.5% w/v, treacle 3% v/v, agar 1% w/v, cornmeal 1.5% w/v, yeast 3.5% w/v, propionic acid 0.5% v/v, nipagin 0.1% v/v), so as to keep the rearing conditions consistent with previous experimental conditions (Chen et al., 2011, 2019; Lamaze et al., 2018). We also note that in general, all strains of flies are less motile or less reproductively successful in standard fly food (as described above in 2.1). Sleep recordings were performed as described in (Chen et al., 2019). Three to four day-old virgin adult males were transferred to typical behaviour tubes containing food (2% w/v agar and 4% w/v sucrose at one end and cotton wool at the other), and housed in typical Drosophila Activity Monitor (DAM, Trikinetics Inc.) for 3 days of 12hours light-dark cycle at 25^o^C in a temperature and light controlled incubator (MIR-254-PE, PHCbi). The lighting source was a day light fluorescent lamp (FL15D, 6500K) with intensity between 1.2 and 6.7 w/m^2^ depending on the distance to the lamp. With conservative conversion with luminance surface area between 0.25 and 1 m^2^, our light intensity was approximately equal to 402 to 1608 lux. The locomotion of each fly was recorded as number of infrared beam crosses per minute. The locomotion data for day 3 was transferred to a previously customised Excel Calculator (Chen et al., 2019) to calculate all sleep episodes (defined as any period of immobility ≥5 minutes) along 24 hours. Additionally, the following parameters were calculated for each fly: overall sleep profile: minutes of sleep per 30 minutes across 24 hours; day sleep: total minutes of sleep during 12 hours of day; night sleep: total minutes of sleep during 12 hours of night; day average sleep bout length: day sleep minutes divided by total number of sleep bout during 12 hours of day; night average sleep bout length: night sleep minutes divided by total number of sleep bout during 12 hours of night; day waking activity: number of beam crosses divided by total wake minutes during 12 hours of day**; night waking activity**: number of beam crosses divided by total wake minutes during 12 hours of night.
Electroretinogram (ERG)
2.3
Three-to-five day-old adult virgin male flies were inserted into a p1000 plastic pipette tip, so that its head protruded from the narrow ending. The head was fixed using melted honey wax applied between the thorax and head without blocking the mouthpart and eyes. The pipette tip mounted fly was kept in the dark for 20 minutes and then transferred into the ERG recording rig. Glass electrodes (Borosilicate) with resistance of ∼5 MO and filled with 3 M KCl were inserted into the compound eye (recording) and head (reference). Each fly was left in the dark for 3 minutes before being exposed to four light intensities: 0.004, 0.02, 0.1 and 0.5 w/m^2^ at 540 nm LED green light source (M530L4-C1, ThorLab). These intensities fall within the liner range of receptor potential response. We stimulated with 1000 ms exposure to each light intensity and repeated the procedure two further times to obtain an average value of three presentations at each light intensity for each fly. The potential difference between the electrodes was amplified 10x, and acquired by Neuroprobe Amplifier model 1600 and 8-channel data acquisition interface DA-8 (A-M systems) using the SciWorks Data Acquisition & Analysis Suite.
Data display and statistics
2.4
The ggplot2 package (3.5.2) in R (4.4.2) used to display sleep and ERG data. X-Y plots were used to display overall sleep profiles for each compared genotype. Boxplots with average values of each individual were used to display sleep parameters data. We calculated the average voltage change of on transient, receptor potential and off transient in the ERG profiles of each replicate for each fly (Fig. 1H). The value for each fly was then plotted against light intensity on logarithmic scales by ggplot2. Considering the variability in sleep data (Chen et al., 2019; Lamaze et al., 2018), statistical significance was identified by Kruskal-Wallis rank sum test for non-parametric multiple comparison (kruskal.test). Pairwise Wilcoxon rank sum exact test with multiple comparison Benjamini-Hochberg correction (pairwise.wilcox.test) was used to specifically identify difference between pairwise genotypes. Unlike sleep data, ERG voltage changes data were pooled across four intensities when identifying genotypical difference via Pairwise Wilcoxon rank sum exact test. Significance level is set at adj.p < 0.05. Effect size r is calculated by wilcox_effsize with magnitude categories: small; moderate and large assigned. Importantly, while Benjamini-Hochberg correction is required to correct the p-values, the effect size r does not change by multiple comparison, as it is defined by Z/√n. All statistic comparisons, p values, effect size and sample size are listed in Table 1, Table 2, Table 3, Table 4, Table 5, Table 6, Table 7 for the corresponding Fig. 1, Fig. 2, Fig. 3, Fig. 4, Fig. 5.Fig. 1Sleep profile, parameters and ERG quantification for ninaE mutants. A. Sleep traces of average sleep minutes per 30 minutes over 12 hours light-dark cycle. ZT0: light on, ZT12: light off, ZT24: end of night. Sleep traces of iso control and ninaE mutants are colour coded in grey and red shades (i-iii). B. Average day sleep bout length (minutes), C. Average day waking activity (beam breaks per waking minutes), D. Average day sleep (minutes), E. Average night sleep bout length (minutes)*,*F. Average night waking activity (beam breaks per waking minutes), and G. Average night sleep (minutes) for ninaE^17^ (i), ninaE^8^ (ii) and ninaE^5^ (iii) compared to iso controls. Average values for each individual are plotted as filled circles except for those outside scales. H. An example ERG profile from iso control with 1000 ms green light flash that evokes voltage changes of on-transient, receptor potential and off-transient. I. Mean and standard deviation for voltage change (mV) in on transient, receptor potential and off-transient of ERG upon four light intensity (0.004, 0.02, 0.1 and 0.5 w/m^2^) flash for ninaE^17^ and controls. J. Mean and standard deviation for voltage change (mV) in on transient, receptor potential and off-transient of ERG upon four light intensities (0.004, 0.02, 0.1 and 0.5 w/m^2^) 1000ms flash for ninaE^5^, ninaE^8^ and controls. Plot scales are in either liner (A-G) and logarithmic (I-J). Asterisk indicates statistical significance (p < 0.05) between mutants and iso controls by pairwise Wilcoxon rank sum exact test without (B-H) and with multiple comparison, Benjamini-Hochberg correction (I, followed by Kruskal-Wallis rank sum test). See Table 1 for sample size (n = 26-60 for sleep; n = 3-6 for ERG, with 4 replicates for each light intensity), p-values and effect size for each comparison.Fig. 1. Fig. 2Sleep profile, parameters and ERG quantification for norpA mutants. A. Sleep traces of average sleep minutes per 30 minutes over 12 hours light-dark cycle. ZT0: light on, ZT12: light off, ZT24: end of night. Sleep traces for iso control and norpA^p24^ mutants are colour coded in grey and cyan. B. Average day sleep bout length (minutes), C. Average day waking activity (beam breaks per waking minutes), E. Average night sleep bout length (minutes), F. Average night waking activity (beam breaks per waking minutes), G. Average night sleep (minutes) for norpA^p24^ compared to iso controls. Average values for each individual are plotted as filled circles except for those outside scales (B-G). H. mean and standard deviation for voltage change (mV) in on transient, receptor potential and off-transient of ERG upon four light intensity (0.004, 0.02, 0.1 and 0.5 w/m^2^) flash for norpA^p24^ and iso controls. Plot scales are in either liner (A-G) and logarithmic (H). Asterisk indicates statistical significance (p < 0.05) between mutants and iso controls by pairwise Wilcoxon rank sum exact test. See Table 2 for sample size (n = 21-23 for sleep; n = 4 for ERG, with 4 replicates for each light intensity), p-values and effect size for each comparison.Fig. 2. Fig. 3Sleep profile, parameters and ERG quantification for trp and trpl mutants. A. Sleep traces of average sleep minutes per 30 minutes over 12 hours light-dark cycle. ZT0: light on, ZT12: light off, ZT24: end of night. Sleep traces for Canton S (i), Oregon R (i) and iso controls (ii-iv) are coloured coded in the shades of greys; trp (i-ii) and trpl (iii-iv) mutants are colour coded in shades of blue and purples. B. Average day sleep bout length (minutes), C. Average day waking activity (beam breaks per waking minutes), D. Average day sleep (minutes), E. Average night sleep bout length (minutes), F. Average night waking activity (beam breaks per waking minutes), G. Average night sleep (minutes) for trp^1^ (i), trp^MB^ (ii), trpl^302^ (iii) and trpl^302/MB^ or trpl^MB^ (iv) compared to controls. Average values for each individual are plotted as filled circles except for those outside scales. H. Mean and standard deviation for voltage change (mV) in on transient, receptor potential and off-transient of ERG upon four light intensity (0.004, 0.02, 0.1 and 0.5 w/m^2^) flash for trp^1^ (i), trp^MB^ (ii), trpl^302^ (iii) and trpl^MB^ (iii) compared to controls. Plot scales are in either liner (A-G) and logarithmic (H). Asterisk indicates statistical significance (p < 0.05) between mutants and controls by pairwise Wilcoxon rank sum exact test without (Aii-Gii, Aiii-Giii, Hi and Hii) and with multiple comparison, Benjamini-Hochberg correction (Ai-Gi, Aiv-Giv, and Hiii followed by Kruskal-Wallis rank sum test). See Table 3, Table 4 for sample size (n = 16-53 for sleep; n = 3 for ERG, with 4 replicates for each light intensity), p-values and effect size for each comparison.Fig. 3. Fig. 4Sleep profile, parameters and ERG quantification for hdc and ort mutants. A. Sleep traces of average sleep minutes per 30 minutes over 12 hours light-dark cycle. ZT0: light on, ZT12: light off, ZT24: end of night. Sleep traces for iso (i-ii, iv) and Canton S (iii) controls are coloured coded in the shades of greys; hdc (i-ii) and ort (iii-iv) mutants are colour coded in shades of indigos and greens. B. Average day sleep bout length (minutes), C. Average day waking activity (beam breaks per waking minutes), D. Average day sleep (minutes), E. Average night sleep bout length (minutes), F. Average night waking activity (beam breaks per waking minutes), G. Average night sleep (minutes) for hdc mutants (i-ii), ort^1^ and ort^attp/+^ or ort^attp^ (iii-iv) compared to controls. Average values for each individual are plotted as filled circles except for those outside scales (B-G). H. Mean and standard deviation for voltage change (mV) in on transient, receptor potential and off-transient of ERG upon four light intensity (0.004, 0.02, 0.1 and 0.5 w/m^2^) flash for hdc (i) and ort (ii) mutants compared to controls. Plot scales are in either liner (A-G) and logarithmic (H). Asterisk indicates statistical significance (p < 0.05) between mutants and controls by pairwise Wilcoxon rank sum exact test without (Aii-Gii) and with multiple comparison, Benjamini-Hochberg correction (Ai-Hi, Aiii-Giii, and Hii followed by Kruskal-Wallis rank sum test). See Table 5, Table 6 for sample size (n = 16-60 for sleep; n = 3-5 for ERG, with 4 replicates for each light intensity), p-values and effect size for each comparison.Fig. 4. Fig. 5Sleep profile and parameters for flies with hyperpolarised photoreceptors. A. Sleep traces of average sleep minutes per 30 minutes over 12 hours light-dark cycle. ZT0: light on, ZT12: light off, ZT24: end of night. Sleep traces for gmr-Gal4>+ (i), Rh1-Gal4>+ (ii) and +>UAS-Kir2 (i-ii) control flies are coloured coded in the shades of greys; experimental mutants gmr-Gal4> UAS-kir2 (i) and Rh1-Gal4>UAS-kir2 (ii) are colour coded in light burgundy. B. Average day sleep bout length (minutes), C. Average day waking activity (beam breaks per waking minutes), D. Average day sleep (minutes), E. Average night sleep bout length (minutes), F. Average night waking activity (beam breaks per waking minutes), G. Average night sleep (minutes) for gmr-Gal4> UAS-kir2 (i) and Rh1-Gal4>UAS-kir2 (ii) compared to controls. Average values for each individual are plotted as filled circles except for those outside scales (B-G). Asterisk indicates statistical significance (p < 0.05) between mutants and controls by pairwise Wilcoxon rank sum exact test with multiple comparison, Benjamini-Hochberg correction (followed by Kruskal-Wallis rank sum test). See Table 7 for sample size (n = 28-32), p-values and effect size for each comparison.Fig. 5
Result
3
Defects in phototransduction genes caused short day sleep bout
3.1
To verify the role of visual phototransduction genes in sleep regulation, we tested eight mutant fly strains. These strains are mutants of the following four genes: Rhodopsin 1/ninaE, Phospholipase C/norpA, and the two cation channels trp and trpl. These included both classic missense mutations, and when available, more recently characterised mutations using P-element insertion. To analyse the details of sleep-wake profiles under a typical day of 12 hours light-12 hours dark, we examined three conventional parameters for both day and night period: total sleep, average sleep bout length and waking activity.
ninaE
3.1.1
Upon exposure to light, 11-cis 3-hydroxy-retinal, the chromophore in the Rhodopsin protein undergoes photoisomerization, transforming Rhodopsin to Metarhodopsin which then triggers a downstream GPCR signal cascade. Rhodopsin 1/ninaE protein is the main light-sensing GPCR in the outer photoreceptors R1-R6 of the Drosophila compound eye. Reduction or loss of ninaE abolishes or reduces photoisomerization and therefore blocks the light-induced photoreceptor potential and transients that are typically measured for R1-R6 in ERG (Hardie, 2012).
Many visual tasks, such as navigation, phototaxis, optomotor and escape, require R1-R6 activity. We therefore first tested the sleep profile of the class null allele ninaE^17^ (O'Tousa et al., 1985). During the day, ninaE^17^ mutants show a lower midday sleep peak in the sleep profile (Fig. 1Ai) but the amount of total sleep is comparable to the white eye control, w^iso31^ (here after iso, Fig. 1Di). However, we found that the average sleep bout length in ninaE^17^ is shorter than the control, indicating sleep fragmentation (Fig. 1Bi). During the night, we observed increased sleep amount (Fig. 1Gi) while the average sleep bout length is similar to the control (Fig. 1Ei). Since sleep measurements in Drosophila depend on locomotion, an increase in sleep can be falsely claimed due to defects in locomotion. Therefore, “waking activity”, i.e., locomotor activity per waking minutes, was designed as a conventional measure to detangle such a compound scenario (Andretic and Shaw, 2005; Harbison and Sehgal, 2008). We applied this measurement and found that waking activity is similar between ninaE^17^ and the control in both day and night (Fig. 1Ci,Fi).
ninaE^17^ flies contain a secondary ebony^1^ mutation that impacts sleep-wake cycles (Rossi et al., 2015; Suh and Jackson, 2007). We therefore tested two other ninaE hypomorphs: ninaE^5^ and ninaE^8^ (Scavarda et al., 1983). Both mutants show similar midday sleep peak reductions to those seen in ninaE^17^ flies (Fig. 1Aii-iii). This observation is consistent with the significant reduced day sleep observed in either mutant when compared to the control (Fig. 1Dii-iii). Similarly, both mutants also show shorter average sleep bout length in the day (Fig. 1Bii-iii). Intriguingly, the loss of sleep in the two ninaE hypomorphs was observed despite of the loss of waking activity in the day (Fig. 1Cii-iii). During the night, ninaE hypomorphs both show increased sleep (Fig. 1Gii-iii), but only ninaE^8^ mutant shows significant increase of the average sleep bout length compared to control flies (Fig. 1Eii-iii). However, mutants severely reduce their waking activity (Fig. 1Fii-iii with effect size r between 0.67 and 0.82, Table 1). Therefore, the increase in night sleep observed here cannot be certain, and may simply reflect the loss of locomotor activity. To confirm ninaE mutants harbour phototransduction defects, we measured light-evoked receptor potentials through Electroretinograms (ERG, Fig. 1H). Consistent with previous reports, ninaE^17^ and ninaE^8^ exhibit reduced light induction of receptor potential, on and off transients (Fig. 1I–J), whereas ninaE^5^ retains certain function (see normal receptor potential and off-transient in ninaE^5^, Fig. 1J). Taken together, our data indicates that the reduction, or loss of, Drosophila Rhodopsin 1 (ninaE) protein results in the reduction of day sleep bout length, and that phototransduction is required to drive day sleep pressure. However, recent studies show support for a non-visual function of ninaE (Zanini et al., 2018). To verify if ninaE protein alone or the phototransduction in general regulates day sleep bout length, we further examined the sleep-regulatory roles for three other key proteins for phototransduction.Table 1. Statistics of a. Sleep and b. ERG parameters for ninaE mutants.Table 1a. Sleep parametergenotype comparisonp-valueeffect size rn1n2significant r magnitudeday sleepiso vs ninaE^17^3.50E-010.096052night sleepiso vs ninaE^17^1.00E-070.516051largeday sleep bout lengthiso vs ninaE^17^9.60E-060.426052moderatenight sleep bout lengthiso vs ninaE^17^7.90E-010.034435day waking activityiso vs ninaE^17^5.70E-010.056052night waking activityiso vs ninaE^17^1.30E-010.146051day sleepiso vs ninaE^5^1.40E-030.403231moderatenight sleepiso vs ninaE^5^3.20E-020.273231smallday sleep bout lengthiso vs ninaE^5^5.30E-090.683231largenight sleep bout lengthiso vs ninaE^5^7.10E-020.233231day waking activityiso vs ninaE^5^3.90E-130.793231largenight waking activityiso vs ninaE^5^1.90E-100.723231largeday sleepiso vs ninaE^8^9.30E-050.513226largenight sleepiso vs ninaE^8^1.10E-080.753226largeday sleep bout lengthiso vs ninaE^8^6.90E-090.763226largenight sleep bout lengthiso vs ninaE^8^9.60E-020.223226day waking activityiso vs ninaE^8^1.40E-130.823226largenight waking activityiso vs ninaE^8^2.90E-070.673226largeb.ERG parametergenotype comparisonp-valueeffect size *rn1**n2significant r magnitudereceptor potentialiso* vs ninaE^17^2.50E-060.716∗43∗4largeon transientiso vs ninaE^17^1.90E-080.786∗43∗4largeoff transientiso vs ninaE^17^1.60E-090.816∗43∗4largereceptor potentialiso vs ninaE^5^4.40E-010.173∗43∗4receptor potentialiso vs ninaE^8^4.40E-060.833∗43∗4largereceptor potentialninaE^5^ vs ninaE^8^4.40E-060.843∗43∗4largeon transientiso vs ninaE^5^1.70E-030.643∗43∗4largeon transientiso vs ninaE^8^4.40E-060.843∗43∗4largeon transientninaE^5^ vs ninaE^8^5.97E-020.393∗43∗4off transientiso vs ninaE^5^1.70E-020.483∗43∗4moderateoff transientiso vs ninaE^8^1.10E-060.853∗43∗4largeoff transientninaE^5^ vs ninaE^8^1.10E-060.853∗43∗4largen1 = sample size for first genotype in genotype comparison; n2 = sample size for first genotype in genotype comparison; ∗ sample size in ERG statistic is actual sample size multiple with four reflecting the values from the four light intensities.
norpA
3.1.2
Metarhodopsin triggers Gqα activation and enzymatic reaction of Phospholipase C (PLC) that produces secondary messengers. The norpA protein is the main PLC in the visual system, and the classic mutant norpA^p24^ exhibits severe visual defects (Gao et al., 2008). The sleep profile of norpA^p24^ shows decline of day sleep from the midday and a secondary dip at midnight compared to the control (Fig. 2A). There is also a phase advance of night sleep in norpA^p24^ mutants as compared to the controls. Such an advance was also noticeable in locomotor profile of another norpA allele in a previous study (Ogueta et al., 2018). The changes in sleep profile coincides with the reduction in day sleep (Fig. 2D) and shorter bout length in both day and night (Fig. 2B and E). Similar to ninaE^5^ and ninaE^8^, the norpA^p24^ mutant has low waking activity (Fig. 2C and F, effect size 0.39/0.75, Table 2). We also confirmed abnormal ERG profiles in norpA^p24^ (Fig. 2H).Table 2. Statistics of a. Sleep and b. ERG parameters for norpA mutants.Table 2a. Sleep parametergenotype comparisonp-valueeffect size rn1n2significant r magnitudeday sleep bout lengthiso vs norpA^p24^9.40E-030.392321moderatenight sleep bout lengthiso vs norpA^p24^2.50E-060.662321largeday sleepiso vs norpA^p24^3.20E-020.322321moderatenight sleepiso vs norpA^p24^1.20E-010.232321day waking activityiso vs norpA^p24^9.40E-030.392321moderatenight waking activityiso vs norpA^p24^1.70E-070.722321largeb.ERG parametergenotype comparisonp-valueeffect size *rn1**n2significant r magnitudereceptor potentialiso* vs norpA^p24^1.50E-060.854∗44∗4largeon transientiso vs norpA^p24^3.30E-090.854∗44∗4largeoff transientiso vs norpA^p24^1.50E-060.854∗44∗4largen1 = sample size for first genotype in genotype comparison; n2 = sample size for first genotype in genotype comparison; ∗ sample size in ERG statistic is actual sample size multiple with four reflecting the values from the four light intensities.
trp and trpl
3.1.3
Activation of the two ion channels, trp and trpl in the last step of phototransduction causes the crucial cation influx resulting in depolarisation of the photoreceptor. We therefore examined the sleep profile of four mutant lines, two P-element insertion mediated mutants: trp^MB^, trpl^MB^ (Chen et al., 2015) and two classic null mutants: trp^1^, and trpl^302^ (Cosens and Manning, 1969; Leung et al., 2000; Niemeyer et al., 1996). Except for trp^1^, these lines have white eyes, like the ninaE and norpA mutants as described above.
The trp^1^ mutant was first isolated from a red eye wild type strain, but the precise background was not known (Cosens and Manning, 1969), so we compared its sleep profile to two widely used wild type strains in sleep and vision research: Canton S and Oregon R. Significant reductions in day and night sleep and average sleep bout length are shown in trp^1^ mutants as compared to either wild type flies (Fig. 3Ai, 3Bi and 3Ei, effect size: 0.29-0.54, Table 3). The waking activity of trp^1^ is comparable to Canton S but higher than Oregon R, and has limited impact to sleep loss (Fig. 3Ci and 3Fi). The sleep profile of trp^MB^ is distinct from trp^1^, norpA or ninaE mutants, with day sleep level similar to controls but a significant night sleep loss (Fig. 3Aii, 3Gii). There is no significant change in sleep bout length detected in trp^MB^ flies (Fig. 3Aii and 3Eii). Although, trp^MB^ flies sleep a similar amount during the day, compared to the control, their waking activity is significantly higher (Fig. 3Cii).
This relative normal sleep-wake profile may relate to the less severe reduction in receptor potential and light on/off transients in the ERG of trp^MB^ as compared to those of the trp^1^ null mutant (Fig. 3Hi and 3Hii, effect size r = 0.11-0.83 vs 0.78-0.85, Table 3).Table 3. Statistics of a. Sleep and b. ERG parameters for trp mutants.Table 3a. Sleep parametergenotype comparisonp-valueeffect size rn1n2significant r magnitudeday sleepCanton S vs Oregon R5.33E-010.073853day sleepCanton S vs trp^1^1.50E-040.473830moderateday sleepOregon R vs trp^1^2.90E-060.545330largenight sleepCanton S vs Oregon R1.20E-040.413853moderatenight sleepCanton S vs trp^1^1.63E-020.293830smallnight sleepOregon R vs trp^1^2.30E-070.595330largeday sleep bout lengthCanton S vs Oregon R8.66E-010.023853day sleep bout lengthCanton S vs trp^1^1.40E-020.323830moderateday sleep bout lengthOregon R vs trp^1^1.20E-020.325330moderatenight sleep bout lengthCanton S vs Oregon R6.61E-010.053853night sleep bout lengthCanton S vs trp^1^5.20E-030.353830moderatenight sleep bout lengthOregon R vs trp^1^1.20E-030.395330moderateday waking activityCanton S vs Oregon R8.20E-080.583853largeday waking activityCanton S vs trp^1^7.70E-010.043830day waking activityOregon R vs trp^1^2.90E-070.575330largenight waking activityCanton S vs Oregon R1.20E-070.583853largenight waking activityCanton S vs trp^1^1.60E-020.313830moderatenight waking activityOregon R vs trp^1^6.70E-020.205330day sleepiso vs trp^MB^5.80E-010.091624night sleepiso vs trp^MB^3.70E-030.461624moderateday sleep bout lengthiso vs trp^MB^3.20E-010.161624night sleep bout lengthiso vs trp^MB^3.90E-010.141624day waking activityiso vs trp^MB^1.40E-030.491624moderatenight waking activityiso vs trp^MB^2.90E-010.171624b.ERG parametergenotype comparisonp-valueeffect size *rn1**n2significant r magnitudereceptor potentialiso* vs trp^1^7.40E-070.853∗43∗4largeon transientiso vs trp^1^2.20E-050.783∗43∗4largeoff transientiso vs trp^1^7.40E-070.853∗43∗4largereceptor potentialiso vs trp^MB^4.40E-030.533∗44∗4largeon transientiso vs trp^MB^2.60E-070.833∗44∗4largeoff transientiso vs trp^MB^5.70E-010.113∗44∗4n1 = sample size for first genotype in genotype comparison; n2 = sample size for first genotype in genotype comparison; ∗ sample size in ERG statistic is actual sample size multiple with four reflecting the values from the four light intensities.
On the other hand, both trpl^302^ and trpl^MB^ mutants exhibit day sleep profiles similar to ninaE or norpA mutants (Fig. 3Aiii and 3Aiv), with significant reduced day sleep and average bout length (Fig. 3Biii, 3Biv, 3Diii and 3Div). Night sleep profiles and waking activities for the two trpl mutants diverged: trpl^302^ sleep more whereas trpl^MB^ sleep less (Fig. 3Giii, 3Giv). No significant changes in night sleep bout length were observed in both mutants as compared to the controls (Fig. 3Eiii and 3Eiv). trpl^302^ mutants generally have low waking activity, whereas trpl^MB^ maintains relative normal waking activity as compared to the controls (Fig. 3Ciii, 3Civ, 3Fiii and 3Fiv). trpl^302^ mutant is in cn and bw mutation background, which may affect the sleep. We therefore tested w; trpl^302/MB^ flies to reduce the impact of cn bw mutation. Similar to trpl^302^ and trpl^MB^, the w; trpl^302/MB^ transheterozygote mutant showed shorter day sleep and sleep bout length (Fig. 3Biv). As seen in previous reports (Chen et al., 2015; Leung et al., 2000) both mutants have limited impact on ERG profiles, trpl^302^ flies show a large reduction of on/off transient (effect size 0.73/0.81, Table 4), whereas trpl^MB^ mutants maintain normal ERGs, possibly due to synaptic compensatory mechanism (Fig. 3Hiii). Nevertheless, our data indicate the reduced trpl function and expression level cause sleep loss in the day.Table 4. Statistics of a. Sleep and b. ERG parameters for trpl mutants.Table 4a. Sleep parametergenotype comparisonp-valueeffect size rn1n2significant r magnitudeday sleepiso vs trpl^302^1.40E-020.323030moderatenight sleepiso vs trpl^302^1.40E-060.623030largeday sleep bout lengthiso vs trpl^302^1.40E-060.593030largenight sleep bout lengthiso vs trpl^302^6.90E-010.053028day waking activityiso vs trpl^302^1.10E-080.683030largenight waking activityiso vs trpl^302^9.70E-040.433028moderateday sleepiso/iso vs trpl^302^/trpl^MB^3.70E-050.632324largeday sleepiso/iso vs trpl^MB^/trpl^MB^3.71E-020.322321moderateday sleeptrpl^302^/trpl^MB^ vs trpl^MB^/trpl^MB^2.57E-020.352421moderatenight sleepiso/iso vs trpl^302^/trpl^MB^7.32E-020.282422night sleepiso/iso vs trpl^MB^/trpl^MB^1.56E-020.392423moderatenight sleeptrpl^302^/trpl^MB^ vs trpl^MB^/trpl^MB^1.52E-010.222223day sleep bout lengthiso/iso vs trpl^302^/trpl^MB^1.60E-040.592323largeday sleep bout lengthiso/iso vs trpl^MB^/trpl^MB^1.60E-040.582321largeday sleep bout lengthtrpl^302^/trpl^MB^ vs trpl^MB^/trpl^MB^8.69E-010.032321night sleep bout lengthiso/iso vs trpl^302^/trpl^MB^2.20E-010.232322night sleep bout lengthiso/iso vs trpl^MB^/trpl^MB^8.42E-020.312321night sleep bout lengthtrpl^302^/trpl^MB^ vs trpl^MB^/trpl^MB^4.82E-010.132221day waking activityiso/iso vs trpl^302^/trpl^MB^1.20E-040.582323largeday waking activityiso/iso vs trpl^MB^/trpl^MB^9.63E-010.012321day waking activitytrpl^302^/trpl^MB^ vs trpl^MB^/trpl^MB^1.04E-030.502321largenight waking activityiso/iso vs trpl^302^/trpl^MB^2.91E-010.212322night waking activityiso/iso vs trpl^MB^/trpl^MB^6.31E-010.122321night waking activitytrpl^302^/trpl^MB^ vs trpl^MB^/trpl^MB^7.10E-010.072221b.ERG parametergenotype comparisonp-valueeffect size *rn1**n2significant r magnitudereceptor potentialiso* vs trpl^302^2.20E-010.266∗43∗4receptor potentialiso vs trpl^MB^8.60E-010.036∗45∗4receptor potentialtrpl^302^ vs trpl^MB^2.20E-010.263∗45∗4on transientiso vs trpl^302^2.40E-060.736∗43∗4largeon transientiso vs trpl^MB^1.50E-010.226∗45∗4on transienttrpl^302^ vs trpl^MB^1.00E-050.803∗45∗4largeoff transientiso vs trpl^302^4.80E-090.816∗43∗4largeoff transientiso vs trpl^MB^9.90E-010.006∗45∗4off transienttrpl^302^ vs trpl^MB^5.30E-080.813∗45∗4largen1 = sample size for first genotype in genotype comparison; n2 = sample size for first genotype in genotype comparison; ∗ sample size in ERG statistic is actual sample size multiple with four reflecting the values from the four light intensities.
Divergent sleep function in histaminergic pathway
3.2
Drosophila photoreceptors are divided into Rh1-expressing (R1-R6) and non-Rh1-exppressing neurons (R7/R8). The R1-R6 photoreceptors form synapses onto lamina monopolar neurons (LMC), while the R7/R8 send their output to the medulla in the optic lobes. Histamine is the primary neurotransmitter for Rh1-expessing photoreceptors. Therefore, we tested if mutants with defects in histamine synthesis or postsynaptic reception show altered sleep. Histidine decarboxylase (hdc) is the main histamine synthesis enzyme (Pantazis et al., 2008). We investigated the sleep profiles for the two hdc mutants (hdc^JK910^ and hdc^MB^) that were showed to have reduced histamine levels in the photoreceptors (Burg et al., 1993; Stenesen et al., 2015).
As expected, both mutants selectively reduce on/off transients’ levels, the components in ERG that reflect synaptic transmission between photoreceptors and LMCs (Fig. 4Hi). Surprisingly, significant sleep defects were detected in the night instead of during the day. During the day, increased day sleep and bout length are found in hdc^JK910^ mutants as compared to the controls, whereas hdc^MB^ flies show comparable day sleep and bout length to the controls (Fig. 4Bi-ii and 4Di-ii). The waking activities in the day are similar between hdc mutants and controls (Fig. 4Ci-ii). During the night, both hdc mutants sleep less with shorter sleep bouts (Fig. 4Ei-ii and 4Gi-ii). Only hdc^JK910^ mutants have reduced waking activities compared to the controls at night (Fig. 4Fi-ii). Two histamine receptors, ort and HisCl1, are detected in Drosophila CNS, and they are both histamine-gated chloride channels (Pantazis et al., 2008). Transcriptomic data in Drosophila visual system suggests that ort is expressed selectively in neurons postsynaptic to photoreceptors, whereas HisCl1 is expressed almost exclusively in photoreceptors as auto-receptors (Davis et al., 2020). We therefore verified the sleep profile in ort mutants to investigate the role of histamine signal downstream to photoreceptors.
First, we monitored the sleep profile of the classic ort^1^ mutant against Canton S, as they share the same genetic backgrounds (Inoue et al., 1989). A small but significant day time sleep loss is detected in ort^1^ flies (Fig. 4Dii, effective size 0.27, Table 6). ort^1^ mutants sleep for longer bouts during the day but have higher day waking activity as compared to Canton S (Fig. 4Biii and 4Ciii). In contrast to hdc mutants, no night sleep phenotype is detected in ort^1^ flies (Fig. 4Eiii-4Giii). We also tested a recent CRISPR-mediated null mutation ort^attp^ in the white eye background (Deng et al., 2019). The sleep profile of ort^attp^ is distinct from ort^1^, showing more sleep as compared to control (Fig. 4Div and 4Giv). However, the waking activities of ort^attp^ are severely reduced (Fig. 4Civ and 4Fiv, effective size 0.55/0.60, Table 6) therefore compounding the observed sleep phenotype. Intriguingly, shorter day sleep bout length and a small reduction of night sleep are detected in ort^attp/+^ heterozygotes (Fig. 4Biv and 4Giv), accompanying improved waking activity (Fig. 4Civ and 4Fiv, waking activity ort^attp^ vs ort^attp/+^, Table 6).Table 5. Statistics of a. Sleep and b. ERG parameters for hdc mutants.Table 5a. Sleep parametergenotype comparisonp-valueeffect size rn1n2significant r magnitudeday sleephdc^MB^ vs iso1.10E-010.291616day sleephdc^JK910^ vs iso7.30E-050.602423largenight sleephdc^MB^ vs iso1.40E-020.441616moderatenight sleephdc^JK910^ vs iso4.99E-030.422423moderateday sleep bout lengthhdc^MB^ vs iso4.50E-010.141616day sleep bout lengthhdc^JK910^ vs iso1.08E-010.252423night sleep bout lengthhdc^MB^ vs iso1.50E-020.431616moderatenight sleep bout lengthhdc^JK910^ vs iso2.50E-060.662423largeday waking activityhdc^MB^ vs iso8.70E-010.031616day waking activityhdc^JK910^ vs iso2.50E-010.192423night waking activityhdc^MB^ vs iso5.60E-010.111616night waking activityhdc^JK910^ vs iso1.50E-060.682423largeb.ERG parametergenotype comparisonp-valueeffect size *rn1**n2significant r magnitudereceptor potentialiso* vs hdc^JK910^8.00E-010.243∗43∗4receptor potentialiso vs hdc^MB^4.00E-010.063∗43∗4receptor potentialhdc^JK910^ vs hdc^MB^3.80E-010.323∗43∗4on transientiso vs hdc^JK910^4.20E-050.723∗43∗4largeon transientiso vs hdc^MB^2.20E-040.793∗43∗4largeon transienthdc^JK910^ vs hdc^MB^9.32E-010.023∗43∗4off transientiso vs hdc^JK910^5.50E-050.853∗43∗4largeoff transientiso vs hdc^MB^2.20E-060.853∗43∗4largeoff transienthdc^JK910^ vs hdc^MB^4.80E-040.723∗43∗4largen1 = sample size for first genotype in genotype comparison; n2 = sample size for first genotype in genotype comparison; ∗ sample size in ERG statistic is actual sample size multiple with four reflecting the values from the four light intensities.Table 6. Statistics of a. Sleep and b. ERG parameters for ort mutants.Table 6a. Sleep parametergenotype comparisonp-valueeffect size rn1n2significant r magnitudeday sleepCanton S vs ort^1^5.20E-030.276047smallnight sleepCanton S vs ort^1^1.00E-010.166047day sleep bout lengthCanton S vs ort^1^2.60E-040.356047moderatenight sleep bout lengthCanton S vs ort^1^7.30E-010.046047day waking activityCanton S vs ort^1^1.10E-080.556047largenight waking activityCanton S vs ort^1^6.60E-010.036047day sleepiso vs ort^attp^4.10E-090.684829largeday sleepiso vs ort^attp/+^8.30E-010.024849day sleeport^attp^ vs ort^attp/+^4.50E-100.732949largenight sleepiso vs ort^attp^6.10E-090.674829largenight sleepiso vs ort^attp/+^1.50E-020.254849smallnight sleeport^attp^ vs ort^attp/+^5.50E-100.722949largeday sleep bout lengthiso vs ort^attp^6.20E-020.214829day sleep bout lengthiso vs ort^attp/+^1.80E-040.394849moderateday sleep bout lengthort^attp^ vs ort^attp/+^9.00E-070.552949largenight sleep bout lengthiso vs ort^attp^1.50E-020.324829moderatenight sleep bout lengthiso vs ort^attp/+^7.50E-020.204849night sleep bout lengthort^attp^ vs ort^attp/+^3.71E-010.102949day waking activityiso vs ort^attp^9.90E-070.554829largeday waking activityiso vs ort^attp/+^3.00E-020.224849smallday waking activityort^attp^ vs ort^attp/+^6.70E-050.452949moderatenight waking activityiso vs ort^attp^4.70E-080.604829largenight waking activityiso vs ort^attp/+^4.00E-030.294849smallnight waking activityort^attp^ vs ort^attp/+^3.00E-060.522949largeb.ERG parametergenotype comparisonp-valueeffect size *rn1**n2significant r magnitudereceptor potentialiso* vs ort^1^2.70E-080.835∗43∗4largereceptor potentialiso vs ort^attp^9.80E-010.015∗43∗4receptor potentialort^1^ vs ort^attp^1.10E-060.853∗43∗4largeon transientiso vs ort^1^9.30E-080.815∗43∗4largeon transientiso vs ort^attp^9.30E-080.815∗43∗4largeon transientort^1^ vs ort^attp^2.20E-010.263∗43∗4off transientiso vs ort^1^2.70E-080.835∗43∗4largeoff transientiso vs ort^attp^4.90E-060.835∗43∗4largeoff transientort^1^ vs ort^attp^7.90E-010.063∗43∗4n1 = sample size for first genotype in genotype comparison; n2 = sample size for first genotype in genotype comparison; ∗ sample size in ERG statistic is actual sample size multiple with four reflecting the values from the four light intensities.
Both ort mutants exhibit ERG profiles with loss of on/off transients, while ort^1^ mutants also show loss of the receptor potential (Fig. 4Hii).
Hyperpolarisation of Rh1-expressing photoreceptor causes short day sleep bout
3.3
Our findings so far indicate that seven of the eight phototransduction mutants exhibit day time sleep defects. However, day sleep loss in trpl^MB^ mutants do not correlate with ERG phenotypes. Moreover, norpA^p24^, trp^MB^, trpl^MB^, ort^attp/+^, and hdc mutants show sleep loss in the night. Thus, we further tested if direct inhibition of photoreceptor excitability causes sleep defects in the day or night. At first, we applied the Gal4-UAS system to block synaptic transmission from all photoreceptors by expressing UAS-TeTxLC (tetanus toxin light chain) with gmr-Gal4 (as seen in Damulewicz et al., 2020). However, we were not able to obtain viable adult flies even after maintaining the culture in 22^o^C to reduce the known overexpression-related toxicity (Rezával et al., 2007; Sweeney et al., 1995). We next used UAS-Kir2.1 (Baines et al., 2001; Nitabach et al., 2002) crossed with gmr-Gal4 or Rh1-Gal4 to hyperpolarise all or just Rh1-expressing photoreceptors. Consistent with the finding for ninaE and norpA mutants, gmr-Gal4>uas-Kir2.1 and Rh1-Gal4>uas-Kir2.1 flies showed reduced day sleep as compared to Gal4>+ or +>uas-Kir2.1 controls (Fig. 5Ai-ii, 5Di-ii), but only Rh1-Gal4>uas-Kir2.1 flies exhibit reduced sleep bout length in the day (Fig. 5Bi-ii). Night sleep parameters in both gmr-Gal4>uas-Kir2.1 and Rh1-Gal4>uas-Kir2.1 flies ranges between that of the controls (Fig. 5E–G). This is because the unexpected low sleep exhibited in +>uas-Kir2.1 controls (gmr-Gal4>+ vs +>uas-Kir2.1 and Rh1-Gal4>+ vs +>uas-Kir2.1; effect size 0.62/0.74, Table 7). Therefore, we cannot determine the actual effect of hyperpolarising photoreceptor on night sleep. Kir2.1 expressing flies had no changes in waking activity (Fig. 5C and F). Taken together, our data indicates that phototransduction and the neuronal excitability in the Drosophila Rh1-expressing outer photoreceptors promote day sleep.Table 7. Statistics of sleep parameters for gmrGal4>UAS-Kir2 and Rh1Gal4>UAS-Kir2 lines.Table 7sleep parametergenotype comparisonp-valueeffect size rn1n2significant r magnitudeday sleepgmr-Gal4>+ vs gmr-Gal4>UAS-Kir26.90E-030.363232moderateday sleepgmr-Gal4>+ vs +>UAS-Kir21.18E-010.203232day sleepgmr-Gal4>UAS-Kir2 vs +>UAS-Kir21.50E-040.513232largenight sleepgmr-Gal4>+ vs gmr-Gal4>UAS-Kir23.90E-010.113232night sleepgmr-Gal4>+ vs +>UAS-Kir22.10E-060.623232largenight sleepgmr-Gal4>UAS-Kir2 vs +>UAS-Kir23.80E-040.463232moderateday sleep bout lengthgmr-Gal4>+ vs gmr-Gal4>UAS-Kir28.80E-010.023232day sleep bout lengthgmr-Gal4>+ vs +>UAS-Kir26.00E-010.113232day sleep bout lengthgmr-Gal4>UAS-Kir2 vs +>UAS-Kir26.00E-010.123232night sleep bout lengthgmr-Gal4>+ vs gmr-Gal4>UAS-Kir22.70E-010.143232night sleep bout lengthgmr-Gal4>+ vs +>UAS-Kir21.14E-010.223232night sleep bout lengthgmr-Gal4>UAS-Kir2 vs +>UAS-Kir25.50E-020.303232day waking activitygmr-Gal4>+ vs gmr-Gal4>UAS-Kir29.73E-010.013232day waking activitygmr-Gal4>+ vs +>UAS-Kir27.10E-030.353232moderateday waking activitygmr-Gal4>UAS-Kir2 vs +>UAS-Kir27.10E-030.373232moderatenight waking activitygmr-Gal4>+ vs gmr-Gal4>UAS-Kir21.10E-040.503232moderatenight waking activitygmr-Gal4>+ vs +>UAS-Kir23.32E-020.293232smallnight waking activitygmr-Gal4>UAS-Kir2 vs +>UAS-Kir22.37E-010.153232day sleep*+>UAS-Kir2* vs Rh1-Gal4>+2.60E-020.292831smallday sleep+>UAS-Kir2 vs Rh1-Gal4>UAS-Kir21.10E-020.362830moderateday sleepRh1-Gal4>+ vs Rh1-Gal4>UAS-Kir22.00E-050.583130largenight sleep*+>UAS-Kir2* vs Rh1-Gal4>+4.90E-080.742831largenight sleep+>UAS-Kir2 vs Rh1-Gal4>UAS-Kir23.99E-030.382830moderatenight sleepRh1-Gal4>+ vs Rh1-Gal4>UAS-Kir29.40E-040.443130moderateday sleep bout length*+>UAS-Kir2* vs Rh1-Gal4>+8.74E-010.022831day sleep bout length+>UAS-Kir2 vs Rh1-Gal4>UAS-Kir26.60E-030.372830moderateday sleep bout lengthRh1-Gal4>+ vs Rh1-Gal4>UAS-Kir21.50E-030.443130moderatenight sleep bout length*+>UAS-Kir2* vs Rh1-Gal4>+6.70E-010.072831night sleep bout length+>UAS-Kir2 vs Rh1-Gal4>UAS-Kir24.40E-010.192830night sleep bout lengthRh1-Gal4>+ vs Rh1-Gal4>UAS-Kir26.70E-010.063130day waking activity*+>UAS-Kir2* vs Rh1-Gal4>+3.10E-040.482831moderateday waking activity+>UAS-Kir2 vs Rh1-Gal4>UAS-Kir24.40E-060.632830largeday waking activityRh1-Gal4>+ vs Rh1-Gal4>UAS-Kir29.60E-010.013130night waking activity*+>UAS-Kir2* vs Rh1-Gal4>+4.80E-070.622831largenight waking activity+>UAS-Kir2 vs Rh1-Gal4>UAS-Kir26.90E-080.682830largenight waking activityRh1-Gal4>+ vs Rh1-Gal4>UAS-Kir22.00E-010.173130n1 = sample size for first genotype in genotype comparison; n2 = sample size for first genotype in genotype comparison.
Discussion
4
Primary finding
4.1
In this study, we surveyed eight mutants with defects in phototransduction, four mutants with disrupted histaminergic transmission, the main neurotransmitter used by Drosophila photoreceptors, and two mutants with hyperpolarised photoreceptors. We observed short or fragmented day sleep in the majority of the phototransduction mutants as well as in mutants with hyperpolarised R1-R6 photoreceptors. This data indicates that R1-R6 photoreceptor neural activities are required for sleep homeostatic drive during the daytime. Importantly, the mutants tested in this study maintain their ability to sense light, as the non-visual pathways such as cry, Rh7 and qsm remain intact. Nevertheless, we show robustly that reduced visual phototransduction, or downstream neurotransmission, cause sleep loss and/or sleep fragmentation, indicating a clear role for Drosophila photoreceptors R1-R6 in promoting day sleep.
Contradiction to previous studies
4.2
Our data contradicts previous findings. Specifically, it was previously shown that blocking neural transmission for R1-R6 photoreceptors via TeTxLC caused day sleep increase (Damulewicz et al., 2020). As mentioned above, we cannot produce viable adult flies that express TeTxLC in photoreceptors and instead we applied Kir2 channel to hyperpolarise retinal photoreceptors. There may be two factors that explain the data discrepancy between the two studies: Firstly, our Gal4 and UAS lines are outcrossed to the w^iso31^ background, as is standard in the sleep research field, while such outcrossing was not described in Damulewicz et al. (2020). Secondly, vision is important for navigation, and the compromised vision in phototransduction mutants and flies with weakened photoreceptor outputs (i.e., gmr-Gal4>UAS-kir2 or gmr-Gal4>UAS-TeTxLC) can result in reduced waking locomotor activities, which is a major confounding factor in assessing sleep increase. In fact, eight visual mutants in our survey (ninaE^5^, ninaE^8^, norpA^p24^, trp^1^, trpl^302^, hdc^JK910^, ort^attp^ and gmr-Gal4>uas-kir2) showed significant reduced waking activity in either day and/or night. Consequentially, the reduced waking activity prevents us from concluding whether the increased night sleep seen in ninaE^8^, trpl^302^ and ort^attp^ are genuine increases or a reflection of loss of locomotion during wakefulness. Therefore, these night sleep increase phenotypes should be interpreted with caution. The waking activity was not analysed by Damulewicz et al. (2020) preventing direct comparison here.
More surprisingly, the sleep loss identified in hdc and ort mutants is also opposite to previous findings indicating that histamine is a pro-waking factor (Oh et al., 2013). One major difference between the current study and Oh et al. (2013) is that we only monitored male sleep to reach a larger range of sleep dynamics. Importantly, female flies have very low levels of day sleep (see 2.2 in Materials and method). As mentioned, further investigations of female visual mutants are necessary before it can be determined if the role of visual input to sleep diverges between male and female flies. Nevertheless, as shown in our data, two of the four mutants with histaminergic disruption show lower waking activity, consistent with the proposed arousal promoting role of histamine (Oh et al., 2013). However, we note that the mentioned previous study (Oh et al., 2013) also did not assess the impact of waking activity on sleep. Waking activity is a classic, but often ignored, analytical tool in Drosophila sleep research that allows differentiation between sleep and locomotor defects: as we demonstrate in this study, when the flies exhibit reduced locomotor activity, any increase in sleep cannot be certain. We therefore recommend that this parameter always be included in any locomotion-based sleep assay.
Experimental limitations
4.3
The unexpected abnormal low night sleep in +>uas-Kir2 control flies which is likely due to leaky expression of Kir2 in other parts of the fly brain, since the gmr-Gal4 and UAS-Kir2 lines are isogenised to w^iso31^ background. Nevertheless, this limits our investigation to day sleep. Future investigation using gmr-LexA and LexAoP-Kir2 may be required to verify this finding.
The visual mutants tested in this study come with various genetic backgrounds including unknown white backgrounds and two wild type backgrounds (see Materials and methods). We therefore only interpreted the consistent phenotypes presented across the alleles. As such, there are allelic specific night sleep loss phenotypes in in trp^MB^, trpl^MB^, ort^attp/+^ and norpA^p24^ that is likely due to genetic background and should be interpreted with caution.
As part of control experiments, we examined the ERG profiles for all the tested gene-specific mutants. However, the severity of sleep loss phenotype does not directly correlate with ERG defects except for trp mutants: the weakest ninaE^5^ mutant (only on transient reduction was detected) showed just as much day sleep fragmentation as ninaE^8^, ninaE^17^ or norpA^p24^. Moreover, both trpl^302^ and trpl^MB^ exhibit sleep loss, despite minor or no impact of trpl mutants on ERG profile. The divergent sleep phenotypes may be partly due to the various genetic backgrounds that we did not control for (see Materials and methods). Moreover, it is important to note that ERG only reflects outer-retina physiology, not downstream optic-lobe integration. Therefore, the inconsistent sleep phenotypes can also be derived from the expression profile of phototransduction genes in the central brain beyond the photoreceptors. Future investigation utilising isogenised somatic CRISPR knockout constructs will be required to verify potential impacts of genetic background on the identified sleep-controlling role of phototransduction.
Hypothetical mechanisms underlying day and night sleep
4.4
Vision and light-affected sleep are mediated both via circadian clock neurons (eg., LNvs and DN1) as well as by ring neurons in the EB (Lamaze et al., 2018; Raccuglia et al., 2019; Shang et al., 2008; Singh et al., 2023). Various neural pathways connect photoreceptors to the wake promoting LNv: R1-R6 photoreceptors propagate the light signal via histamine-mediated inhibition of the downstream LMC neurons that activates LNvs (Muraro and Ceriani, 2015); on the other hand, R8 has recently been shown to communicate with LNv via the so-called AMA neurons and cholinergic signalling. Moreover, sleep promoting signals from photoreceptors may also reach the EB via the Anterior Visual Pathway through MeTu and TuBu neurons, upon which circadian clock neuron DN1 also converge (Guo et al., 2018; Lamaze et al., 2018). It is currently unclear which of the above pathways are required for the photoreceptor mediated day sleep promotion (Fig. 6).Fig. 6Speculative mechanism underlying visually driven day and night sleep. R1-R6 photoreceptors (blue) promote day sleep by inhibiting a subset of wake promoting lamina monopolar cells (LMC) via histamine release (his, blue text) and ort reception (green text); Night sleep is controlled by interaction between R1-R6, R7 and R8 (blue/orange) photoreceptors: Hypothetical histaminergic inhibition (his, blue text) from R1-R6 to R8 is mediated by HisCl1 (magenta text) (Alejevski et al., 2019). Separately R7 and R8 also inhibit each other via histaminergic signalling (Schnaitmann et al., 2018), these inhibitions maintain a slower suppression of acetylcholine release (ace, orange text) from R8 and its activation of the AMA neurons (orange) and downstream waking promoting LNvs (red circle). Alternatively, R8 regulate night sleep by reaching sleep-regulating EB-Ring neurons (EB-R) via MeTu and TuBu neurons with unknown neurotransmitters (grey rectangular and arrows).Fig. 6
Although day sleep loss in ort^1^, ninaE mutants and Rh1-Gal4>uas-Kir2 indicates that day sleep depends on Rh1-positive R1-R6-mediated histaminergic inhibition on LMC neurons, we did not observe day sleep loss among hdc mutants. Nevertheless, hdc expression is wider than the visual system (Oh et al., 2013). Moreover, loss of hdc activity does not completely remove histamine production (eg., Stenesen et al., 2015) and it is not equal to selective blockage of ort-mediated histamine postsynaptic transmission. However, our findings are consistent with those that previously found a visually impaired omb mutant showed major sleep loss in both day and night (Kirszenblat et al., 2019) as well as the finding that activation of L2 LMC neurons cause day sleep lost (Muraro and Ceriani, 2015). Moreover, our data fit well with previous studies predicting that medium intensity light convey a day sleep signal via retinal photoreceptors, whereas high intensity light enhances midday sleep via HB-eyelet (Schlichting et al., 2019). Future orthogonal circuit-manipulation experimentation is required to verify if the R1-R6 photoreceptors-mediated day sleep depends on L2 LMC and/or LNvs (Fig. 6).
Six tested mutants also exhibit night sleep loss (two hdc mutants, norpA^p24^, trp^1^, trp^MB^ and trpl^MB^). Genetic background variation may contribute to this night sleep loss. However, both hdc mutants exhibit clear night specific sleep loss and hdc^MB^ mutants are in an isogenic w^iso31^ background. Therefore, this night sleep loss is likely genuine. Day time visual experience influence night sleep in flies despite there is no or limited vision in the darkness of the night. There are three possible explanations for night sleep loss in hdc mutants: 1. Night sleep loss can simply be caused by non-retinal photoreceptor histaminergic neurons and is mediated by HisCl1 reception instead of ort (Oh et al., 2013). 2. Reduction of photoreceptor-mediated histamine results in uneven inhibition among LMCs to reduce the visual contrast of bright/dark edges and differentially reduce activation of HS/VS neurons which are known to promote night sleep (Kirszenblat et al., 2019). 3. The hdc-mediated night sleep is related to the reduced histaminergic inhibition in non-LMC neurons mediated by HisCl1 and is independent of ort. Previous data indicates that HisCl1 is an auto-receptor for all retinal photoreceptors, and also expresses in glia cells in the optic lobe as well as clock neurons lLNvs (Davis et al., 2020; Oh et al., 2013; Pantazis et al., 2008). Among retinal photoreceptors, R8 has been proposed to receive histaminergic inhibition via HisCl1 to regulate its acetylcholine co-release (Alejevski et al., 2019; Xiao et al., 2023). Loss of this inhibition can result in an ectopic increase in acetylcholine, which can in turn activate the newly identified AMA (Xiao et al., 2023) and its downstream wake promoting lLNvs (Shang et al., 2008). Alternatively, R8 can reach sleep/wake promoting EB-R via anterior visual pathways (Fig. 6).
The potential demarcation between achromatic (R1-R6) and chromatic (R8, both blue and green sensitive) photoreceptors in their control over day and night sleep (Fig. 6) bears some resemblance with the previous finding in mammalian system, where the sleep-vs wake-promoting effects of green and blue light required proper neural output from rod/cone and the melanopsin expressing photosensitive retinal ganglion cells (Pilorz et al., 2016). Nevertheless, the revelation of the potential neural network demarcation of day and night sleep in Drosophila require further investigation to expand our understandings in circuital logic of light-mediated sleep regulation.
CRediT authorship contribution statement
K.-F.C. – Conceptualization, Methodology, Investigation, Writing – Original Draft, Writing – Review & Editing, Visualization, Supervision, Project administration, Funding acquisition. Y.-C.H. – Investigation, Visualization, Writing – Review & Editing. B.W. – Methodology, Investigation, Writing – Review & Editing. M.A., X.L., N.S., S.H., T.O., J.A., and C.S.-G. – Investigation, Writing – Review & Editing.
Declaration of competing interest
The authors declare no competing interests.
The reference list from the paper itself. Each links out to its DOI / PubMed record.
- 1Alejevski F.Saint-Charles A.Michard-Vanhee C.Martin B.Galant S.Vasiliauskas D.Rouyer F.The His Cl 1 histamine receptor acts in photoreceptors to synchronize Drosophila behavioral rhythms with light-dark cycles Nat. Commun.10201925210.1038/s 41467-018-08116-730651542 PMC 6335465 · doi ↗ · pubmed ↗
- 2Alphen B. van Semenza E.R.Yap M.Swinderen B. van Allada R.A deep sleep stage in Drosophila with a functional role in waste clearance Sci. Adv.72021 eabc 299910.1126/sciadv.abc 299933523916 PMC 7817094 · doi ↗ · pubmed ↗
- 3Altimus C.M.Güler A.D.Villa K.L.Mc Neill D.S.Le Gates T.A.Hattar S.Rods-Cones and Melanopsin Detect Light and Dark to Modulate Sleep Independent of Image Formation 1052008 Proceedings of the National Academy of Sciences 199982000310.1073/pnas.0808312105 PMC 259674619060203 · doi ↗ · pubmed ↗
- 4Andretic R.Shaw P.J.Essentials of sleep recordings in drosophila: moving beyond sleep time Young M.W.Methods in Enzymology, Circadian Rhythms 2005 Academic Press 75977210.1016/S 0076-6879(05)93040-115817323 · doi ↗ · pubmed ↗
- 5Baines R.A.Uhler J.P.Thompson A.Sweeney S.T.Bate M.Altered electrical properties in Drosophila Neurons developing without synaptic transmission J. Neurosci.2120011523153110.1523/JNEUROSCI.21-05-01523.200111222642 PMC 6762927 · doi ↗ · pubmed ↗
- 6Burg M.G.Sarthy P.V.Koliantz G.Pak W.L.Genetic and molecular identification of a Drosophila histidine decarboxylase gene required in photoreceptor transmitter synthesis EMBO J.12199391191910.1002/j.1460-2075.1993.tb 05732.x 8096176 PMC 413291 · doi ↗ · pubmed ↗
- 7Chen K.F.Lowe S.Lamaze A.Kratschmer P.Jepson J.Neurocalcin regulates nighttime sleep and arousal in Drosophilae Life 8201910.7554/e Life.38114 PMC 641593930865587 · doi ↗ · pubmed ↗
- 8Chen K.F.Peschel N.Zavodska R.Sehadova H.Stanewsky R.QUASIMODO, a Novel GPI-anchored zona pellucida protein involved in light input to the Drosophila circadian clock Curr. Biol.2120117197292153026110.1016/j.cub.2011.03.049 · doi ↗ · pubmed ↗