Early Diagnosis of Glaucoma By Optical Coherence Tomography: A Systematic Review and Network Meta-analysis
Azadeh Doozandeh, Mohammadmehdi Hatami, Zahra Khorrami, Ali Sadatmoosavi, Mohammad Farjami, Ghazale Soltani

TL;DR
This study compares OCT parameters for early glaucoma detection and finds combining them with AI could improve accuracy.
Contribution
A network meta-analysis comparing OCT-derived parameters for early glaucoma diagnosis, suggesting combined use with AI for better accuracy.
Findings
Average and inferior RNFL parameters achieved the highest diagnostic accuracy (0.77) for glaucoma detection.
Combining OCT parameters with artificial intelligence could significantly enhance early glaucoma detection accuracy.
Diagnostic accuracy was comparable across peripapillary RNFL, macular metrics, and optic nerve head parameters.
Abstract
Optical coherence tomography (OCT) diagnostic technology is increasingly being integrated into clinical practice and is evolving rapidly. Performing a meta-analysis of these advancements can provide valuable insights to clinicians and healthcare decision-makers and help identify gaps that need further research and development. We conducted a systematic review and network meta-analysis (NMA) comparing the diagnostic accuracy of three key OCT-derived parameters in identifying early glaucoma: peripapillary retinal nerve fiber layer (RNFL) thickness, macular metrics, and optic nerve head (ONH) characteristics. We systematically searched PubMed, Embase, Web of Science, and Scopus for studies published from January 2004 through March 2024, and identified 47 eligible studies. These studies comprised 12,723 eyes from 8177 participants, including patients with mild primary open-angle glaucoma,…
Genes, proteins, chemicals, diseases, species, mutations and cell lines named across the full text — each resolved to its canonical identifier and authoritative record.
Click any figure to enlarge with its caption.
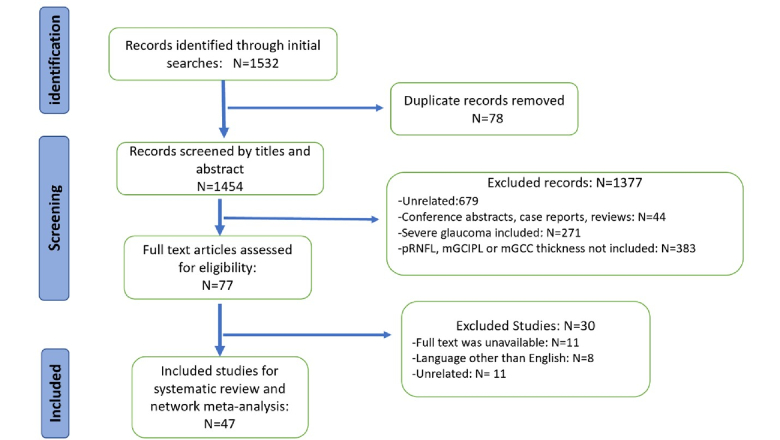 Figure 1
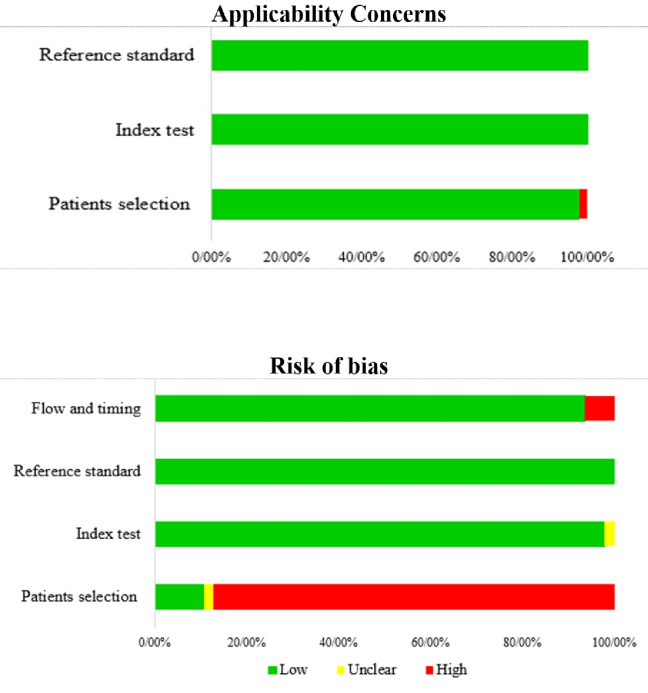 Figure 2
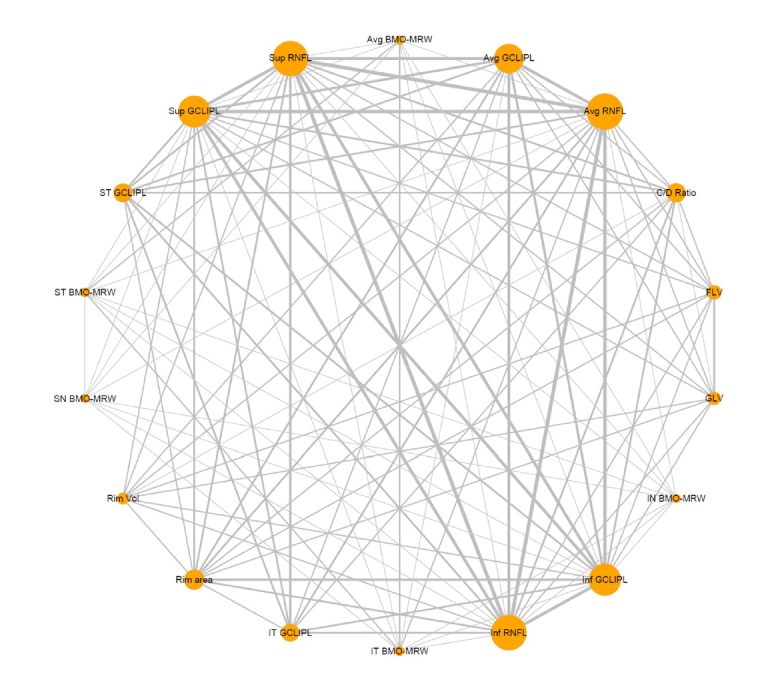 Figure 3
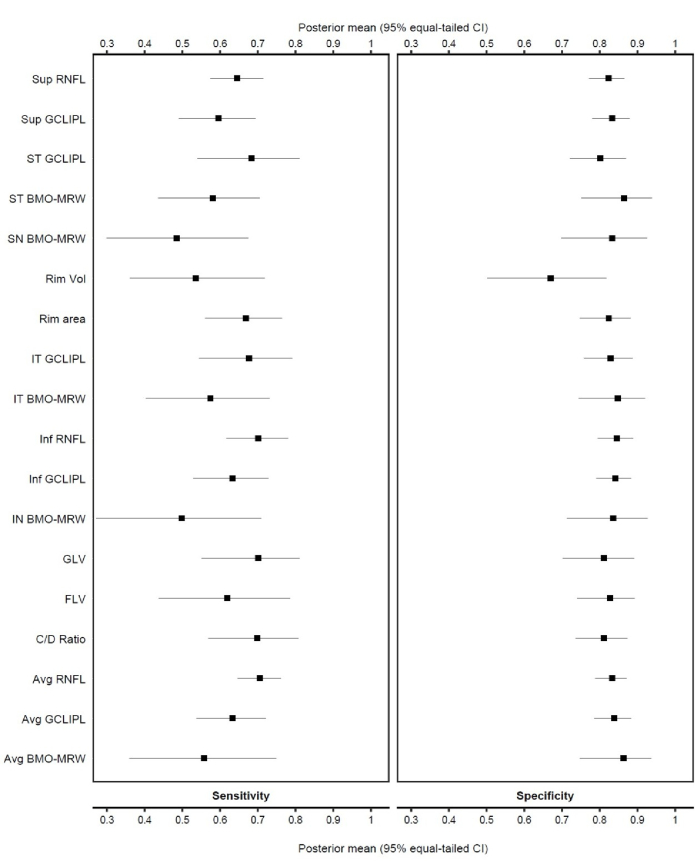 Figure 4
|
|
|
|
|
|
|
|
|
|
| Nouri-Mahdavi et al 2004[ | USA | Observational case control | 151 | Mild glaucoma + control | 66 | M = 50 F = 101 | 2000 OCT | pRNFL (average + sectors) |
| Leung et al 2009[ | China | Cross-sectional | 223 | POAG + control | 54 | Unknown | Cirrus | pRNFL (average + sectors) |
| Li et al 2009[ | China | Cross-sectional | 141 | Mild to advanced glaucoma + control | 51.05 | M = 81 F = 60 | RTVue-100 | pRNFL (average, sup, inf) CDR, disc area, rim area, cup area, rim volume |
| Garas et al 2010[ | Hungary | Cross-sectional | 286 | OHTN + pre-perimetric + mild glaucoma + control | 57.6 | M = 126 F = 160 | RTVue-100 | pRNFL (average + sectors) GCLIPL (average + sectors + FLV) CDR, rim area |
| Rao et al 2010[ | USA | Case-control | 214 | POAG + control | 68.3 | Unknown | RTVue-100 | pRNFL (average + sectors) GCC (average + sectors + GLV + FLV) CDR, rim area, rim volume, disc area |
| Moreno et al 2011[ | Brazil | Cross-sectional | 123 | Mild glaucoma + control | 64.3 | M = 49 F = 74 | RTVue-100 | pRNFL (average + sectors) GCLIPL (average + sectors) |
| Nakatani et al 2011[ | Japan | Cross-sectional | 64 | Pre-perimetric glaucoma + control | 61.5 | M = 33 F = 31 | Topcon | pRNFL (average + sectors) Macular thickness |
| Sung et al 2012[ | South Korea | Cross-sectional | 743 | Pre-perimetric + mild glaucoma + control | 53.1 | Male = 322 Female = 421 | Cirrus | pRNFL (average, sectors) CDR, rim area, and volume |
| Wu et al 2012[ | USA | Cross-sectional | 146 | POAG + control | 69.2 | M = 60 F = 86 | Spectralis | pRNFL (average + sectors) |
| Lisboa et al 2012[ | USA | Observational cohort | 134 | Glaucoma suspect | 66.1 | M = 52 F = 82 | Spectralis | pRNFL (average, sectors) CDR, rim area, and volume |
| Akashi et al 2013[ | Japan | Cross-sectional | 232 | POAG + control | 48.3 | M = 102 F = 130 | Cirrus + RTVue + Topcon | pRNFL (average + sectors) GCLIPL (average + sectors) |
| Lisboa et al 2013[ | USA | Cohort | 142 | Glaucoma suspect | 65.9 | M = 53 F = 89 | RTVue-100 | pRNFL (average + sectors) GCLIPL (average + sectors + GLV + FLV) CDR, rim area, rim volume, disc area, cup area |
| Rao et al 2013[ | India | Cross-sectional | 106 | Pre-perimetric glaucoma + control | 54 | Unknown | RTVue-100 | pRNFL (average + sectors) GCLIPL (average + sectors + GLV + FLV) CDR, rim area, rim volume, disc area, cup area |
| Kanamori et al 2013[ | Japan | Cross-sectional | 179 | Pre-perimetric glaucoma + mild glaucoma + control | 49.9 | M = 80 F = 99 | Topcon | pRNFL (average + sectors) GCLIPL (average + sectors) |
| Arintawati et al 2013[ | Japan | Cross-sectional | 261 | Pre-perimetric glaucoma + mild to advanced glaucoma + control | 58.9 | M = 112 F = 149 | RTVue-100 | pRNFL (average + sectors) GCC (average + sectors + GLV + FLV) |
| Nouri-Mahdavi et al 2013[ | USA | Cross-sectional | 150 | POAG + control | 66.1 | M = 56 F = 94 | Cirrus | pRNFL (average + sectors) GCLIPL (average + sectors) |
| Sullivan-Mee et al 2013[ | Mexico | Cross-sectional cohort | 200 | Mild glaucoma + control | 68.9 | M = 190 F = 10 | Spectralis | pRNFL (average+ sectors) macular thickness |
| Sung et al 2014[ | South Korea | Cross-sectional | 179 | Pre-perimetric glaucoma + mild glaucoma + control | 54.22 | M = 99 F = 80 | Cirrus | pRNFL (average + sectors) GCLIPL (average + sectors) |
| Begum et al 2014[ | India | Cross-sectional | 136 | Pre-perimetric glaucoma + perimetric glaucoma + control | 47 | Unknown | Cirrus | pRNFL (average + sectors) GCLIPL (average + sectors) CDR, rim area, rim volume |
| Yamada et al 2014[ | Japan | Retrospective case control | 122 | Pre-perimetric glaucoma + mild to advanced glaucoma + control | 56.9 | M = 69 F = 53 | Spectralis | pRNFL GCC |
| Hwang et al 2015[ | South Korea | Cross-sectional | 446 | Pre-perimetric glaucoma + mild, moderate, advanced POAG + control | 51.7 | Unknown | Cirrus | GCLIPL (average + sectors) |
| Yang et al 2015[ | USA | Cross-sectional case-control | 210 | POAG + control | 71.4 | M = 99 F = 111 | Topcon | pRNFL (average + sectors) |
| Kim et al 2015[ | South Korea | Cross-sectional | 227 | Pre-perimetric glaucoma + mild glaucoma + control | 54.6 | M = 112 F = 115 | Cirrus | pRNFL (average + sectors) GCLIPL (average + sectors) |
| Gmeiner et al 2016[ | Germany | Cross-sectional | 181 | OHTN + pre-perimetric glaucoma + mild glaucoma + control | 62.8 | M = 84 F = 97 | Spectralis (GMPE) | pRNFL (average + sectors) BMO-MRW (average + sectors) |
| Gracitelli et al 2016[ | Brazil | Cross-sectional | 155 | POAG + NTG + control | 62.5 | M = 75 F = 80 | RTVue-100 | pRNFL (average + sectors) GCC (average + sectors) |
| Lee et al 2016[ | South Korea | Prospective cross-sectional | 120 | POAG + control | 59.9 | M = 53 F = 67 | Spectralis + Topcon | pRNFL (average + sectors) GCLIPL (average + sectors) |
| Kim et al 2016[ | South Korea | Cross-sectional | 136 | POAG + control | 60 | M = 65 F = 71 | Spectralis + SLO | pRNFL (average + sectors) GCLIPL (average + sectors) GCC |
| Aydoğan et al 2017[ | Turkey | Cross-sectional | 326 | OHTN + pre-perimetric glaucoma + mild glaucoma + control | 48.76 | M = 114 F = 212 | RTVue-100 | pRNFL (average + sectors) GCLIPL (average + sectors + GLV + FLV) CDR, rim area, rim volume |
| Lee et al 2017[ | South Korea | Cross-sectional | 184 | Pre-perimetric glaucoma + mild glaucoma + control | 58.23 | Unknown | Topcon | pRNFL (average + sectors) GCLIPL (average + sectors) |
| Xu et al 2017[ | China | Cross-sectional | 703 | POAG + OHTN + glaucoma suspect + Control | 46.6 | M = 352 F = 351 | Cirrus | pRNFL (average + sectors) GCLIPL (average + sectors) CDR, rim area, rim volume |
| Kim et al 2017[ | South Korea | Cross-sectional | 132 | Mild glaucoma + Control | 59.2 | M = 43 F = 89 | Spectralis | pRNFL (average + sectors) GCLIPL (average + sectors) |
| Dagdelen et al 2018[ | Turkey | Cross-sectional | 260 | POAG + OHTN + control | 59.31 | Unknown | Cirrus | pRNFL (average + sectors) CDR, rim area, rim volume, disc area |
| Deshpande et al 2019[ | India | Retrospective cross-sectional | 337 | Pre-perimetric glaucoma + mild glaucoma + control | 57.67 | M = 181 F = 156 | Cirrus | pRNFL (average + sectors) GCLIPL (average + sectors) |
| Stagg et al 2019[ | USA | Observational cohort | 113 | Glaucoma suspect | 67.1 | M = 43 F = 70 | Spectralis | pRNFL (average + sectors) BMO-MRW (average + sectors) |
| Abrol et al 2020[ | India | Cross-sectional | 1380 | Pre-perimetric glaucoma + mild POAG + control | 54.76 | M = 728 F = 652 | Cirrus | pRNFL (average + sectors) GCLIPL (average + sectors) |
| Aquino et al 2020[ | Philippines | Retrospective cross-sectional | 96 | Mild glaucoma + glaucoma suspect + control | 61.55 | M = 46 F = 50 | Cirrus | pRNFL (average + sectors) GCLIPL (average + sectors) |
| Chua et al 2020[ | Singapore | Cross-sectional | 846 | Mild, moderate, advanced POAG + control | 65 | M = 567 F = 279 | Cirrus | pRNFL (average + sectors) GCLIPL (average + sectors) |
| Taia et al 2020[ | Taiwan | Observational cohort | 78 | Pre-perimetric glaucoma + control | 56.4 | Unknown | Cirrus | pRNFL (average + sectors) GCLIPL (average + sectors) CDR, rim area, rim volume, disc area |
| Deshpande et al 2021[ | India | Retrospective cross-sectional | 138 | Pre-perimetric glaucoma + control | 54.29 | M = 58 F = 80 | Cirrus | pRNFL (average + sectors) GCLIPL (average + sectors) CDR, rim area |
| Bak et al 2022[ | South Korea | Cross-sectional | 196 | Mild glaucoma + control | 66.1 | Unknown | Cirrus | pRNFL (average + sectors) GCLIPL (average + sectors) CDR, rim area |
| Zangalli et al 2022[ | Brazil | Cross-sectional | 273 | Mild and moderate glaucoma + control | 64 | M = 109 F = 164 | Spectralis | pRNFL (average + sectors) BMO-MRW (average + sectors) |
| Yusof et al 2022[ | Malaysia | Cross-sectional | 127 | Pre-perimetric glaucoma + mild glaucoma + control | 65 | M = 51 F = 76 | Spectralis (GMPE) | pRNFL (average + sectors) GCLIPL (average + sectors) BMO-MRW (average, sectors) |
| Choe et al 2023[ | South Korea | Cross-sectional | 144 | Pre-perimetric glaucoma + mild glaucoma + control | 59.3 | M = 66 F = 78 | Cirrus + Spectralis | pRNFL GCLIPL |
| Mahmoudinezhad et al 2023[ | USA | Cross-sectional | 260 | POAG + glaucoma suspect + control | 53.1 | M = 101 F = 149 | Spectralis (GMPE) | GCLIPL |
| Wu et al 2023[ | China | Cross-sectional | 394 | Mild glaucoma ( POAG, PACG, NTG) + glaucoma suspect + control | 42-71 | M = 175 F = 219 | Spectralis (GMPE) | pRNFL GCLIPL BMO-MRW |
| Abera et al 2023[ | Ethiopia | Cross-sectional | 188 | POAG + glaucoma suspect + control | 58 | M = 98 F = 90 | Cirrus | pRNFL (average + sectors) GCLIPL (average + sectors) |
| Yadav et al 2024[ | India | Cross-sectional | 60 | Pre-perimetric glaucoma + control | 36.97 | M = 33 F = 27 | Topcon | pRNFL (average + sectors) GCLIPL (average + sectors) VCDR |
| pRNFL, peripapillary retinal nerve fiber layer; GCIPL, ganglion cell plus inner plexiform layer; GCC, ganglion cell complex; FLV, focal loss volume; GLV, global loss volume; CDR, cup to disc ratio; BMO-MRW, Bruch's membrane opening-minimum rim width; OHTN, ocular hypertension; POAG, primary open-angle glaucoma; PACG, primary angle closure glaucoma; NTG, normal tension glaucoma; PPG, pre-perimetric glaucoma. | ||||||||
|
|
|
|
|
|
|
|
| Inf RNFL | 7269 | 35 | 0.70 (0.62, 0.78) | 0.85 (0.80, 0.89) | 0.77 | 13.57 (8.69 to 20.73) |
| Avg RNFL | 9025 | 41 | 0.71 (0.65, 0.76) | 0.83 (0.79, 0.87) | 0.77 | 12.37 (9.22 to 16.20) |
| GLV | 1049 | 5 | 0.70 (0.55, 0.81) | 0.81 (0.70, 0.89) | 0.76 | 11.67 (5 to 21.22) |
| C/D ratio | 2488 | 10 | 0.70 (0.57, 0.81) | 0.81 (0.74, 0.87) | 0.75 | 10.76 (6.22 to 16.98) |
| IT GCLIPL | 3015 | 13 | 0.68 (0.54, 0.79) | 0.83 (0.76, 0.89) | 0.75 | 11.11 (6.03 to 18.09) |
| Rim area | 2899 | 11 | 0.67 (0.56, 0.76) | 0.82 (0.75, 0.88) | 0.75 | 10.24 (5.51 to 16.65) |
| ST GCLIPL | 2387 | 11 | 0.68 (0.54, 0.81) | 0.80 (0.72, 0.87) | 0.74 | 9.64 (5.21 to 15.86) |
| Inf GCLIPL | 6509 | 27 | 0.63 (0.53, 0.73) | 0.84 (0.79, 0.88) | 0.74 | 9.53 (6.43 to 13.48) |
| Avg GCLIPL | 6805 | 29 | 0.63 (0.54, 0.72) | 0.84 (0.79, 0.88) | 0.74 | 9.32 (6.57 to 12.66) |
| Sup RNFL | 7230 | 35 | 0.65 (0.57, 0.71) | 0.82 (0.77, 0.86) | 0.73 | 8.68 (6.72 to 10.95) |
| FLV | 1049 | 5 | 0.62 (0.44, 0.79) | 0.83 (0.74, 0.89) | 0.72 | 8.91 (4.12 to 15.79) |
| ST BMO-MRW | 694 | 4 | 0.58 (0.44, 0.70) | 0.86 (0.75, 0.94) | 0.72 | 10.56 (4.16 to 20.17) |
| Sup GCLIPL | 6509 | 27 | 0.60 (0.49, 0.69) | 0.83 (0.78, 0.88) | 0.71 | 7.65 (5.28 to 10.56) |
| IT BMO-MRW | 694 | 4 | 0.57 (0.40, 0.73) | 0.85 (0.75, 0.92) | 0.71 | 9.07 (3.45 to 18.43) |
| Avg BMO-MRW | 694 | 4 | 0.56 (0.36, 0.75) | 0.86 (0.75, 0.94) | 0.71 | 10.41 (3.15 to 22.53) |
| IN BMO-MRW | 694 | 4 | 0.50 (0.27, 0.71) | 0.84 (0.71, 0.93) | 0.67 | 6.33 (2.09 to 13.47) |
| SN BMO-MRW | 694 | 4 | 0.49 (0.30, 0.68) | 0.83 (0.70, 0.93) | 0.66 | 5.76 (2.0 to 11.86) |
| Rim vol | 823 | 4 | 0.54 (0.36, 0.72) | 0.67 (0.50, 0.82) | 0.60 | 2.95 (0.93 to 6.76) |
| 95% CI, 95% confidence interval, | ||||||
Peer Reviews
No public reviews on file for this paper yet. If you reviewed it on a platform where reviews are public (OpenReview, ICLR, NeurIPS, ICML), you can paste yours below so the community can read it here.
Videos
No videos yet. Explain this paper in a talk, walkthrough, or lecture? Add one.
Taxonomy
TopicsGlaucoma and retinal disorders · Retinal Imaging and Analysis · Retinal Diseases and Treatments
INTRODUCTION
Glaucoma is the leading cause of irreversible blindness worldwide. However, timely intervention can significantly improve its prognosis.^[1,2,3]^ With global population aging, the prevalence of glaucoma is expected to rise, especially among older adults.^[4]^ Early detection is essential for slowing disease progression through intraocular pressure–lowering therapies and for improving quality of life.^[5]^
Early glaucoma is typically asymptomatic, making diagnosis highly dependent on the clinician's vigilance during routine eye examinations.^[6]^ Alarmingly, many cases remain undetected even in specialized ophthalmic centers,^[6,7,8]^ largely due to limitations of conventional diagnostic tools.
Glaucoma is characterized by progressive degeneration of retinal ganglion cells (RGCs) and their axons, which form the retinal nerve fiber layer (RNFL), accompanied by structural changes in the optic nerve head (ONH) and corresponding visual field (VF) loss.^[9]^ Despite the availability of functional (e.g., perimetry) and structural (e.g., ophthalmoscopy) diagnostic modalities, distinguishing normal anatomical variability from early glaucomatous damage remains challenging.^[10]^
Optical coherence tomography (OCT) has emerged as an indispensable tool for glaucoma assessment, providing objective, quantitative measurements of retinal and ONH morphology. Among its metrics, circumpapillary RNFL thickness—a surrogate for RGC axon density—is a cornerstone of glaucoma evaluation.^[11]^ Recent advances, such as artificial intelligence (AI)-based probability maps, have enhanced the sensitivity of RNFL analysis.^[12,13]^
Beyond RNFL, spectral-domain OCT enables precise layer-specific imaging of macular structures, where approximately half of all RGCs reside.^[14]^ OCT-derived ONH parameters, such as minimum rim width (MRW), rim area (RA) and neuroretinal rim volume offer complementary information on neuroretinal integrity.
While meta-analyses have demonstrated high sensitivity and specificity of OCT parameters for moderate and advanced glaucoma,^[11]^ the diagnostic accuracy of OCT in early disease remains limited because subtle structural alterations at this stage often fall within the range of measurement variability. Furthermore, previous reviews have noted substantial heterogeneity across studies in terms of population characteristics, diagnostic criteria, and OCT device versions.^[15,16,17]^
This network meta-analysis (NMA) evaluates the diagnostic accuracy of peripapillary RNFL, macular ganglion cell complex (GCC), and ONH parameters across various OCT platforms [Supplementary Material 1]. By synthesizing evidence from diverse clinical cohorts, we aim to clarify discrepancies, identify early biomarkers, and provide practical guidance for clinical decision-making.
While pairwise meta-analysis is useful for direct comparisons, NMA enables simultaneous comparison of multiple diagnostic modalities, offering a more comprehensive understanding of relative performance.^[18]^ To our knowledge, this is the first NMA to simultaneously compare the diagnostic performance of multiple OCT parameters across different acquisition protocols within a unified analytical framework.
METHODS
Study Design
This systematic review and NMA adhered to the guidelines of the Preferred Reporting Items for Systematic Reviews and Meta-Analyses (PRISMA). The PRISMA statement consists of a 27-item checklist and a four-phase flow diagram.^[19]^ Two investigators (MH and AD) were independently responsible for screening the titles, abstracts, and full-text studies and performing data extraction. Any disagreement was resolved either by a third independent reviewer (ZK) or through discussion.
Literature Search
We conducted a comprehensive search in PubMed, Embase, Web of Science, and Scopus for studies published between January 2004 and March 2024. Search strategies were tailored for each database [Supplementary Material 2], and reference lists of included studies were also screened.
Inclusion and Exclusion Criteria
We excluded studies on patients with moderate to advanced glaucoma. Eligible studies were required to be original research articles published between January 2004 and March 2024. They had to include participants aged 40-80 years diagnosed with ocular hypertension, pre-perimetric glaucoma (PPG), and mild primary open-angle glaucoma (POAG), all defined using consistent diagnostic standards. Ocular hypertension was defined as intraocular pressure (IOP) 21 mmHg, normal optic disc appearance, and a normal VF with a mean deviation (MD) better than 2 dB. PPG required IOP 21 mmHg and clear evidence of glaucomatous optic nerve damage (e.g., neuroretinal rim thinning, excavation, or notching) in the absence of reproducible VF defects.Mild glaucoma was defined as glaucomatous optic neuropathy with a VF MD better than –6 dB, according to standard VF severity grading.^[20]^ Studies were also required to report at least one quantitative structural parameter measured using OCT, including peripapillary RNFL thickness, ganglion cell–inner plexiform layer (GCIPL) thickness, GCC thickness, Bruch's membrane opening minimum rim width (BMO-MRW), or optic disc RA.
The exclusion criteria were animal experiments, reviews, case reports and conference abstracts, studies using time-domain OCT, and studies written in languages other than English.
Data Extraction
Data were independently extracted by two reviewers (MH and AD) using a standard data extraction form. The following data were extracted from eligible studies: study characteristics (first author, year of publication, country, and study design), participant characteristics (sample size, age, and gender), type of OCT machine, and measured parameters. The primary outcomes were accuracy, sensitivity, specificity, and diagnostic odds ratio (DOR) of key OCT parameters distinguishing early glaucomatous eyes from healthy control eyes.
Risk of Bias Assessment and Applicability
The methodological quality of each study was examined according to the Quality Assessment of Diagnostic Accuracy Studies-2 (QUADAS-2) tool.^[21]^ The seven ordinal QUADAS-2 items, which assess the quality of included studies based on the risk of bias and applicability concerns, were extracted for each study. Each study was assessed as having low, high, or unclear risk of bias (four domains) and applicability concerns (three domains). Two review authors (MH and AD) independently assessed the risk of bias according to the predefined criteria. Disagreements regarding item-specific and overall quality ratings were resolved by a third reviewer (ZK).
Statistical Analysis
We performed a diagnostic NMA to explore diagnostic OCT parameters that can best identify early glaucoma. To evaluate the relative performance of OCT, we calculated pooled sensitivity and specificity for each diagnostic test compared with the reference standard of characteristic glaucomatous optic nerve damage glaucomatous VF defects.
To display the network map of studies reporting the diagnostic accuracy of key OCT parameters, we constructed a graph in which node size was proportional to the number of study participants, and line thickness represented the number of comparisons between tests. We calculated average sensitivity and specificity estimates, along with their derived relative values, and their corresponding 95% credible intervals (CrIs) using a bivariate random-effects NMA model.
In this study, accuracy was defined as the ability of each parameter to distinguish preperimetric or early glaucomatous eyes from healthy eyes. In almost all previous glaucoma diagnostic studies, the accuracy of average, superior, and inferior parameters was higher than that of nasal and temporal areas, a finding consistent across overall and subgroup analyses.^[16,17,18,19,20,21,22,23,24,25,26,27,28,29]^ Therefore, we excluded nasal and temporal parameters to enable comparison of more relevant measures. Damage to macular GCC/GCIPL layers seen on OCT was referred to as “macular parameters.” Heterogeneity was assessed using a forest plot. All analyses were performed using R (version 3.4.3; Comprehensive R Archive Network) and the packages rstan (version 2.17.3), loo (version 2.0.0), and plyr.
RESULTS
As shown in Figure 1, a total of 1532 studies were retrieved in our screening, of which 78 duplicates were removed, and 1377 articles were excluded by titles and abstracts. We further excluded 30 studies due to unavailable full-text versions, languages other than English, or the use of different diagnostic standards. Finally, according to our eligibility criteria, 47 studies were included in the systematic review.^[10,22,23,24,25,26,27,28,29,30,31,32,33,34,35,36,37,38,39,40,41,42,43,44,45,46,47,48,49,50,51,52,53,54,55,56,57,58,59,60,61,62,63,64,65,66,67]^ Most of the included studies were cross-sectional (80.8%), except for four (8.5%) case-control studies^[10,43,55,61]^ and five (10.6%) cohort studies.^[34,37,38,46,50]^ The total sample size comprised 12,723 eyes from 8177 participants. The flow diagram of the literature search is shown in Figure 1.
The included studies were published between January 2004 and March 2024 and spanned a diverse range of geographical regions. Of the 47 studies, the country-specific distribution was as follows: South Korea (10 studies, 21.3%), USA (9 studies, 19.1%), India (6 studies, 12.8%), Japan (5 studies, 10.6%), China (4 studies, 8.5%), Brazil (3 studies, 6.4%), and Turkey (2 studies, 4.3%). Additionally, one study each (2.1% per country) was conducted in Germany, Hungary, Taiwan, Malaysia, Singapore, the Philippines, Mexico, and Ethiopia.
The most commonly applied OCT machine was Cirrus (Carl Zeiss Meditec Inc., Dublin, CA, USA) in 17 studies (36.1%), followed by Spectralis (Heidelberg Engineering, Heidelberg, Germany) in 11 studies (23.4%), RTVue (Optovue Inc., Fremont, CA, USA) in 10 studies (21.3%), and Topcon (3D-OCT, Topcon, Tokyo, Japan) in 7 studies (14.8%). Two studies (4.2%) applied both Cirrus and Spectralis devices.
Different protocols were compared in terms of their performance in diagnosing glaucoma: 18 studies (38.2%) compared RNFL versus GCC; 8 studies (17%) compared RNFL versus ONH parameters such as BMO-MRW; and 11 studies (23.4%) compared ONH parameters versus GCC. Seven studies (14.8%) measured only RNFL parameters, and three studies (6.3%) measured only GCC parameters in early glaucoma. Detailed characteristics of the included studies are summarized in Table 1.
Quality Assessment
The methodological quality of the 47 included studies was assessed using QUADAS-2 (detailed in Supplementary Material 3, summarized in Figure 2). A high risk of bias was found in the “patient selection” domain for 87.2% of studies, mainly due to cross-sectional or case-control designs that preselected participants based on known glaucoma status. Some concerns were also noted in the “reference standard” domain: although most studies used VF testing, a subset relied on optic disc appearance—an approach prone to subjectivity and variability. All studies showed low applicability concerns, indicating that their methods align well with real-world clinical practice.
Results of NMA
We evaluated the diagnostic performance of three key OCT parameters in identifying early glaucoma. These parameters included peripapillary RNFL thickness, macular measurements, and ONH characteristics.
To display the network, we constructed a graph where nodes represent different screening tests and edges represent head-to-head comparisons. As shown in Figure 3, RNFL and GCIPL are the parameters most frequently evaluated and compared in the included studies.
Our analysis revealed that the overall diagnostic accuracy was comparable across all three categories of parameters. The diagnostic accuracy of RNFL parameters ranged from 0.73 to 0.77 across different measurements. Among these, both average RNFL and inferior RNFL showed the highest accuracy at 0.77. Specifically, the inferior RNFL had a DOR of 13.57 (8.69-20.73), while the average RNFL exhibited a DOR of 12.37 (9.22-16.20).
Preferred Reporting Items for Systematic reviews and Meta-Analyses (PRISMA) flowchart of the study selection process.
Risk of bias and applicability concerns graph on each QUADAS-2 domain presented as percentages across included studies.
The network map of studies reporting the diagnostic accuracy of key OCT parameters. The circle (node) size is proportional to the number of study participants, and the thickness of lines between different OCT parameters represents the number of comparisons between the two tests.
Forest plot showing the sensitivity and specificity of each OCT parameter in discriminating healthy participants from patients with early glaucoma.
For macular parameters, the inner retinal layers—comprising the macular nerve fiber layer, GCIPL, and GCC—were evaluated using various OCT platforms. Accuracies across macular metrics ranged from 0.71 to 0.76. Among these, GLV emerged as the most accurate macular parameter, with an accuracy of 0.76 (DOR: 11.67 [5-21.22]). This was closely followed by inferotemporal GCIPL, which showed an accuracy of 0.75 (DOR: 11.11 [6.03-18.09]) and average GCIPL demonstrating an accuracy of 0.74 (DOR: 9.32 [6.57-12.66]).
For ONH parameters, the pooled accuracies varied more substantially, ranging from 0.60 to 0.75. RA and cup-to-disc (C/D) ratio were the most accurate ONH parameters, each showing an accuracy of 0.75. RA had a DOR of 10.24 (5.51-16.65), while the C/D ratio demonstrated a DOR of 10.76 (6.22-16.98). The lowest diagnostic performance was observed for rim volume, with an accuracy of only 0.60 (DOR: 2.95 [0.93-6.76]).
Overall, the highest diagnostic accuracies for glaucoma detection were observed for average and inferior RNFL parameters, both achieving an accuracy of 0.77, and the macular GLV parameter with an accuracy of 0.76. These were followed by inferotemporal GCIPL and two ONH parameters— RA and C/D ratio—each with an accuracy of 0.75. Detailed performance characteristics of all evaluated parameters are provided in Table 2. To help illustrate heterogeneity across studies,^[68]^ the results are presented in a forest plot ordered by sensitivity and specificity [Figure 4].
DISCUSSION
Glaucoma is a slow, progressive degeneration of RGCs and their axons, resulting in a distinct appearance of the optic disc and retinal nerve fiber layer.^[69]^ When glaucoma is suspected during an ophthalmologic examination, diagnostic testing is needed to confirm damage. Standard automated perimetry (SAP) provides valuable information about functional damage; however, VF testing depends on patient compliance and cooperation, which can be challenging in clinical settings.^[70,71]^ Inter- and intra-subject variability also make it difficult to reliably detect small changes, especially in early glaucoma.^[72,73]^ Furthermore, structural damage is known to precede detectable functional loss; approximately 40% of axons must be lost before functional deterioration appears on SAP.^[74]^
One of the most commonly used imaging techniques is OCT, which provides several parameters revealing RNFL, macular and ONH damage caused by glaucoma. In this meta-analysis, we pooled data on the accuracy of several OCT parameters from eligible studies to determine which parameters better detect early glaucoma. Our results show highly similar accuracy among the most commonly used OCT protocols in discriminating healthy participants from patients with early glaucoma (0.77 accuracy for RNFL parameters, 0.76 for macular parameters, and 0.75 for ONH parameters).
Peripapillary RNFL remains the most frequently used structural parameter for glaucoma diagnosis. Our findings are consistent with the systematic review conducted by Oddone et al in 2016, which reported that average RNFL thickness assessed by RTVue OCT showed a sensitivity of 0.66 at a specificity of 0.95, outperforming macular parameters, although with only a small difference.^[75]^ Following the 2016 review by Oddone et al,^[75]^ macular parameter measurements have gained more attention, and several additional studies have been published. However, the current NMA indicates that overall findings have remained relatively consistent since 2016.
The number of studies incorporating ONH parameters alongside RNFL and macular parameters is relatively limited compared with investigations focused solely on the latter two. Heterogeneity in the number of included studies may affect direct comparisons when few studies are included. Nevertheless, the findings from these studies are promising. RA and C/D ratio, alongside other ONH parameters, have diagnostic accuracy comparable to that of macular parameters; however, they do not surpass that of RNFL parameters. Automatic detection of the optic nerve margin at the end of Bruch's membrane, rather than at the RPE termination, and the improved resolution of spectral domain technology may enhance the accuracy of optic disc demarcation. However, ONH metrics like RA and C/D ratio are not available on all OCT devices, which may limit generalizability across imaging platforms.
Despite the good diagnostic accuracy of all OCT parameters, it is important to emphasize that none of them can be perfect. Inferior RNFL, the best-performing parameter, achieved an accuracy of 0.77, a sensitivity of 70%, and a specificity of 85% in our NMA. Hence, a considerable number of glaucoma patients were not diagnosed using this parameter alone, suggesting that combining parameters may improve diagnostic accuracy.^[76,77]^ With computer-assisted diagnosis and AI, single-path data are being rapidly replaced by multimodal fusion imaging, which combines two or more parameters. In the near future, we may not have to choose among OCT parameters for glaucoma evaluation, as multimodal printouts providing data from three anatomical regions affected by glaucoma may become standard.
As digitalization progresses, integrating reflectance measurements of RNFL with its thickness may further augment diagnostic power. The ROTA (Retinal Nerve Fiber Layer Optical Texture Analysis) algorithm, which combines RNFL thickness and reflectance measurements from standard OCT scans, has the advantage of analyzing wide retinal areas, including the arcuate bundles, papillomacular bundle, and peripapillary NFL. It could help diagnose glaucoma at an early stage by detecting small RNFL defects involving the papillofoveal bundle.^[78,79]^ Interpretation of the ROTA algorithm is currently subjective, but results from ongoing studies evaluating its diagnostic effectiveness, along with standardization of glaucoma detection based on structural and functional changes integrated by AI, may help bridge the gap in early glaucoma detection.^[80]^
Limitations
Some studies were excluded due to a lack of access to the full-text manuscript, despite exhaustive efforts (including contacting authors and institutional library services). Given the relatively small number of these studies and their limited influence in the literature, their exclusion is unlikely to have introduced significant bias or materially affected the pooled estimates.
We found that individual studies were inconsistent in their reporting of sensitivity and specificity, with some reporting sensitivity at particular specificity cutoffs and others reporting optimal cutoff values. This heterogeneity made meta-analysis more complex.
There are also wide variations in gold standards to define glaucoma, including reliance on SAP, optic disc appearance, elevated IOP, or a combination of these factors. While these reflect real-world clinical practice, they increase heterogeneity across results. In the present research, many included studies exhibited selection bias, largely attributable to their case-control design and the heterogeneity in reference standards used to establish the diagnosis of glaucoma. Although this design does not inherently compromise relative test accuracy in direct comparisons, it is likely to overestimate accuracy. Consequently, these case-control studies may have inflated the overall diagnostic accuracy of NMA metrics. However, by excluding results comparing moderate or advanced glaucoma with healthy participants, we avoided overestimation bias in situations in which OCT would add little diagnostic value.^[81]^
Although OCT provides quantitative data, its interpretation requires integration with other clinical information, such as VF testing and optic disc evaluation, underscoring the need for multimodal diagnostic approaches.
In summary, our NMA suggests that while no single parameter is perfect, average and inferior RNFL thickness, followed by macular GLV, inferotemporal GCIPL, ONH RA and C/D ratio, may serve as the most reliable OCT-based indicators for early glaucoma diagnosis. Incorporating these parameters into routine clinical practice could enhance early detection and monitoring of glaucoma, particularly when used in combination with functional assessments such as VF testing. Future studies should explore the integration of these structural biomarkers with AI–driven models to further improve diagnostic precision and support personalized patient management.
Financial Support and Sponsorship
None.
Conflicts of Interest
None.
The reference list from the paper itself. Each links out to its DOI / PubMed record.
- 1Pascolini D Mariotti SP Global estimates of visual impairment: 2010 Br J Ophthalmol 2012966146182213398810.1136/bjophthalmol-2011-300539 · doi ↗ · pubmed ↗
- 2Flaxman SR Bourne RR Resnikoff S Vision Loss Expert Group of the Global Burden of Disease Study Global causes of blindness and distance vision impairment 1990-2020: A systematic review and meta-analysis Lancet Glob Health 20175 e 1221 e 12342903219510.1016/S 2214-109X(17)30393-5 · doi ↗ · pubmed ↗
- 3Doozandeh A Yazdani S Neuroprotection in glaucoma J Ophthalmic Vis Res 2016112092202741350410.4103/2008-322X.183923 PMC 4926571 · doi ↗ · pubmed ↗
- 4Tham YC Li X Wong TY Quigley HA Aung T Cheng CY Global prevalence of glaucoma and projections of glaucoma burden through 2040: A systematic review and meta-analysis Ophthalmology 2014121208120902497481510.1016/j.ophtha.2014.05.013 · doi ↗ · pubmed ↗
- 5Quigley HA Katz J Derick RJ Gilbert D Sommer A An evaluation of optic disc and nerve fiber layer examinations in monitoring progression of early glaucoma damage Ophthalmology 1992991928174113310.1016/s 0161-6420(92)32018-4 · doi ↗ · pubmed ↗
- 6Doozandeh A Yazdani S Pakravan M Risk of missed diagnosis of primary open-angle glaucoma by eye care providers J Curr Ophthalmol 2023344044083718052810.4103/joco.joco_296_22PMC 10170989 · doi ↗ · pubmed ↗
- 7Wong EY Keeffe JE Rait JL Detection of undiagnosed glaucoma by eye health professionals Ophthalmology 2004111150815141528898010.1016/j.ophtha.2004.01.029 · doi ↗ · pubmed ↗
- 8Hennis A Wu SY Nemesure B Barbados Eye Studies Group Awareness of incident open-angle glaucoma in a population study: The Barbados Eye Studies Ophthalmology 2007114181618211769819810.1016/j.ophtha.2007.06.013 · doi ↗ · pubmed ↗