HerMeS: a registry-based evaluation of the HERCULES criteria for identifying nonrelapsing SPMS
Tommaso Guerra, Giuseppe Lucisano, Maria A. Rocca, Eleonora Cocco, Francesco Patti, Giovanna De Luca, Emilio Portaccio, Matteo Foschi, Diana Ferraro, Carlo Pozzilli, Silvia Romano, Pietro Annovazzi, Vincenzo Brescia Morra, Carla Tortorella, Roberta Fantozzi, Paola Perini

TL;DR
This study evaluates the HERCULES criteria for identifying non-relapsing SPMS in a large MS registry, comparing it to neurologist-defined cases.
Contribution
The study applies and validates the HERCULES criteria in a real-world registry to identify non-relapsing SPMS patients.
Findings
HERCULES criteria identified 7.9% of patients as non-relapsing SPMS, compared to 4.26% by neurologists.
HERCULES-defined SPMS patients had fewer post-conversion relapses and earlier progression independent of relapse activity.
The HERCULES criteria showed high specificity but low sensitivity for identifying SPMS.
Abstract
Secondary progressive multiple sclerosis (SPMS) encompasses heterogeneous phenotypes that may or may not exhibit disease activity. To characterize a cohort of non-relapsing SPMS (nrSPMS) identified through a data-driven definition adapted from the HERCULES trial criteria, compared with neurologist-defined (ND) SPMS. Relapsing MS patients were retrospectively extracted from the Italian Multiple Sclerosis Register (RISM). ND was defined according to clinical criteria for SPMS and the HERCULES cohort adapting the trial inclusion criteria. Progression independent from relapse activity (PIRA) and relapse-associated worsening (RAW) events were assessed. Diagnostic performances of SPMS definitions were evaluated. Among 20,306 patients, 866 (4.26%) were classified as SPMS by ND and 1603 (7.89%) by HERCULES criteria. The HERCULES group included older patients, less likely to relapse…
Genes, proteins, chemicals, diseases, species, mutations and cell lines named across the full text — each resolved to its canonical identifier and authoritative record.
Click any figure to enlarge with its caption.
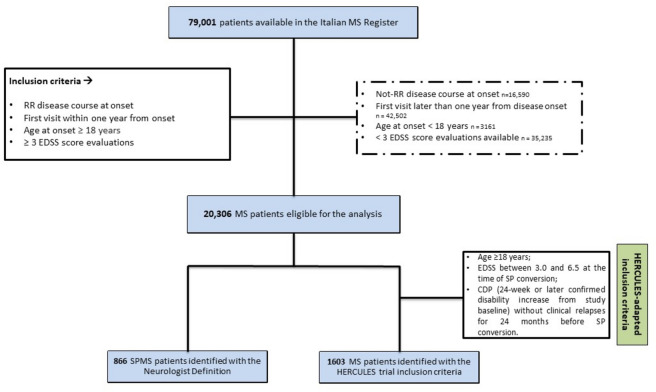 Figure 1
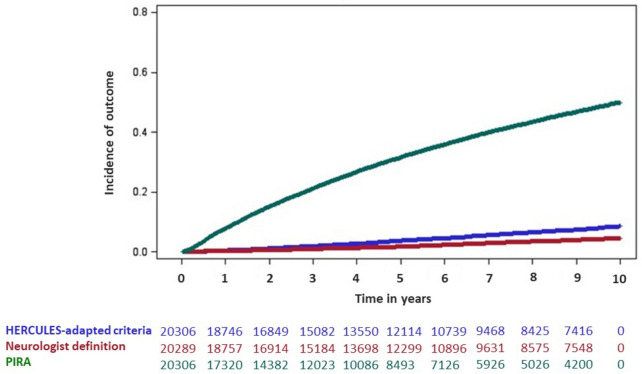 Figure 2
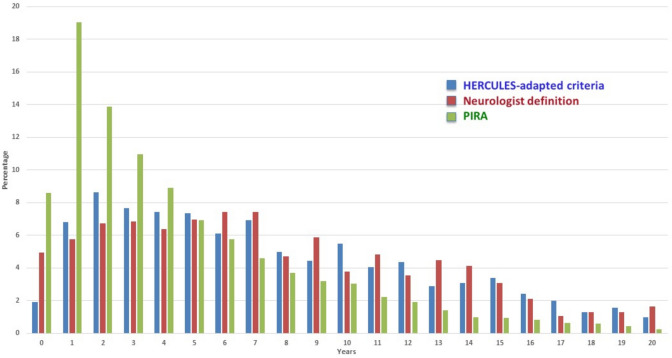 Figure 3
- —http://dx.doi.org/10.13039/100022824Sanofi Italia
- —Università degli Studi di Bari Aldo Moro
Peer Reviews
No public reviews on file for this paper yet. If you reviewed it on a platform where reviews are public (OpenReview, ICLR, NeurIPS, ICML), you can paste yours below so the community can read it here.
Videos
No videos yet. Explain this paper in a talk, walkthrough, or lecture? Add one.
Taxonomy
TopicsMultiple Sclerosis Research Studies · Amyotrophic Lateral Sclerosis Research · Voice and Speech Disorders
Introduction
The neuropathological continuum of multiple sclerosis (MS), sustained by inflammatory demyelination and neurodegeneration, has been delineated by major studies over the last few years [1–3]. The presence of progression independent of relapse activity (PIRA) since the disease onset demonstrates that progression phenomena characterize MS throughout its course, challenging the classic clinical distinction in phenotypes. [4] However, this subdivision is widely applied and underpins prescription and reimbursement criteria for disease-modifying therapies (DMTs). [5, 6] Despite its clinical meaning, the definition of secondary progressive multiple sclerosis (SPMS) remains challenging because of characteristics that overlap between the relapsing and progressive phases: even when PIRA accounts for the majority of the disability accrual in SPMS, representing more than 80% of confirmed disability accumulation events, relapses may still occur. [7] Therefore, SPMS patients have been further categorized as "active" or "non-active" based on the presence of relapses or radiological activity. [8] A previous analysis conducted by the Italian Multiple Sclerosis and Related Disorder Register (RISM) group demonstrated the superior ability to capture the SP transition of two different data-driven SPMS definitions, based on a version of Lorscheider’s algorithm and the EXPAND trial inclusion criteria, compared to the neurologist’s definition (ND). [9] Recent clinical trials in MS including nonrelapsing SPMS (nrSPMS) have prompted discussion over implications for clinical practice. [10, 11] The HERCULES trial, investigating the efficacy and safety outcomes of tolebrutinib, a Bruton tyrosine kinase inhibitor, targeted a nrSPMS population to assess the effect on compartmentalized inflammation [12, 13], as a result of smoldering pathological processes [14, 15]. The therapeutic and diagnostic challenges are therefore intertwined. The present study had three objectives. First, we aimed to describe the clinical characteristics of SPMS populations identified according to ND and an adapted definition of the HERCULES criteria, using data from the RISM, a large and validated database representative of the Italian MS population. In this context, we investigated the incidence of PIRA events. Second, we aimed to assess the diagnostic performance of the adapted HERCULES definition, examining its ability to capture an nrSPMS phenotype. Third, we aimed to compare the timing of SPMS identification according to ND and adapted HERCULES criteria, to explore potential differences in diagnostic timing between definitions.
Material and methods
Study approval and patient consents
The analysis was conducted using data from RISM, previously authorized by the Ethics Committee of the Azienda Ospedaliero-Universitaria Policlinico of Bari (REGISTRO SM001) and by the local ethics committees.
Study population, outcome definition and SPMS definitions
This was a retrospective observational cohort study using data from RISM. Data extraction was executed in January 2024. Patient data retrieved from the RISM included demographic, clinical, magnetic resonance imaging (MRI), and treatment-related characteristics. The selection criteria for patients included relapsing-onset MS patients (RMS) with age at onset of at least 18 years, a first visit within one year of disease onset, and at least three Expanded Disability Status Scale (EDSS) evaluations over time.
As reported in previous studies [4, 15], the confirmed disability accrual (CDA) was defined as a confirmed 6-month disability increase from study baseline, measured by EDSS (increase ≥ 1.5 points with baseline EDSS = 0; ≥ 1.0 point with baseline EDSS > 1.0, and < 5.5; ≥ 0.5 point with baseline EDSS > 6.0). Date of CDA was assigned at the first EDSS when the disability increase was registered. PIRA, the primary outcome investigated, was defined as a CDA event occurring more than 90 days after, and more than 30 days before, the onset of a relapse. Relapse-associated worsening (RAW) was defined as a CDA event in which the initial disability worsening from study baseline occurred within 90 days after, or within 30 days before, the onset of a relapse. [4].
The following different definitions have been used to identify SPMS patients included in the RISM cohort:
- Neurologist Definition (ND): as reported in our previous study [9], SPMS identification was based on the treating neurologist’s clinical judgment consistent with the Lublin criteria. [17] The SPMS conversion date was derived from clinical records entered in the RISM.
- nrSPMS—HERCULES adapted definition criteria: adapted from the HERCULES trial SPMS criteria [12], a data-driven definition requiring a relapsing onset, age ≥ 18 years, EDSS between 3.0 and 6.5 at the time of SP conversion, CDA (24-week or later confirmed disability increase from study baseline) without clinical relapses for at least 24 months before SP conversion
For the primary objective, the variables assessed included all available clinical and demographic characteristics recorded in the RISM before and after SPMS labeling. Geographical sub-analyses were performed by describing the distribution of SPMS definitions across Northern, Central, and Southern Italian regions within the RISM network. Time to SPMS labeling was assessed according to ND and adapted HERCULES criteria and was defined as the interval between disease onset and SPMS diagnosis under each definition.
Statistical analysis
For descriptive results, continuous data are presented as mean and standard deviation (SD) for approximately normally distributed variables, and as median and interquartile range (IQR) for skewed distributions or variables with outliers. Baseline clinical characteristics were described and stratified according to the two cohorts defined by the different SPMS definitions. Given the descriptive nature of the study, and because ND- and adapted HERCULES-defined SPMS cohorts are not mutually exclusive and may overlap at the individual level, no formal hypothesis testing was performed.
We considered different measures to evaluate the diagnostic performance and the agreement of the data-driven definitions of SPMS according to HERCULES compared to the ND, used as the reference: calibration (agreement between predicted and observed outcomes), discrimination (ability to distinguish SPMS from non-SPMS), and overall model fit. In the absence of a universally accepted gold standard for SPMS diagnosis, we decided to apply neurologist-defined (ND) SPMS as a pragmatic reference classification reflecting real-world clinical labeling [9].
The overall calibration of the data-driven definitions was evaluated by the Calibration Slope test, with* p* > 0.05 indicating good calibration. Discrimination metrics were derived from standard classification indices: true positive (TP), false negative (FN), false positive (FP), true negative (TN), specificity, sensitivity, positive predictive value (PPV), negative predictive value (NPV), and accuracy. Model fit was evaluated using Akaike Information Criterion (AIC).
We included Wilson confidence intervals for performance indices.
Time to SPMS identification according to ND and adapted HERCULES criteria was evaluated using time-to-event methods applied to the entire eligible cohort. Cumulative incidence curves were estimated using Kaplan–Meier methods to illustrate the timing of SPMS identification according to each definition, as well as the occurrence of PIRA over follow-up. Exploratory Cox regression models were used to assess associations between baseline clinical factors (at the first visit recorded in RISM) and SPMS identification according to ND and adapted HERCULES criteria. In addition, we performed a descriptive subgroup analysis based on the geographical distribution of MS centers where patients are followed,
Analyses were performed using R, version 4.3.3 (R Foundation for Statistical Computing).
Results
Clinical records from a total of 79,001 MS patients were accessible within the RISM at the time the dataset was extracted. After applying the inclusion criteria, a cohort of eligible 20,306 RMS patients from 125 MS centers of the RISM network was identified. Among them, 866 (4.26%) were classified as SPMS according to ND and 1603 (7.89%) according to the HERCULES definition. Figure 1 provides a schematic overview of the patient selection procedure. Clinical and demographic characteristics at SPMS conversion are reported in Table 1. For descriptive purposes, Table 1 also reports clinical characteristics of patients who did not convert to SPMS during follow-up in the total eligible RMS cohort. In the eligible cohort, median follow-up duration was 16.9 years (IQR 11.0–22.8) for ND-defined patients and 13.6 years (IQR 8.3–19.0) for HERCULES-defined patients. We identified at least one PIRA event throughout the follow-up in 8089 (39.8%) patients.Fig. 1. Flowchart of patient selectionTable 1Baseline clinical and demographic characteristicsRMS patients without SPMS conversionNDHERCULES-adapted definitionNumber of patients identified18,1638661603Follow-up, median (IQR), years6.20 (2.80–11.40)16.90 (11.00–22.80)13.60 (8.30–19.00)Time from first visit to SPMS conversion, median (IQR) years-7.08 (3.61–12.34)7.00 (3.50–12.15)Age at the analysis, median (IQR) years40.34 (32.73–48.79)44.45 (37.40–51.70)46.60 (39.20–53.40)Number (%) of subjects with age ≤ 5014,213 (78.25)609 (70.32)989 (61.70)Number (%) of subjects with age > 503950 (21.75)257 (29.68)614 (38.30)Male sex, n (%)5925 (32.62)334 (38.57)573 (35.75)EDSS, median (min–max)1.50 (1.00–2.00)4.50 (3.00–5.50)4.00 (3.00–4.50)EDSS categories0.03038 (16.73)29 (3.35)0 (0.0)1.0–1.58162 (44.94)44 (5.08)0 (0.0)2.0–2.54171 (22.96)100 (11.55)0 (0.0)3.0–3.51156 (6.36)127 (14.67)785 (48.97)4.0–4.5736 (4.05)209 (24.13)427 (26.64)5.0–5.5285 (1.57)142 (16.40)178 (11.10)6.0–6.5427 (2.35)169 (19.52)212 (13.23)≥ 7.0188 (1.04)29 (3.35)0 (0.0)Patients with relapses in the previous year before SPMS, n (%)1753 (9.65)319 (36.84)0 (0.00)Patients with relapses in the 2 years before SPMS, n (%)2976 (16.38)421 (48.61)0 (0.00)Patients with relapses after SPMS conversion, n (%)-380 (43.88)395 (24.64)Onset typeUnifocal15,182 (87.45)654 (77.86)1263 (81.80)Multifocal2179 (12.55)186 (22.14)281 (18.20)Patients with active lesions at the first visit, n (%)No11,011 (71.99)433 (72.29)898 (71.90)Yes4285 (28.01)166 (27.71)351 (28.10)Presence of MRI T2 brain lesions (RISM codification of lesion burden) at the first visit, n (%)0515 (6.67)15 (4.81)34 (5.48)1–2808 (10.46)15 (4.81)41 (6.60)3–83221 (41.72)182 (58.33)307 (49.44) ≥ 93177 (41.15)100 (32.05)239 (38.49)EDSS Expanded Disability Status Scale, MRI magnetic resonance imaging, RISM Italian Multiple Sclerosis and Related Disorders Register, SPMS, secondary progressive multiple sclerosis
Patients defined by the HERCULES criteria were slightly older compared to ND patients (median (IQR) age: 46.60 (39.20–53.40) vs. 44.45 (37.40–51.70) years). The median (IQR) time from the first visit to SP transition was 7.08 (3.61–12.34) years in the ND cohort and 7.00 (3.50–12.15) years in the HERCULES group. The percentage of patients presenting with clinical relapses after the SP conversion differed between the two groups, with a higher percentage for the ND (43.88%) compared to the HERCULES definition (24.64%).
Table 2 displays the distribution of PIRA and RAW events in the two cohorts of SPMS patients. PIRA events were identified in 769 (88.80%) patients in the ND group and 1419 (88.52%) patients in the HERCULES-defined cohort. The median (IQR) time from the first visit to the first PIRA event was shorter in the HERCULES-criteria group compared to the ND (4.46 (1.94–9.09) vs 5.11 (2.14–9.74) years, respectively). In the HERCULES-adapted cohort, about half of PIRA events occurred before SPMS conversion (47.99%) and only a small proportion after conversion (7.61%). In comparison, ND-defined SPMS showed a higher proportion of PIRA occurring both before (56.57%) and after conversion (32.64%). These percentages are detailed in Table 2. RAW events were less frequent overall: the proportion of patients with a RAW event after SPMS conversion was higher in the ND cohort (14.08%) than in the HERCULES group (4.21%). The median time from the first visit to the first RAW event was 3.36 (1.59–7.25) years in the HERCULES group and 3.68 (1.61–7.13) years in the ND group.Table 2. Assessment of PIRA and RAW events for ND and HERCULES definitionsND (866)HERCULES-adapted definition (1603)Patients presenting PIRA events, n (%)769 (88.80)1419 (88.52)Time to PIRA, median (IQR) years5.11 (2.14–9.74)4.46 (1.94–9.09)PIRA events before SPMS conversion, n (%)435 (56.57)681 (47.99)Patients presenting PIRA events concomitant to SPMS conversion, n (%)83 (10.79)630 (44.40)Patients presenting PIRA events after SPMS conversion, n (%)251 (32.64)108 (7.61)Patients presenting RAW events, n (%)213 (24.60)190 (11.85)Time to RAW, median (IQR) years3.68 (1.61–7.13)3.36 (1.59–7.25)Patients presenting RAW events before SPMS conversion, n (%)164 (77.00)182 (95.79)Patients presenting RAW events concomitant to SPMS conversion, n (%)19 (8.92)0 (0.00)Patients presenting RAW events after SPMS conversion, n (%)30 (14.08)8 (4.21)PIRA progression independent of relapse activity RAW relapse-associated worsening; SPMS secondary progressive multiple sclerosis
We evaluated the concordance between the HERCULES and the ND definition, used as the reference definition for comparison. In terms of diagnostic performance, the HERCULES definition showed a high specificity (93.4%) and a low sensitivity (37.6%), with a C-Index of 55.0%. The overall accuracy was 91.1% (90.7–91.5). The goodness of fit was supported by the non-significant Calibration slope test (p = 0.99), indicating overlap between observed and predicted probabilities, and by a lower AIC. A detailed summary of diagnostic performance is reported in Table 3.Table 3. Diagnostic performance of HERCULES definition for nrSPMSNeurologist’s definition as Gold StandardHERCULES-adapted definitionTrue positiveNeurologist +/Algorithm + 326False negativeNeurologist +/Algorithm–540False positiveNeurologist–/Algorithm + 1277True negativeNeurologist–/Algorithm–18,163% true positive%1.6 (1.4–1.8)% false negative%2.7 (2.5–2.9)% false positive%6.3 (6.0–6.8)% true negative%89.4 (89.0–89.8)AIC intercept and covariateLower is better4372C-Index0.55 (0.45–0.65)Calibration slope p-value testWell calibrated with* p* > 0.050.99Sensitivity% of Neurologist SP identified by the HERCULES adapted definition37.6 (36.9–38.3)Specificity% of Neurologist RR identified by the HERCULES adapted definition93.4 (93.1–93.7)PPV% of Neurologist SP identified by the HERCULES adapted definition already diagnosed as SP by the neurologist20.3 (19.7–20.9)NPV% of Neurologist RR identified as SP by the HERCULES adapted definition97.1 (96.9–97.3)Accuracy91.1 (90.7–91.5)PPV positive predictive value, NPV negative predictive value, AIC Akaike Information Criterion
The cumulative incidence evaluation reported in Fig. 2 shows that HERCULES and ND have a very similar trend, in parallel with a higher risk of PIRA occurring since the start of the observation and persisting over time. The distribution of time to SPMS conversion according to the ND and HERCULES-adapted definitions, as well as time to the first PIRA event, is reported in Fig. 3. Results of exploratory Cox regression analyses assessing associations between baseline factors and SPMS identification according to each definition are reported in the Supplementary Material.Fig. 2. Cumulative incidence of SPMS conversion according to neurologist-defined and adapted HERCULES criteria, and cumulative incidence of PIRA over follow-up. Time is expressed in years. Numbers below the curves represent the number of subjects at risk at the corresponding time pointsFig. 3Annual distribution of time to SPMS conversion according to neurologist-defined and adapted HERCULES criteria, and time to first PIRA event. Bars represent the percentage of events occurring in each year among subjects at risk during that year
A subgroup analysis based on the geographical distribution of patients according to MS centers where they are followed, divided into regions of northern, central, and southern Italy, was also performed and reported in Table 4. Participants’ characteristics were similar in terms of follow-up duration, sex, presence of active lesions, symptoms at onset, age at onset, and EDSS at first evaluation. Participants followed in MS Centers in Northern Italy show a lower percentage of PIRA (35.82% vs 41.96% in the Center and 43.21% in the South) and HERCULES (5.67% vs 7.63% in the Center and 10.41% in the South).Table 4. Geographical distribution of patients included in the study and outcome assessmentVariableNorthCenterSouth Number of patients866236158029Follow-up, median (IQR) years6.50 (3.00–11.70)6.60 (3.00–12.20)7.40 (3.20–13.60)Female sex, n (%)5750 (66.38)2475 (68.46)5385 (67.07)Subject with presence of active lesion, n (%)No5252 (73.53)2320 (70.01)4616 (71.38)Yes1891 (26.47)994 (29.99)1851 (28.62)Presence of MRI T2 brain lesions (RISM codification of lesion burden), n (%)0151 (4.72)75 (6.17)332 (8.06)1–2373 (11.67)182 (14.97)300 (7.28)3–81252 (39.17)627 (51.56)1762 (42.76) ≥ 91420 (44.43)332 (27.30)1727 (41.91)Type of MS onsetUnifocal7249 (87.83)2993 (87.98)6612 (85.06)Multifocal1004 (12.17)409 (12.02)1161 (14.94)Age at onset, median (IQR)32.80 (26.20–41.60)32.90 (26.30–41.40)31.10 (24.90–39.10)Age at SPMS according to ND, median (IQR)46.80 (39.60–53.90)45.30 (39.90–53.60)41.80 (35.60–49.00)Age at SPMS according to Hercules, median (IQR)48.50 (40.00–56.00)46.25 (40.90–53.20)45.80 (38.15–52.00)Age at PIRA, median (IQR)38.10 (30.90–46.90)38.00 (30.70–46.50)36.40 (29.80–44.90)First EDSS, median (min–max)1.50 (1.00–2.00)1.50 (1.00–2.00)2.00 (1.00–2.50)SPMS patients according to ND, n (%)355 (4.10)98 (2.71)413 (5.14)SPMS patients according to HERCULES, n (%)491 (5.67)276 (7.63)836 (10.41)Patients with PIRA events, n (%)3103 (35.82)1517 (41.96)3469 (43.21)Patients with PIRA events before SPMS conversion according to ND, n (%)2964 (95.52)1482 (97.69)3309 (95.39)Patients with PIRA events concomitant with SPMS conversion according to ND, n (%)32 (1.03)8 (0.53)43 (1.24)Patients with PIRA events after SPMS conversion according to ND, n (%)107 (3.45)27 (1.78)117 (3.37)Patients with PIRA events before SPMS conversion according to HERCULES, n (%)2877 (92.72)1384 (91.23)3090 (89.07)Patients with PIRA events concomitant with SPMS conversion according to HERCULES, n (%)198 (6.38)106 (6.99)326 (9.40)Patients with PIRA events after SPMS conversion according to HERCULES, n (%)28 (0.90)27 (1.78)53 (1.53)Time to SPMS according to ND, median (IQR) years6.24 (2.87–11.23)6.40 (2.97–11.91)7.01 (3.10–12.91)Time to SPMS according to HERCULES, median (IQR) years6.21 (2.86–11.27)6.17 (2.92–11.43)6.80 (2.98–12.59)Time to PIRA, median (IQR) years4.03 (1.72–8.04)3.62 (1.59–7.24)4.03 (1.68–8.11)Patients with relapses in 2 years before SPMS according to ND, n (%)143 (40.28)46 (46.94)232 (56.17)Patients with relapses in 2 years before SPMS according to HERCULES, n (%)0 (0.00)0 (0.00)0 (0.00)Patients with relapses after SPMS according to ND, n (%)137 (38.59)50 (51.02)193 (46.73)Patients with relapses after SPMS according to HERCULES, n (%)112 (22.81)66 (23.91)217 (25.96)EDSS Expanded Disability Status Scale, MRI magnetic resonance imaging ND neurologist definition, PIRA progression independent of relapse activity, RAW relapse-associated worsening, RISM Italian Multiple Sclerosis and Related Disorders Register, SPMS secondary progressive multiple sclerosis
Discussion
The identification of SPMS transition remains a crucial clinical challenge since the absence of a widely recognized definition in differentiating relapsing and progressive forms. Nowadays, neurologists diagnose SPMS retroactively considering a history of progressive impairment following an initial relapsing phase. [17, 18] The difficulty of detecting SPMS patients also seems to affect whether they will be characterized as active or nonrelapsing [8].
In addition, using adapted HERCULES criteria, in this multicenter retrospective study we identified a distinct nrSPMS phenotype characterized by older age and fewer relapses after conversion. Only a small proportion of post-conversion relapses resulted in RAW, supporting the concept that disability accumulation in this group is largely driven by PIRA mechanisms. These findings are consistent with prior studies reporting a predominance of nonactive SPMS and highlighting PIRA as the main driver of disability. A recent study [8] identified SPMS patterns in the cohort of the Danish MS Register, outlining a higher percentage of nonrelapsing SPMS patients at the time of conversion and a higher cumulative probability of being nonactive by the end of follow-up. The different criteria applied to the RISM cohort could explain the discrepancy with this study. The population of nonactive SPMS in the RISM database has been also recently described [19]: compared to active SPMS, the patients in this cohort were older and had a longer disease duration.
Considering the results of the study of Chisari et al. [19], the proportion of patients presenting PIRA at 24 months follow-up was comparable in the active and nonactive groups, confirming that PIRA is largely responsible for progression [2, 4, 20, 22].
A recent study by Portaccio et al. [22] highlighted that a single PIRA event, particularly in the case of sustained PIRA, is sufficient to start progression in most of the patients. In addition, in our cohort, PIRA events were more frequent than RAW and occurred earlier than formal SPMS conversion, reinforcing the notion that PIRA may precede and signal the transition to secondary progression. Time to first PIRA was shorter than time to SPMS diagnosis, and accounting for PIRA reduced the association between different SPMS definitions, suggesting that early PIRA substantially influences disease course classification. These observations support the view that the occurrence of PIRA should prompt closer monitoring for progression and potential treatment reassessment.
Diagnostic performances of standardized definitions for the diagnosis of SPMS are the subject of compelling and recent debate. A recent study analyzed data from five European MS registries and showed different proportions of identified SPMS patients employing three objective classification methods, the MSBase algorithm [23], the EXPAND criteria, and a decision tree-based algorithm [24]. The sensitivity differed between the methods (47.4% EXPAND, 75.7% MSBase algorithm, 83.5% decision tree), while the specificity resulted similar. The overall accuracy of each method compared to the clinical SPMS assignment was 79.1% for EXPAND, 85.4% for the MSBase algorithm, and 83.7% for the decision tree classifier [24]. Braune et al. outlined that the specificity of the MSBase criteria for SPMS was also high (89.6% in the group of patients diagnosed with SPMS and 96.2% including RRMS patients without transition), in parallel with low values of sensitivity (32%) and accuracy (61.4%) [25]. The HERCULES criteria, compared to the ND, applied to our cohort resulted in low sensitivity (37.6%) and high levels of specificity (93.4%), in line with previous results. Nonetheless, it is important to emphasize a high level of accuracy of 91.1% of HERCULES-adapted criteria. Considered together, these performances indicate that the HERCULES-adapted criteria offer a highly specific and therefore useful approach to identify well-defined SPMS cases with high confidence. The low sensitivity should be viewed in the context of the reference standard, as clinician-defined SPMS is often heterogeneous and delayed. These measures were not intended to support individual-level risk prediction, but to quantify overall agreement and classification performance in the absence of a true gold standard for SPMS diagnosis.
The observed differences between ND and HERCULES-defined SPMS populations should be interpreted considering the intrinsic differences between the two diagnostic frameworks. By design, these definitions capture inherently different patient populations. This fundamental distinction could explain several of the observed findings, including younger age and higher inflammatory activity in ND-defined SPMS. Conversely, the lower frequency of PIRA observed in ND-defined SPMS may reflect reduced exposure time for relapse-independent progression, as disability changes occurring in temporal proximity to relapses cannot be classified as PIRA. In this context, the higher number of SPMS diagnoses and the earlier timing of SPMS identification observed with HERCULES criteria are particularly noteworthy because these findings suggest that criteria-based definitions may reclassify early PIRA-related disability accumulation as SPMS in the contemporary treatment era. This concept aligns with the ongoing debate surrounding the concept of how specific PIRA truly is for inflammation-independent progression. Emerging evidence supports a shift from purely clinical definitions of PIRA toward a biologically driven framework grounded in MS pathogenic mechanisms and MRI correlates, moving beyond traditional clinical descriptors [30].
We also performed an analysis of geographical discrepancies in SPMS definition. Patients followed in MS Centres in Northern Italy show a lower percentage of PIRA and HERCULES defined patients, compared to MS Centres of Central and Southern Italy. A previous work of the RISM assessed geographical socio-economic factors and characteristics of local MS centers in Italy, underscoring their role of primary factor influencing phenotype at initial neurological evaluation [26]. Further research will be useful to explore possible determinants and consequences of regional variability.
Some key limitations of the study must be acknowledged. A primary limitation is that the algorithm depends solely on EDSS records, with all the related limits of this scale. [27] Groups differed in disability severity, with EDSS < 3.0 in the ND reference group and EDSS 3.0–6.5 in the HERCULES definition. Observed discrimination may partly reflect disability level rather than disease course, potentially leading to an overestimation of the ability to identify SPMS. Furthermore, as discussed, the stringent criteria of the data-driven definition adopted in our analysis may explain the different proportion of nrSPMS patients reported in other studies. [8] Potential cohort-related biases should be considered when interpreting these findings. Specifically, the lower SPMS diagnostic rates observed in our cohort compared with classic natural history studies, in which approximately 23–25% of patients converted to SPMS over 10–11 years, likely reflect differences in follow-up, clinical characteristics and study design [31, 32].
Consistent with other retrospective studies based on disease registries, data incompleteness and entry inaccuracies cannot be excluded. A major limitation of the adapted HERCULES definition is the exclusion of radiological activity, as MRI data are not standardized across the RISM network, resulting in a classification based solely on clinical parameters. This distinction is clinically relevant and should be acknowledged when interpreting our findings. Despite using the ND as the reference definition for comparison, we cannot rule out the possibility that the neurologists treating patients included in our cohort underdiagnosed SPMS because of a diagnostic delay that may have been caused by the hesitancy to diagnose secondary progression [28] and the later onset of the progressive phase [29]. Furthermore, in this study we did not account for DMT class or treatment patterns in our cohort and relapse suppression from high-efficacy therapies may have influenced nrSPMS classification, representing a potential confounder to consider when interpreting these results. No formal sample size calculation was performed, as this was a retrospective, exploratory, registry-based study.
Our findings underline the importance of using algorithms for SPMS diagnosis, particularly when they are applied as standardized end points in epidemiological research based on MS registry data. In addition, the study is based on the RISM patient population, which is highly representative of the Italian MS patient population. [16] With participants from 125 MS centers (about 81% of all centers of RISM network), the population of RISM included in this study is also highly representative, being geographically widely distributed.
In conclusion, applying nrSPMS criteria adapted from the HERCULES trial to our cohort reliably identified a distinct nrSPMS subgroup, accounting for 7.89% of our study population. NrSPMS patients were less likely to experience relapses after SP conversion and had even fewer RAW events, while PIRA emerged as the predominant CDA event, being markedly more frequent than RAW and occurring earlier in the HERCULES group than in the ND. Overall, these findings reinforce the need to prevent disability accumulation primarily driven by smoldering neuroinflammation.
Supplementary Information
Below is the link to the electronic supplementary material.Supplementary file1 (DOCX 17 KB)