Artificial intelligence in osteoporosis assessment using CT imaging: a scoping review
Hanwen Cheng, Yajun Zhang, Meng Meng, Simin Liu, Yang Yang, Yuyang Ran, Yuhui Kou

TL;DR
This review maps how AI is used in CT scans to assess osteoporosis, highlighting performance and methodological challenges.
Contribution
A systematic scoping review of AI applications in CT-based osteoporosis assessment, emphasizing methodological diversity and performance trends.
Findings
AI models for osteoporosis diagnosis and screening achieved high accuracy (AUC 0.781–0.997).
Fracture-risk prediction models showed lower accuracy (AUC 0.702–0.92) compared to diagnostic models.
Methodological diversity and inconsistent validation limit generalizability and cross-study comparisons.
Abstract
This scoping review aimed to systematically summarize and map current research on the application of artificial intelligence (AI) in CT-based osteoporosis assessment, with a focus on methodological approaches, anatomical target regions, and reported algorithmic performance across existing studies. PubMed, EMBASE, and Web of Science databases were searched for studies published between January 1995 and December 2025. Eligible studies applied AI, machine learning, or deep learning techniques to CT images for osteoporosis classification, bone mineral density (BMD) estimation, or fracture-risk prediction. Data extraction covered study characteristics, imaging sources, analytical workflows, and validation methods. A total of 51 studies were included. Most were retrospective (84.3%) and single-center (84.3%), with nearly half conducted in China. Study objectives clustered around…
Genes, proteins, chemicals, diseases, species, mutations and cell lines named across the full text — each resolved to its canonical identifier and authoritative record.
Click any figure to enlarge with its caption.
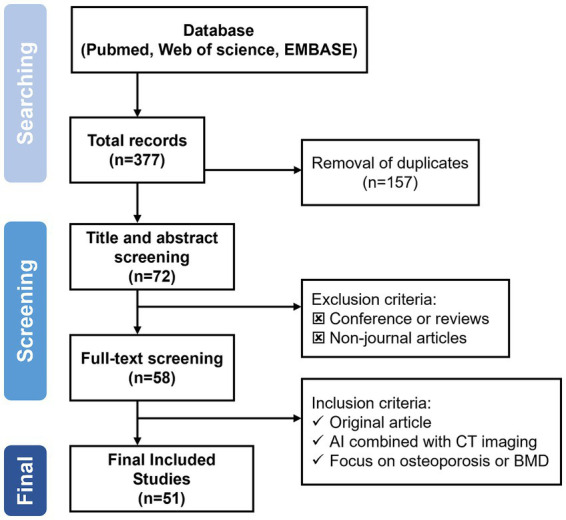 Figure 1
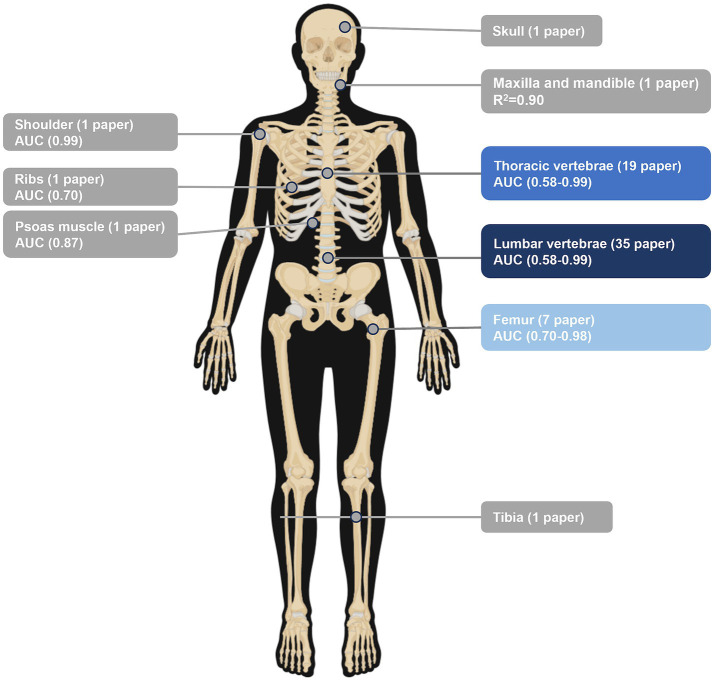 Figure 2
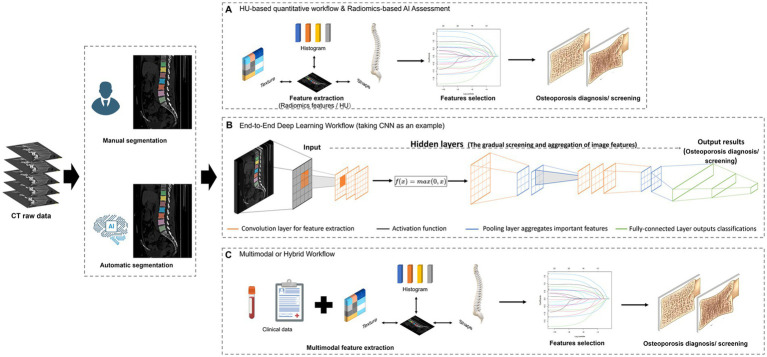 Figure 3
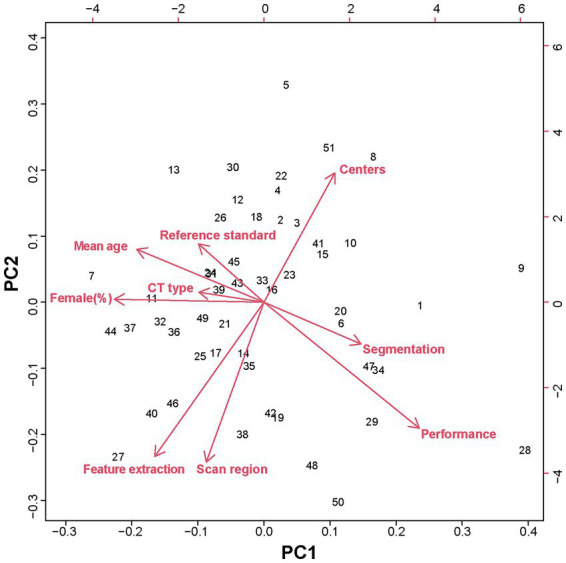 Figure 4
| Authors and year | Main objectives | Research centers | Country | CT image sources | Participants (male/female) | Age range (years) | |
|---|---|---|---|---|---|---|---|
| Wu et al. ( | 2025 | OP diagnosis | Single-center | China | Chest CT | 553 (353/200) | M 50 ± 11 |
| F 49 ± 10 | |||||||
| Li et al. ( | 2025 | OP diagnosis | Single-center | China | Lumbar spine CT | 120 (48/72) | 20–79 |
| Wu et al. ( | 2025 | OP screening | Single-center | China | Chest CT | 7,713 (3,544/4169) | 47–61 |
| Adarve et al. ( | 2025 | OP diagnosis | Multicenter | Spain | Abdominal CT | 58 (11/47) | 49–65 |
| Paukovitsch et al. ( | 2025 | OP diagnosis | Multicenter | Germany | Chest and abdominal CT | 207 (124/83) | 71–84 |
| Liu et al. ( | 2025 | OP diagnosis | Single-center | China | Abdominal CT | 509 (272/237) | 58 ± 12 |
| Du et al. ( | 2025 | OP diagnosis | Single-center | China | Low-dose abdominal CT | 456 (217/239) | 50–91 |
| Petraikin et al. ( | 2025 | OP diagnosis | Multicenter | Russia | Chest CT | 1888 (733/1155) | 66 ± 8 |
| Imani et al. ( | 2025 | OP diagnosis | Multicenter | Australia, USA, China | Hip CT | 300 (300/0) | 73 ± 6 |
| Zhou et al. ( | 2025 | OP diagnosis | Single-center | China | Chest CT | 551 (397/154) | 22–81 |
| Yuan et al. ( | 2025 | Fracture risk prediction | Single-center | China | Hip CT | 254 (NA) | M 83 ± 8 |
| F 80 ± 9 | |||||||
| Li et al. ( | 2025 | OP diagnosis | Single-center | China | Chest CT | 987 (396/591) | 30–89 |
| Guenoun et al. ( | 2025 | Fracture risk prediction | Single-center | France | Hip CT | 100 (28/72) | 76 ± 10 |
| Fang et al. ( | 2024 | OP screening | Single-center | China | Chest CT | 488 (188/300) | Average age > 62 |
| Cheng et al. ( | 2023 | OP diagnosis | Single-center | China | Lumbar spine CT | 154 (51/103) | Average age > 58 |
| Liu et al. ( | 2022 | OP screening | Single-center | China | Clinical examination | 1,508 (705/803) | Average age > 55 |
| Huber et al. ( | 2024 | OP screening | Single-center | USA | Chest CT | 3,708 (1990/1718) | 64 ± 7 |
| Dzierzak et al. ( | 2022 | OP diagnosis | Single-center | Poland | Lumbar spine CT | 100 (41/59) | 53–77 |
| Huang et al. ( | 2022 | OP screening | Single-center | China | Clinical examination | 172 (64/118) | Average age > 62 |
| Mu et al. ( | 2021 | Bone quality assessment | Single-center | China | Lumbar spine CT | 56 (35/21) | 45–69 |
| Wu et al. ( | 2024 | OP screening | Single-center | China | Low-dose chest CT | 3,312 (1772/1540) | All age |
| Rühling et al. ( | 2022 | OP screening | Single-center | Germany | Abdominal CT | 193 (145/48) | 62 ± 14 |
| Pan et al. ( | 2023 | OP diagnosis | Single-center | China | Chest CT | 1,175 (773/402) | Not mention |
| Pan et al. ( | 2020 | OP screening | Single-center | China | Chest CT | 374 (196/178) | 50–88 |
| Sebro et al. ( | 2024 | OP screening | Single-center | USA | Shoulder CT | 194 (24/170) | 69 ± 9 |
| Breit et al. ( | 2023 | OP screening | Single-center | Switzerland | Chest CT | 109 (19/90) | 67 ± 12 |
| Tang et al. ( | 2021 | OP screening | Single-center | China | Spine CT | 213 (38/175) | 17–84 |
| Guha et al. ( | 2024 | OP diagnosis | Single-center | USA | Different CT | 20 (10/10) | 26.2 ± 4.5 |
| Li et al. ( | 2022 | OP diagnosis | Single-center | China | Different CT | 716 (416/300) | 50–97 |
| Uemura et al. ( | 2023 | OP screening | Multicenter | Japan | Hip CT | 857 (189/668) | 70 ± 16.8 |
| Uemura et al. ( | 2023 | OP diagnosis | Single-center | Japan | Spine CT | 59 (18/41) | 66 ± 17 |
| Uemura et al. ( | 2022 | OP diagnosis | Single-center | Japan | Hip CT | 123 (0/123) | 62 ± 10 |
| Tong et al. ( | 2024 | OP screening | Single-center | China | Chest CT | 1,508 (803/705) | M 63 ± 12 |
| F 60 ± 11 | |||||||
| Oh et al. ( | 2024 | OP screening | Single-center | South Korea | Abdominal CT | 268 (122/146) | 58 ± 12 |
| Oh et al. ( | 2024 | OP screening | Single-center | South Korea | Different CT | 112 (17/68) | 61 ± 12 |
| Yoshida et al. ( | 2023 | OP diagnosis | Single-center | Japan | Lumbar spine CT | 402 (91/311) | 49–74 |
| Summers et al. ( | 2011 | OP diagnosis | Single-center | USA | Lumbar spine CT | 475 (0/475) | 42–79 |
| Liu et al. ( | 2024 | Fracture risk prediction | Single-center | USA | Hip CT | 6,926 (2,648/4278) | 70 ± 12 |
| Nam et al. ( | 2019 | OP diagnosis | Single-center | South Korea | Spine CT | 70 (50/20) | 21–95 |
| Naghavi et al. ( | 2023 | OP diagnosis | Single-center | USA | Chest CT | 165 (86/79) | 69 ± 9 |
| Fang et al. ( | 2021 | OP screening | Single-center | China | Different CT | 1,449 (644/805) | 51 ± 14 |
| Yang et al. ( | 2022 | OP screening | Single-center | China | Chest CT | 1,046 (679/367) | Not mention |
| Yasaka et al. ( | 2020 | OP diagnosis | Single-center | Japan | Lumbar spine CT | 183 (112/83) | 60 ± 15 |
| Lim et al. ( | 2021 | OP screening | Single-center | South Korea | Abdomen-pelvic CT | 500 (70/430) | 50–96 |
| Zhang et al. ( | 2019 | Fracture risk prediction | Single-center | China | Lumbar spine CT | 80 (unknown) | Not mention |
| Yong et al. ( | 2021 | OP diagnosis | Single-center | South Korea | Cranial CT | NA | Not mention |
| Bodden et al. ( | 2024 | OP diagnosis, Fracture risk prediction | Single-center | Germany | Chest-abdominal CT | 121 (77/44) | 65 ± 8 |
| Tang et al. ( | 2023 | Fracture risk prediction | Single-center | China | Chest CT | 2076 (1,309/767) | 47–62 |
| Savage et al. ( | 2020 | OP diagnosis | Single-center | USA | Chest CT | 65 (8/57) | 67 ± 10 |
| Park et al. ( | 2023 | OP diagnosis | Single-center | South Korea | Cone-Beam CT | 30 (18/12) | 21–80 |
| Naghavi et al. ( | 2023 | OP diagnosis | Multicenter | USA | Cardiac CT | 5,785 (2,748/3037) | 62 ± 10 |
| Authors and year | Selected area | Selection of ROI | CT features utilization | Reference standard | Performance | ||
|---|---|---|---|---|---|---|---|
| Wu et al. ( | 2025 | T7–L1 | U-Net | Automated | HU | DXA | |
| Li et al. ( | 2025 | T12–L3 | U-Net | Automated | HAP-water | QCT | AUC = 0.979 |
| Wu et al. ( | 2025 | T12–L2 | 3D U-Net | Automated | HU | QCT | |
| Adarve et al. ( | 2025 | L1, L2 | NA | Automated | Radiomics | DXA | AUC = 0.916 |
| Paukovitsch et al. ( | 2025 | T1 – L3 | CNN | Automated | HU | QCT | AUC = 0.96 |
| Liu et al. ( | 2025 | L1-L3 | NA | Manual | Radiomics | QCT | AUC = 0.839 |
| Du et al. ( | 2025 | Proximal femur | VB-Net | Automated | Radiomics | QCT | AUC = 0.96 |
| Petraikin et al. ( | 2025 | T11–L3 | NA | Manual | HU | QCT | AUC = 0.874 |
| Imani et al. ( | 2025 | Proximal femur | NA | Manual | HU | DXA | NA |
| Zhou et al. ( | 2025 | L1–L2 | U-Net | Automated | HU | QCT | AUC = 0.8 |
| Yuan et al. ( | 2025 | Proximal femur | U-Net | Automated | Radiomics | Fracture | AUC = 0.851 |
| Li et al. ( | 2025 | T12–L2 | VB-Net | Automated | HU | QCT | AUC = 0.997 |
| Guenoun et al. ( | 2025 | T1–L5 | U-Net | Automated | HU | Fracture | AUC = 0.92 |
| Fang et al. ( | 2024 | T12–L4 | NA | Manual | Radiomics, HU | DXA | AUC = 0.99 |
| Cheng et al. ( | 2023 | L1–L4 | NA | Manual | Radiomics | DXA | AUC = 0.959 |
| Liu et al. ( | 2022 | T10–L5 | VB-Net | Automated | Radiomics, HU | DXA | AUC = 0.962 |
| Huber et al. ( | 2024 | T12 | Anduin | Automated | HU | DXA | AUC = 0.91 |
| Dzierzak et al. ( | 2022 | L1 | U-Net | Automated | Radiomics | DXA | AUC = 0.96 |
| Huang et al. ( | 2022 | Psoas muscle | NA | Manual | Radiomics | DXA | AUC = 0.87 |
| Mu et al. ( | 2021 | L1–L4 | AI-Rad | Manual | Radiomics, HU | DXA | AUC = 0.923 |
| Wu et al. ( | 2024 | T12–L2 | U-Net | Automated | Radiomics | QCT | AUC = 0.98 |
| Rühling et al. ( | 2022 | T8–L2 | U-Net | Automated | Radiomics | NA | AUC = 0.99 |
| Pan et al. ( | 2023 | L1 | U-Net | Automated | Radiomics | QCT | AUC = 0.903 |
| Pan et al. ( | 2020 | T1–T2 | U-Net | Automated | HU | QCT | AUC = 0.942 |
| Sebro et al. ( | 2024 | Humerus, Glenoid, Coracoid, Acromion, Clavicle, Ribs | NA | Manual | Radiomics, HU | DXA | AUC = 0.988 |
| Breit et al. ( | 2023 | Thoracic | 3D CNN | Automated | Radiomics | DXA | AUC = 0.93 |
| Tang et al. ( | 2021 | L1 | U-Net | Automated | Radiomics | DXA | AUC = 0.917 |
| Guha et al. ( | 2024 | Distal Tibia | 3D GAN-CIRCLE Model | Semi-automated | Radiomics | DXA | NA |
| Li et al. ( | 2022 | L1–L3 | NA | Manual | Radiomics | DXA | NA |
| Uemura et al. ( | 2023 | Proximal femur and L1–L4 | U-Net | Automated | Radiomics | DXA | AUC = 0.976 |
| Uemura et al. ( | 2023 | L1–L4 | U-Net | Automated | Radiomics | DXA | AUC = 0.941 |
| Uemura et al. ( | 2022 | Proximal femur | U-Net | Automated | Radiomics | DXA | AUC = 0.97 |
| Tong et al. ( | 2024 | T10–L5 | VB-Net | Automated | Radiomics, HU | DXA | AUC = 0.97 |
| Oh et al.( | 2024 | L1–L4 | U-Net | Semi-Automated | Radiomics, HU | DXA | AUC = 0.781 |
| Oh et al. ( | 2024 | L1–L2 | U-Net | Automated | Radiomics, HU | DXA | AUC = 0.847 |
| Yoshida et al. ( | 2023 | L1–L4 | U-Net | Automated | Radiomics | DXA | AUC = 0.921 |
| Summers et al. ( | 2011 | L1–L5 | Rad Companion | Automated | Radiomics, HU | DXA | |
| Liu et al. ( | 2024 | Femur, lumbar vertebra, etc. | U-Net | Automated | Radiomics, HU | DXA | AUC = 0.702 |
| Nam et al. ( | 2019 | L1–L3 | U-Net | Automated | HU | DXA | AUC = 0.925 |
| Naghavi et al. ( | 2023 | Thoracic and lumbar | U-Net | Automated | Radiomics | DXA | |
| Fang et al. ( | 2021 | L1–L4 | U-Net | Automated | Radiomics | QCT | |
| Yang et al. ( | 2022 | Thoracic and lumbar | AI-Rad Companion | Automated | Radiomics, HU | DXA | AUC = 0.831 |
| Yasaka et al. ( | 2020 | L1 – L5 | CNN | Automated | Radiomics | DXA | AUC = 0.970 |
| Lim et al. ( | 2021 | Left proximal femur | NA | Manual | Radiomics | DXA | AUC = 0.96 |
| Zhang et al. ( | 2019 | L1 | NA | Manual | Radiomics | NA | |
| Yong et al. ( | 2021 | Human Skull | QCBCT-NET | Automated | Radiomics, HU | QCT | NA |
| Bodden et al. ( | 2024 | L1–L4 | CNN | Automated | Radiomics | DXA | NA |
| Tang et al. ( | 2023 | Ribs | U-Net | Automated | Radiomics | DXA | AUC = 0.706 |
| Savage et al. ( | 2020 | Thoracic vertebra | AdaBoost | Automated | HU | DXA | NA |
| Park et al. ( | 2023 | Maxilla, Mandible | QCBCT-NET | Automated | Radiomics | QCT | |
| Naghavi et al. ( | 2023 | Thoracic vertebra | U-Net | Automated | Radiomics | NA | |
Peer Reviews
No public reviews on file for this paper yet. If you reviewed it on a platform where reviews are public (OpenReview, ICLR, NeurIPS, ICML), you can paste yours below so the community can read it here.
Videos
No videos yet. Explain this paper in a talk, walkthrough, or lecture? Add one.
Taxonomy
TopicsArtificial Intelligence in Healthcare and Education · Bone health and osteoporosis research · Dental Radiography and Imaging
Introduction
1
Osteoporosis is a systemic condition marked by reduced bone mineral density (BMD) and deterioration of the bone’s microstructure, leading to increased brittleness and a higher likelihood of fractures. During the period of 2017 to 2018, the age-adjusted prevalence of osteoporosis among individuals aged 50 and older was recorded at 12.6% (1). The clinical and economic impact of fractures related to osteoporosis is significant. Each year in the United States, approximately 2 million new osteoporotic fractures occur, resulting in an estimated total expenditure of $17 billion. The negative consequences of these fractures include functional limitations, chronic pain, decreased quality of life, loss of autonomy, and heightened mortality risk, particularly following hip and clinical vertebral fractures (2). Consequently, the early detection of osteoporosis is essential for prompt intervention and the prevention of osteoporotic fractures and their associated complications.
The current gold standard for diagnosing osteoporosis in clinical practice is measuring BMD using dual-energy X-ray absorptiometry (DXA). DXA utilizes two different energy beams of X-rays that pass through body tissues, measuring the attenuation of X-rays to determine BMD based on the absorption characteristics of the tissues. According to the current diagnostic criteria for osteoporosis recommended by the World Health Organization, osteoporosis is defined for postmenopausal women and men aged 50 years and older as a BMD T-score of ≤ − 2.5, as measured by DXA at the lumbar spine, hip, or distal radius. This indicates a bone density that is 2.5 standard deviations or more below the mean value for young adults (3). However, DXA measurements reflect a two-dimensional assessment of bone mineral content and fail to account for geometric differences and structural variations, making them less sensitive to changes in bone strength. Furthermore, clinical practice has shown that DXA results can be affected by factors such as bone spurs, internal fixation devices, and ectopic calcification, leading to inaccuracies in bone density readings (4). Consequently, the capability of DXA for early diagnosis and precise assessment of osteoporosis is limited.
Quantitative computed tomography (QCT) is a multi-planar, three-dimensional imaging technique for measuring bone mineral density, which allows for the macroscopic assessment of the material and structural properties of bone. It provides clinicians with more accurate descriptions of bone shape, size, and quality compared to DXA. Unlike the two-dimensional measurements offered by DXA, QCT can separately evaluate cortical and trabecular bone, offering a more comprehensive assessment of three-dimensional skeletal parameters and enabling more precise diagnosis of osteoporosis (5). This approach is particularly useful for evaluating trabecular volumetric BMD, with osteoporosis being diagnosed at levels below 80 mg/cm^3^. Low bone mass is defined by measurements ranging from 80 to 120 mg/cm^3^, following the diagnostic standards established by the American College of Radiology (ACR). However, the lack of standardized large databases that are age, sex, and ethnicity-matched limits QCT’s ability to provide personalized age-based bone assessments, restricting its application in clinical practice. This limitation is particularly significant in cases requiring comprehensive considerations of individual patient factors for osteoporosis diagnosis and risk evaluation. Furthermore, the need for specialized examinations can result in additional costs, cumbersome computational processes, and increased radiation exposure, further complicating the clinical implementation of QCT in routine practice (6).
An emerging and convenient strategy for assessing BMD involves the widespread use of conventional computed tomography (CT) scans, which do not require patients to incur additional costs for specialized bone density examinations or face increased radiation exposure. However, the complexity of image segmentation and the extraction of regions of interest hinder broad implementation (7). With the continuous integration and advancement of artificial intelligence (AI) in medical imaging, these cumbersome tasks can be streamlined. Opportunistic BMD screening utilizing CT images collected for different indications is now feasible with AI support. Integrating AI with traditional CT imaging significantly enhances the scope of osteoporosis screening and improves diagnostic accuracy. Furthermore, with increasing computational power, factors such as gender, ethnicity, and age can be incorporated into the analysis. This combination of AI and CT imaging offers a more nuanced assessment of bone health, paving the way for transformative strategies in the future diagnosis and treatment of osteoporosis.
This review aims to explore the application of AI in conjunction with CT for the diagnosis of osteoporosis. It will provide a comprehensive overview of various AI algorithms, highlighting their strengths and limitations when integrated with different types of CT imaging data. Additionally, the review will discuss potential future directions for this innovative approach, emphasizing how AI can enhance diagnostic accuracy, streamline processes, and ultimately improve patient outcomes in the field of osteoporosis management. By addressing these aspects, this review seeks to contribute valuable insights into the evolving landscape of osteoporosis diagnostics, emphasizing the role of AI as a transformative tool in clinical practice.
Materials and methods
2
Our protocol was developed in accordance with the Preferred Reporting Items for Systematic Reviews and Meta-Analyses Protocols (PRISMA-P) guidelines and was critically reviewed and approved by all authors (8).
To ensure that this scoping review remains comprehensive and focused, the inclusion criteria were designed to specifically capture studies applying AI techniques to CT-based osteoporosis assessment. Eligible articles were those that employed artificial intelligence, machine learning, or deep learning methods for the classification of osteoporosis or osteopenia, or for the determination of bone mineral density, using CT images of the vertebrae or other skeletal regions. Studies utilizing either conventional or low-dose CT, with or without contrast enhancement, were included.
Papers were eligible if they were published in English, involved human participants, and provided explicit information on AI-assisted CT analysis for osteoporosis assessment. Studies employing quantitative, qualitative, or mixed research designs were all considered to encompass a wide range of methodological perspectives. Articles not meeting these criteria were excluded. This selection strategy ensured that the review remained both comprehensive and targeted, facilitating a deeper understanding of how AI-driven diagnostic workflows using CT imaging can enhance the detection, classification, and management of osteoporosis in clinical and opportunistic screening contexts.
To identify all relevant studies, a comprehensive search was conducted across PubMed, EMBASE, and Web of Science databases covering the period from January 1995 to October 2025. The initial search strategy was developed by the review team and refined through iterative discussions to ensure both sensitivity and specificity.
The following search string was used for PubMed: (“CT”[tiab] OR “computed tomography”[tiab]) AND (“artificial intelligence”[tiab] OR “AI”[tiab] OR “machine learning”[tiab] OR “deep learning”[tiab]) AND (“osteoporosis”[tiab] OR “bone mineral density”[tiab] OR “BMD”[tiab]).
Equivalent search strategies, adapted to the syntax of each database, were applied to EMBASE and Web of Science.
Initially, all search results were imported into EndNote X9 software, where duplicate articles were identified and removed. Subsequently, reviewers assessed the titles and abstracts to further filter the studies. The reviewers then read the full texts to determine the final studies to be included in the review. During this process, any relevant articles that emerged were also considered for inclusion. In cases where disagreements arose regarding the study type, data type, or other extracted information, they were resolved through discussion. The literature screening process for this study is illustrated in Figure 1.
Literature search flow and final inclusion criteria for this review.
The primary objective of this review is to explore the application of AI combined with CT imaging in the diagnosis of osteoporosis. Accordingly, we designed tables and figures to systematically compare and discuss the standardized workflows, application contexts, and performance of all included studies. This approach provides a comprehensive overview of the current landscape and effectiveness of AI in osteoporosis diagnosis (see Figure 2).
The distribution of the regions of interest selected for all the included CT images in the study.
Results
3
Search results
3.1
Per the PRISMA guidelines, our review process began with the identification of 377 records through database searches (Figure 1). After removing 157 duplicate records, the remaining articles underwent title and abstract screening. During this stage, several studies were excluded because they were reviews, conference papers, or other non-journal publications. A total of 72 articles were retrieved for full-text assessment. Following a detailed evaluation, 51 studies were found to meet the inclusion criteria, specifically focusing on the application of AI techniques to CT imaging for osteoporosis or bone mineral density analysis. These eligible studies were included in the final review and subjected to comprehensive data extraction and thematic synthesis.
Study characteristics overview
3.2
The scoping review ultimately included 51 studies, which are systematically summarized in Table 1, detailing their objectives, research design, imaging sources, and participant demographics. Studies were published between 2019 and 2025 and originated from diverse geographic regions, with Asia—particularly China—accounting for nearly half of all publications (49%). The majority of investigations were single-center and retrospective in nature (84.3%), whereas only a limited proportion incorporated multicenter cohorts or external validation (15.7%), highlighting a general lack of large-scale validation across institutions.
Study objectives clustered around three main topics: osteoporosis diagnosis (45.1%), opportunistic screening (39.2%) and fracture-risk prediction (15.7%). Chest CT (33.3%), lumbar spine CT (15.7%) and abdominal CT (11.8%) were the most frequently utilized imaging sources, reflecting the increasing interest in opportunistic use of routinely acquired CT data. Participant cohorts were largely adult and elderly populations (typical age ranges spanning roughly from the third to the ninth decades), with a predominance of female participants, consistent with the epidemiology of osteoporosis.
Osteoporosis diagnosis: high accuracy accompanied by pronounced technical heterogeneity
3.2.1
AI-enhanced CT demonstrated consistently high accuracy for osteoporosis diagnosis, with reported AUC values ranging from 0.80 to 0.997. Overall, 78.1% of studies achieved an AUC ≥ 0.9 (e.g., (10); (13)). Diagnostic performance was highest when lumbar spine ROIs were used, particularly T12–L3 or L1–L4 segments, where AUC values ranged from 0.903 to 0.997. No substantial performance difference was observed between HU-based quantitative workflows and radiomics-based approaches, with HU-based methods showing strong quantitative agreement (R^2^ > 0.98) and radiomics-based models achieving comparable classification accuracy (AUC ≈ 0.96). In addition to spinal ROIs, the proximal femur also served as an effective alternative diagnostic site; for example, Du et al. (15) reported an AUC ≥ 0.9, supporting the feasibility of multi-site CT-based osteoporosis diagnosis.
However, several sources of technical and population-related heterogeneity were evident. Diagnostic accuracy was strongly influenced by ROI extent, as studies using narrowly defined ROIs such as L1–L2 (18) reported substantially lower performance (AUC = 0.80) compared with those employing broader ROIs (e.g., T12–L4). Heterogeneity in reference standards further limited cross-study comparability: while 68.6% of studies used DXA and 21.6% used QCT, even identical ROIs (L1–L3) yielded different performance when validated against DXA [AUC = 0.925; (45)] versus QCT [AUC = 0.874; (16)]. In addition, marked population bias was observed, with 82.4% of studies focusing on individuals aged ≥50 years and only 9% including younger populations, often with small sample sizes [e.g., n = 20 (34)], leaving diagnostic applicability in younger or healthy populations insufficiently characterized.
Opportunistic screening: efficiency gains accompanied by context-dependent limitations
3.2.2
Opportunistic screening based on chest or abdominal CT accounted for 39.2% of the included studies. Its core advantage is the absence of additional radiation exposure. Fully automated HU-based models [e.g., (11, 24)] enabled large-scale screening (n > 3,000), achieving AUC values ranging from 0.781 to 0.99. Screening based on non-traditional sites, such as shoulder CT (31), also demonstrated high accuracy (AUC = 0.988), extending opportunistic screening beyond the axial skeleton.
However, screening performance was strongly dependent on imaging coverage. Chest CT typically includes only T7–L1 vertebrae, whereas abdominal CT primarily captures L1–L4, which limits direct model transferability across different screening scenarios. In addition, the impact of low-dose CT on screening accuracy remains insufficiently characterized. Only 5 of 51 studies employed low-dose CT protocols; although Du et al. (15) reported an AUC of 0.96, no direct comparison with standard-dose CT was conducted to evaluate feature stability. Finally, a trade-off between automation efficiency and interpretability was evident. Approximately 75% of screening studies adopted end-to-end CNN-based models [e.g., (28)], achieving high throughput but offering limited explanation of the imaging features underlying osteoporosis detection, which may constrain clinical acceptance.
Fracture risk prediction: multimodal advantages and performance bottlenecks
3.2.3
Fracture risk prediction represented the smallest proportion of included studies (15.7%) and demonstrated relatively modest performance, with reported AUC values ranging from 0.702 to 0.92. A majority of these studies (62.5%) adopted multimodal models integrating CT-derived imaging features with clinical variables. Models using site-matched ROIs showed comparatively better performance; for example, Yuan et al. (19) used proximal femur CT to predict hip fracture risk and achieved an AUC of 0.851, supporting the value of anatomical correspondence between ROI selection and fracture outcome.
However, several limitations constrained predictive performance and robustness. Overall performance was substantially lower than that reported for osteoporosis diagnosis or screening, with only 3 of 4 studies achieving an AUC ≥ 0.8, and Liu et al. (44) reporting an AUC of 0.702 using combined femoral and lumbar ROIs. This likely reflects the multifactorial nature of fracture risk, which encompasses bone quality, fall risk, and comorbidities that were not comprehensively captured in most models. In addition, limited sample size undermined result stability: among the eight studies, only two [e.g., (20)] included more than 500 participants, while the remainder relied on small cohorts (n < 300) without large-scale validation. Finally, the absence of standardized fracture risk endpoints further limited comparability, as some studies predicted any fracture whereas others focused on major osteoporotic fractures, precluding direct cross-study comparison.
Overview of study workflows
3.3
HU-based quantitative workflow
3.3.1
This approach was used in 47.1% of the included studies (Table 2; Figure 3A). After ROI segmentation using algorithms such as U-Net or VB-Net, quantitative features—including mean and distributional Hounsfield Unit (HU) values—were directly extracted from CT images for BMD estimation or osteoporosis classification. Its core advantages include a high degree of automation and low computational cost, without the need for complex feature engineering, making it well suited for opportunistic screening using chest or abdominal CT [e.g., Wu et al. (9) achieved BMD prediction with an R^2^ > 0.98 using T12–L2 ROIs on chest CT]. However, this approach primarily captures overt bone density loss and is relatively insensitive to early microstructural bone alterations.
The main intelligent image-recognition methods. (A) Traditional machine learning based on radiomics/Hounsfield unit (HU) value, characterized by the pre-definition of imaging features. (B) End-to-end deep learning workflow. (C) A multimodal or hybrid workflow that integrates clinical features with CT-derived imaging features for comprehensive osteoporosis assessment.
Radiomics-based workflow
3.3.2
This approach was adopted in 70.6% of the included studies. Following ROI segmentation, multidimensional radiomic features—including texture, morphological, and intensity-based statistics—were extracted and modeled using conventional machine learning algorithms such as support vector machines and random forests (Figure 3A). Its main advantage lies in capturing microstructural bone alterations, including trabecular heterogeneity and connectivity; for example, Cheng et al. (22) achieved early osteopenia identification using L1–L4 lumbar ROIs with an AUC of 0.959. However, the workflow involves higher procedural complexity and is less suitable for large-scale screening applications.
End-to-end deep learning workflow
3.3.3
These studies employ CNNs, 3D U-Nets, or Transformer-based models to directly learn predictive features from raw CT images for BMD estimation or osteoporosis risk stratification, without explicit feature extraction (Figure 3B). This end-to-end approach offers higher automation, reduced human intervention, and improved cross-device generalizability, but the interpretability of features associated with BMD changes or fracture risk is limited.
Multimodal or hybrid workflow
3.3.4
This workflow was primarily applied in fracture risk prediction studies, where CT-derived imaging features (HU values and/or radiomic features) were integrated with clinical variables such as age, sex, BMI, and fracture history to construct predictive models (Figure 3C). This approach captures the combined risk arising from bone quality and overall health status; for example, Guenoun et al. (20) achieved an AUC of 0.92 for vertebral fracture prediction by integrating thoracic CT HU values with clinical history. However, this workflow is the most complex and exhibits greater heterogeneity than single-modality models.
Drivers of study-level heterogeneity and performance variability
3.4
To identify the sources of heterogeneity across studies, principal component analysis (PCA) was performed on nine key variables from the 51 included studies: number of centers, mean age, proportion of female participants, CT modality, anatomical scan region, segmentation strategy, feature extraction method, reference standard, and model performance (Figure 4). The first two principal components jointly explained 35.55% of the total variance (PC1: 18.78%; PC2: 16.77%).
Principal component analysis (PCA) of study-level heterogeneity. PCA based on nine key study-level variables across the included studies. The first two principal components (PC1 and PC2) are shown. Red arrows represent the loading vectors of individual variables, indicating the direction and magnitude of their contributions to variance in the PCA space, including number of centers, mean age, proportion of female participants, CT modality, anatomical scan region, segmentation strategy, feature extraction method, reference standard, and model performance. The relative orientation and length of the arrows reflect correlations among variables and their influence on study heterogeneity.
PC1 was primarily driven by model performance (loading = 0.49), proportion of female participants (loading = −0.47), and mean age (loading = −0.40), indicating that studies involving younger populations with a lower female proportion tended to report higher model performance.
PC2 was mainly influenced by anatomical scan region (loading = −0.53), feature extraction strategy (loading = −0.51), and number of centers (loading = 0.43). These findings suggest that single-center studies focusing on core skeletal sites such as the lumbar spine or hip and employing combined HU and radiomics features achieved higher performance, whereas multicenter studies—often designed to reflect real-world clinical scenarios such as opportunistic screening using chest CT—tended to analyze non-core regions and simpler feature sets, resulting in slightly lower performance but improved generalizability.
Together, these findings quantitatively demonstrate that population characteristics, anatomical focus, and methodological choices jointly shape reported model performance across studies.
Discussion
4
Core findings and clinical implications
4.1
This scoping review synthesizes 51 studies and demonstrates that AI-enhanced CT imaging has progressed from proof-of-concept toward task-specific clinical utility in osteoporosis assessment. Rather than algorithmic complexity alone, model performance across studies was primarily determined by the alignment between clinical task (diagnosis, screening, or risk prediction), anatomical target, and analytical workflow, a pattern consistently supported by both subgroup analyses and PCA findings.
Osteoporosis diagnosis represented the most technically mature application. Across studies, diagnostic performance was consistently high (AUC 0.80–0.997), particularly when lumbar spine ROIs spanning L1–L4 or T12–L3 were used. This anatomical advantage is biologically plausible, as the lumbar spine contains a high proportion of trabecular bone, which is metabolically active and sensitive to early osteoporotic changes (58). Importantly, both HU-based quantitative workflows and radiomics-based approaches achieved comparable diagnostic accuracy, but through fundamentally different mechanisms. HU-based models predominantly captured global bone mineral density loss and showed excellent agreement with DXA and QCT (R^2^ > 0.98), making them well suited for standardized diagnosis and large-scale deployment. In contrast, radiomics-based models leveraged texture and heterogeneity features to characterize trabecular microarchitecture, enabling improved sensitivity for early osteopenia where mean HU values alone may remain within normal ranges (59). These findings suggest that HU- and radiomics-based workflows should be viewed as complementary rather than competing strategies, optimized for different stages of skeletal deterioration.
Opportunistic screening emerged as a distinct translational pathway rather than a simple extension of diagnostic modeling. Nearly 40% of included studies repurposed chest or abdominal CT scans acquired for unrelated clinical indications, confirming the feasibility of embedding osteoporosis assessment into routine imaging workflows without additional radiation exposure. However, screening scenarios imposed stricter constraints on model design, including incomplete vertebral coverage, heterogeneous scan protocols, and the need for full automation. Accordingly, HU-based and end-to-end deep learning models predominated, prioritizing robustness and scalability over maximal accuracy. The observation that non-traditional sites, such as shoulder CT, could also yield high screening performance further challenges the conventional reliance on axial skeletal regions and underscores the adaptability of CT-based AI when anatomical context is carefully considered. Nevertheless, performance variability across scan regions highlights that opportunistic screening models are inherently context-dependent and cannot be indiscriminately transferred across imaging protocols.
In contrast to diagnosis and screening, fracture risk prediction remained the least mature and most heterogeneous application. Although multimodal models integrating imaging features with clinical variables consistently outperformed imaging-only approaches, overall performance was modest (AUC 0.70–0.92). This gap reflects a fundamental conceptual distinction: fracture risk is a prospective, multifactorial outcome driven not only by bone density and microstructure, but also by fall mechanics, muscle strength, neuromuscular coordination, and comorbidities (60, 61). CT-derived skeletal features capture only one component of this risk cascade, explaining why even anatomically matched, high-quality imaging fails to achieve diagnostic-level accuracy. These findings suggest that fracture prediction should be framed not as an extension of osteoporosis diagnosis, but as a distinct modeling problem requiring broader phenotypic integration.
Evidence-based drivers of heterogeneity across studies
4.2
Beyond task-specific differences, substantial heterogeneity was observed across studies, and the PCA analysis provides quantitative insight into its underlying drivers. The first principal component linked model performance with population characteristics, particularly age distribution and sex composition. Studies involving younger cohorts and lower proportions of female participants consistently reported higher accuracy, a pattern likely attributable to reduced imaging confounders. In elderly populations—especially postmenopausal women—degenerative changes, osteophytes, vertebral deformities, and prior fractures introduce complex imaging patterns that challenge both density-based and texture-based models (62). This observation highlights that reported performance metrics cannot be interpreted independently of population context.
The second principal component reflected methodological trade-offs between anatomical focus, feature strategy, and study scale. Single-center studies targeting core skeletal regions (lumbar spine or proximal femur) and employing richer feature representations tended to achieve higher peak performance. In contrast, multicenter studies—often designed to approximate real-world opportunistic screening—frequently analyzed non-core regions and relied on simpler features, resulting in slightly lower accuracy but improved generalizability. These findings reveal an inherent tension between methodological optimization and clinical realism, suggesting that maximal performance achieved under controlled conditions may not translate directly to routine practice.
Geographical and study-design bias further contributed to heterogeneity. Nearly half of the included studies were conducted in China, and most adopted single-center retrospective designs, reflecting the availability of large-scale CT archives and centralized healthcare systems. While this setting facilitates rapid model development and high internal performance, it may underrepresent interethnic variability and real-world practice patterns, potentially inflating reported accuracy. This imbalance underscores the need for prospective, multicenter, and cross-ethnic validation to ensure robust generalizability.
Additional heterogeneity arose from inconsistent ROI definitions, segmentation strategies, and reference standards. Even when identical vertebral levels were analyzed, validation against DXA versus QCT produced divergent performance estimates, reflecting fundamental differences in what these reference standards measure. Without harmonized methodological frameworks, cross-study comparisons risk conflating true model capability with study-specific design choices.
Gaps and suggestions on clinical implementation pathways
4.3
Despite strong technical performance, translation into routine clinical practice remains limited. Most studies prioritized algorithmic accuracy over prospective validation, workflow integration, or regulatory considerations. End-to-end deep learning models dominate the field due to their efficiency and automation, yet their limited interpretability may hinder clinician trust and adoption, particularly in screening contexts where false positives can have downstream consequences.
To bridge this gap, future research should build on our findings to address three critical gaps:
First, standardization: Adopt consensus protocols for ROI selection (e.g., L1-L4 for diagnosis, T7-L1 for chest CT screening) and dual reference standards (DXA + QCT) to enable cross-study benchmarking. Publicly available annotated datasets with standardized imaging parameters would accelerate this alignment.
Second, context-aware model design: Match workflows to clinical purpose—HU-based/end-to-end models for screening, radiomics for early diagnosis, and multimodal models (integrating imaging, clinical data, and fall risk factors) for fracture prediction—rather than pursuing a “one-size-fits-all” approach. Explainable AI (XAI) should be integrated into end-to-end models to highlight key decision-making features (e.g., HU thresholds, trabecular texture), enhancing clinical acceptance.
Third, prospective multicenter validation: Conduct large-scale studies (n > 10,000) to evaluate real-world performance, particularly for opportunistic screening in lung cancer or abdominal CT programs. Integration with PACS/EMR systems and attention to regulatory compliance are essential for routine deployment.
Ultimately, the greatest value of AI-enhanced CT may lie not in replacing existing standards, but in complementing them—enabling large-scale opportunistic screening, refining risk stratification, and identifying individuals who would benefit most from targeted DXA, QCT, or preventive intervention.
Limitations
4.4
Our scoping review has several limitations. First, despite the use of a comprehensive search strategy, relevant studies published in non-English languages or indexed in non-major databases may have been missed. Second, considerable heterogeneity across included studies—particularly in CT acquisition parameters, reference standards, and AI modeling approaches—limited direct comparison and precluded quantitative synthesis. Third, this review focused solely on CT-based applications and did not include AI studies using other imaging modalities, such as X-ray or MRI, which may offer complementary insights. Finally, most included studies were retrospective and single-center, potentially limiting the generalizability of our findings to broader populations and real-world clinical settings.
Conclusion
5
This scoping review identifies three principal application areas of CT-based artificial intelligence in osteoporosis—diagnosis, opportunistic screening, and fracture-risk prediction. AI-enhanced CT already demonstrates diagnostic and screening performance comparable to DXA and QCT. Fracture-risk prediction, although clinically more meaningful, requires further optimization through multimodal data integration. Nonetheless, heterogeneous methodologies and the absence of standardized processing pipelines or clinical validation frameworks continue to limit comparability and translation. Integrating AI directly into routine CT workflows has the potential to substantially reduce the cost of osteoporosis detection, promote earlier identification and treatment, and ultimately lessen the global burden of osteoporotic disease.
The reference list from the paper itself. Each links out to its DOI / PubMed record.
- 1Sarafrazi N Wambogo EA Shepherd JA. Osteoporosis or low bone mass in older adults: United States, 2017-2018. NCHS Data Brief. (2021) 405:1–8.34029181 · pubmed ↗
- 2Singer A Mc Clung MR Tran O Morrow CD Goldstein S Kagan R . Treatment rates and healthcare costs of patients with fragility fracture by site of care: a real-world data analysis. Arch Osteoporos. (2023) 18:42. doi: 10.1007/s 11657-023-01229-7, 36905559 PMC 10008255 · doi ↗ · pubmed ↗
- 3White L. Osteoporosis prevention, screening, and diagnosis: ACOG recommendations. Am Fam Physician. (2022) 106:587–8.36379483 · pubmed ↗
- 4Xu XM Li N Li K Li XY Zhang P Xuan YJ . Discordance in diagnosis of osteoporosis by quantitative computed tomography and dual-energy X-ray absorptiometry in Chinese elderly men. J Orthop Translat. (2019) 18:59–64. doi: 10.1016/j.jot.2018.11.003, 31508308 PMC 6718941 · doi ↗ · pubmed ↗
- 5Anderson KB Tembo MC Sui SX Hyde NK Pasco JA Kotowicz MA . Peripheral quantitative computed tomography (p QCT) measures are associated with prior low trauma fracture in men. Arch Osteoporos. (2021) 16:178. doi: 10.1007/s 11657-021-00996-5, 34825263 · doi ↗ · pubmed ↗
- 6Deshpande N Hadi MS Lillard JC Passias PG Linzey JR Saadeh YS . Alternatives to DEXA for the assessment of bone density: a systematic review of the literature and future recommendations. J Neurosurg Spine. (2023) 38:436–45. doi: 10.3171/2022.11.SPINE 22875, 36609369 · doi ↗ · pubmed ↗
- 7Smets J Shevroja E Hugle T Leslie WD Hans D. Machine learning solutions for osteoporosis-a review. J Bone Miner Res. (2021) 36:833–51. doi: 10.1002/jbmr.4292, 33751686 · doi ↗ · pubmed ↗
- 8Moher D Shamseer L Clarke M Ghersi D Liberati A Petticrew M . Preferred reporting items for systematic review and meta-analysis protocols (PRISMA-P) 2015 statement. Syst Rev. (2015) 4:1. doi: 10.1186/2046-4053-4-1, 25554246 PMC 4320440 · doi ↗ · pubmed ↗