Risk factors for postoperative pulmonary complications in esophageal cancer: focus on inflammatory markers
Mengchao Xue, Ruihao Zhang, Yirou Ma, Yiyang Liu, Junjie Liu, Zhenyi Li, Bingtao Huang, Zheng Ma, Ming Lu, Yongxin Zhou

TL;DR
This study identifies clinical and inflammatory factors that increase the risk of lung complications after surgery for esophageal cancer.
Contribution
The study introduces new inflammatory markers and clinical parameters as independent predictors of postoperative pulmonary complications in esophageal cancer patients.
Findings
Higher eosinophil count, intraoperative pleural metastasis, and postoperative ICU admission are significant risk factors for PPCs.
Lymphocyte-to-monocyte ratio (LMR) acts as a protective factor against PPCs.
A nomogram based on these factors showed limited discriminative ability but acceptable clinical utility.
Abstract
In patients with esophageal cancer (EC), postoperative pulmonary complications (PPCs) have an impact on both the long-term prognosis and postoperative recovery. The prognostic utility of novel inflammatory biomarkers for PPCs is yet unknown, despite the fact that systemic inflammation is a hallmark of malignancy. The objective of this study was to methodically identify perioperative parameters that are independently linked to the formation of PPCs, with an emphasis on inflammatory markers. 781 individuals receiving elective EC resection between January 2022 and December 2024 were included in this retrospective, single-center cohort analysis. Patients were divided into two groups at random: a validation set (n = 232) and a training set (n = 549). To find independent factors linked to PPCs, univariate and multivariate logistic regression analyses were carried out. A nomogram based on the…
Genes, proteins, chemicals, diseases, species, mutations and cell lines named across the full text — each resolved to its canonical identifier and authoritative record.
Click any figure to enlarge with its caption.
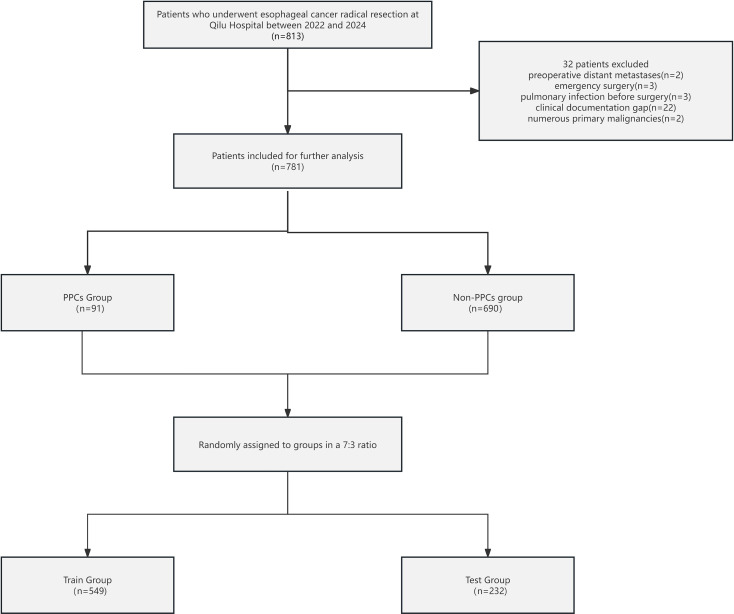 Figure 1
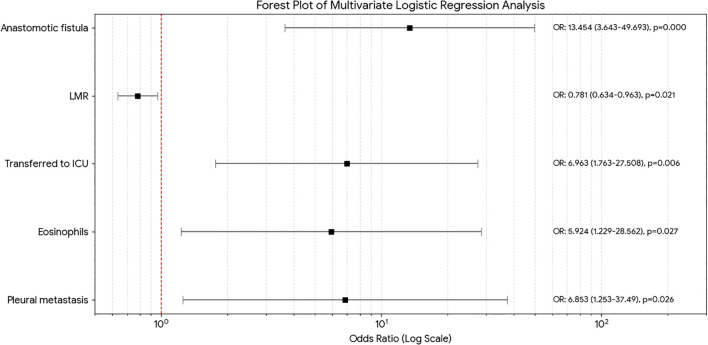 Figure 2
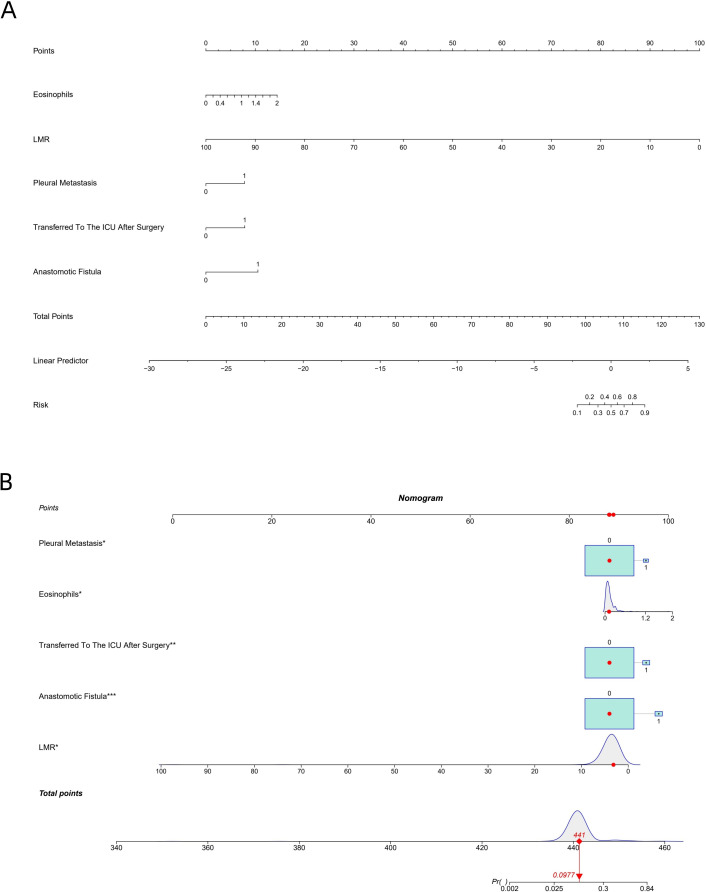 Figure 3
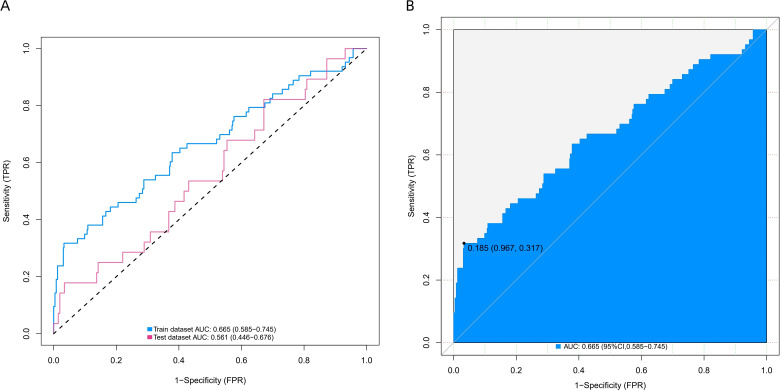 Figure 4
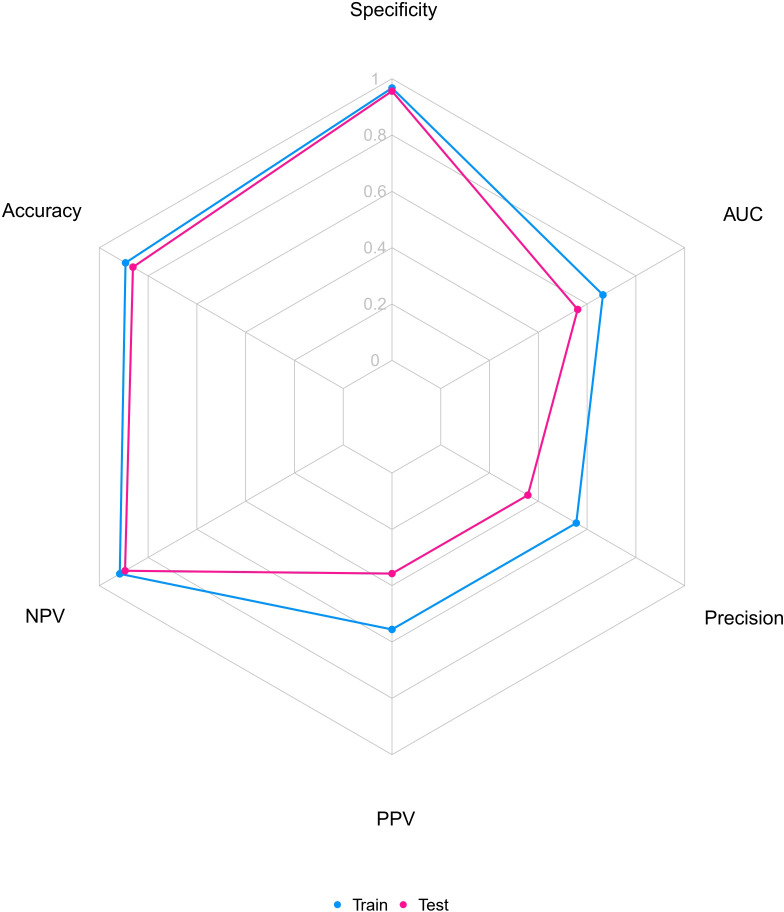 Figure 5
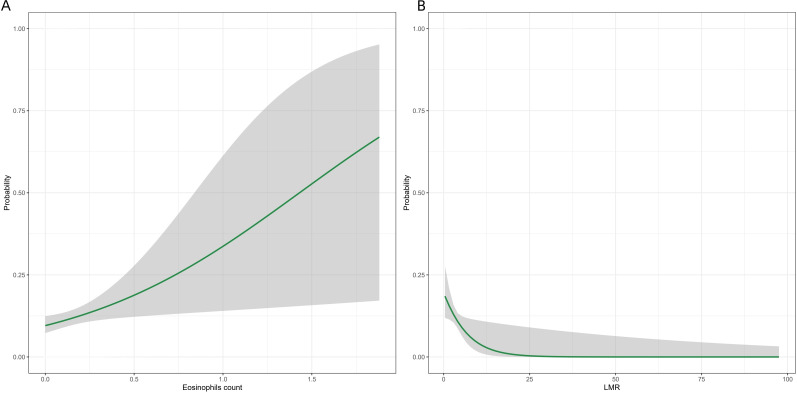 Figure 6
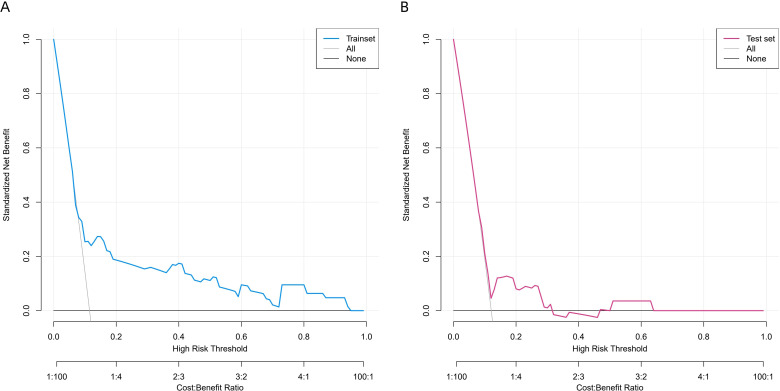 Figure 7
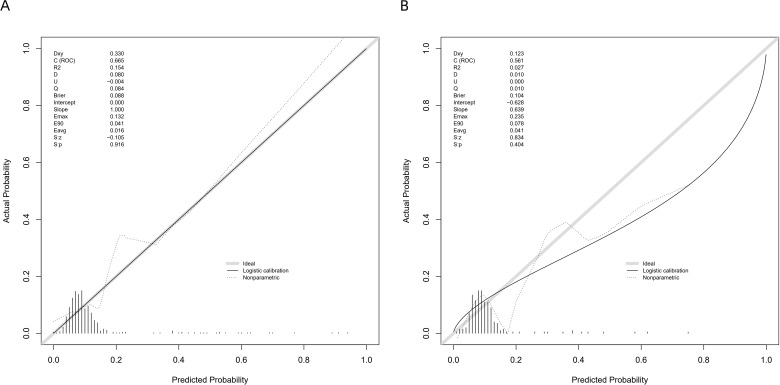 Figure 8
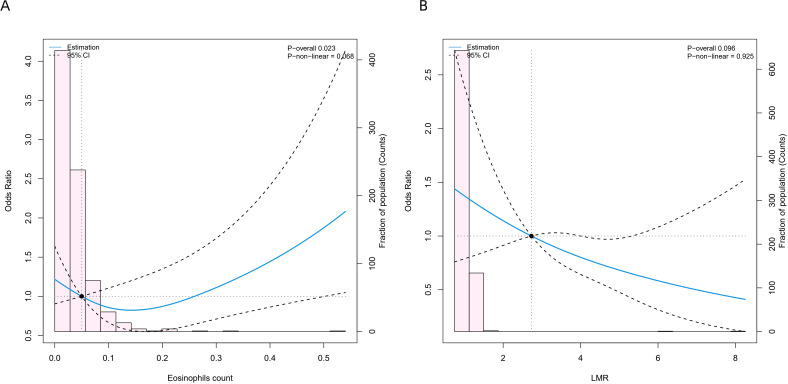 Figure 9
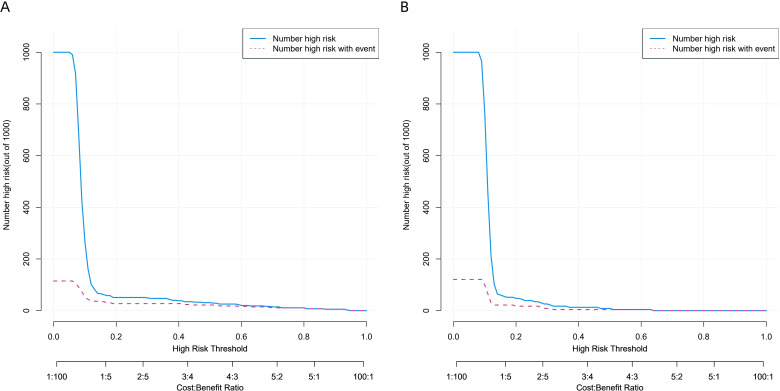 Figure 10
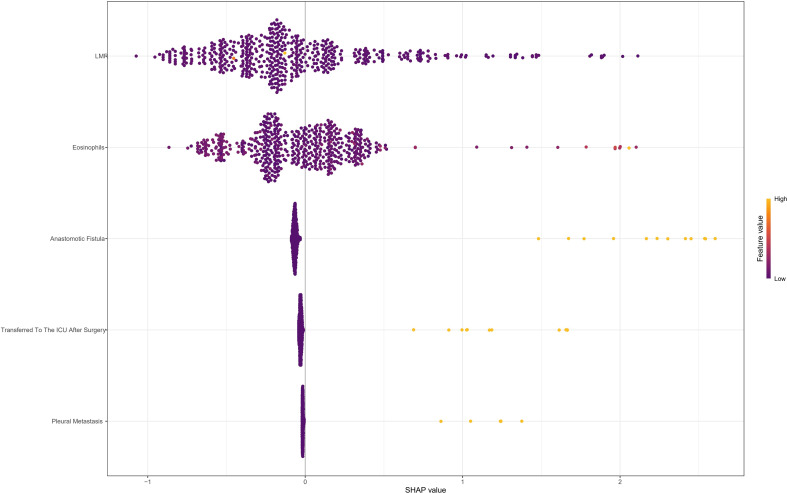 Figure 11
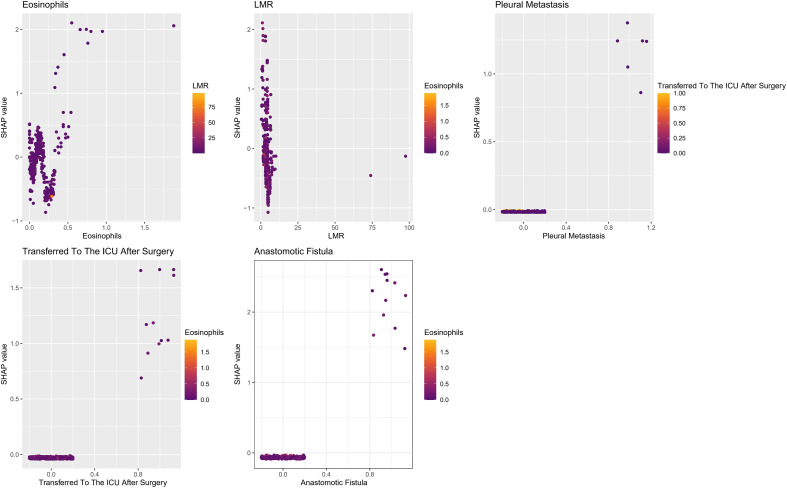 Figure 12
| Variables | Total (N = 781) | Non-PPCs (N = 690) | PPCs (N = 91) |
|
|---|---|---|---|---|
| Age,Median(Q1,Q3) | 63.00(57.50,69.00) | 63.00(57.75, 69.00) | 65.00(57.00, 71.00) | 0.182 |
| Smoking Index,Median(Q1,Q3) | 200.00(0.00,600.00) | 200.00(0.00, 600.00) | 200.00(0.00, 800.00) | 0.575 |
| BMI,Median(Q1,Q3) | 23.74(21.69,25.82) | 23.64(21.64, 25.74) | 24.21(22.27, 26.03) | 0.235 |
| Actual FEV1 Value,Median(Q1,Q3) | 2.78(2.43,3.08) | 2.78(2.45, 3.08) | 2.76(2.39, 3.06) | 0.660 |
| MVV,Median(Q1,Q3) | 99.36(80.81,121.48) | 99.99(81.38, 121.83) | 93.79(78.96, 113.99) | 0.190 |
| MVV Predicted Value,Median(Q1,Q3) | 99.67(83.88,112.62) | 99.75(83.90, 112.60) | 97.05(82.61, 113.65) | 0.884 |
| Neutrophils,Median(Q1,Q3) | 3.65(2.92,4.69) | 3.62(2.89, 4.64) | 3.93(3.27, 5.12) | 0.023 |
| Lymphocyte,Median(Q1,Q3) | 1.65(1.29,2.05) | 1.66(1.29, 2.06) | 1.58(1.29, 1.89) | 0.144 |
| Eosinophils,Median(Q1,Q3) | 0.10(0.05,0.17) | 0.10(0.05, 0.17) | 0.10(0.06, 0.16) | 0.882 |
| Basophil,Median(Q1,Q3) | 0.03(0.02,0.04) | 0.03(0.02, 0.04) | 0.03(0.02, 0.05) | 0.160 |
| Monocyte,Median(Q1,Q3) | 0.48(0.39,0.60) | 0.47(0.38, 0.60) | 0.52(0.40, 0.62) | 0.117 |
| PNI,Median(Q1,Q3) | 51.35(48.05,54.73) | 51.50(48.23, 54.90) | 50.10(47.40, 53.25) | 0.045 |
| NLR,Median(Q1,Q3) | 2.15(1.61,3.02) | 2.12(1.60, 2.98) | 2.47(1.66, 3.40) | 0.030 |
| LMR,Median(Q1,Q3) | 3.52(2.73,4.56) | 3.61(2.74, 4.60) | 3.16(2.55, 4.23) | 0.021 |
| PLR,Median(Q1,Q3) | 144.28(114.24,185.32) | 143.50(113.38, 183.57) | 156.03(117.73, 203.12) | 0.185 |
| dNLR,Median(Q1,Q3) | 1.58(1.23,2.06) | 1.55(1.23, 2.03) | 1.76(1.26, 2.21) | 0.049 |
| NLPR,Median(Q1,Q3) | 0.01(0.01,0.01) | 0.01(0.01, 0.01) | 0.01(0.01, 0.01) | 0.053 |
| SIRI,Median(Q1,Q3) | 1.01(0.70,1.56) | 1.01(0.67, 1.54) | 1.19(0.80, 1.93) | 0.019 |
| AISI,Median(Q1,Q3) | 243.12(149.39,407.73) | 239.54(146.47, 400.26) | 282.56(181.54, 534.88) | 0.054 |
| SII,Median(Q1,Q3) | 521.46(360.85,774.96) | 517.59(358.30, 754.25) | 559.87(394.65, 885.54) | 0.090 |
| PIV,Median(Q1,Q3) | 243.12(149.39,407.73) | 239.54(146.47, 400.26) | 282.56(181.54, 534.88) | 0.054 |
| Albumin-Globulin Ratio,Median(Q1,Q3) | 1.73(1.54,1.92) | 1.74(1.54, 1.93) | 1.67(1.48, 1.87) | 0.046 |
| Complemen C1q,Median(Q1,Q3) | 174.90(152.60,197.25) | 174.95(152.55, 197.30) | 172.90(152.90, 195.60) | 0.764 |
| LDH,Median(Q1,Q3) | 188.00(167.00,214.00) | 188.00(167.00, 214.00) | 184.00(170.00, 218.00) | 0.780 |
| 5’-NT,Median(Q1,Q3) | 3.00(3.00,4.00) | 3.00(3.00, 4.00) | 3.00(3.00, 4.00) | 0.804 |
| Total Protein,Median(Q1,Q3) | 68.10(64.75,71.20) | 68.10(64.80, 71.32) | 67.90(64.60, 70.70) | 0.398 |
| Albumin,Median(Q1,Q3) | 43.10(40.50,45.35) | 43.20(40.58, 45.40) | 42.40(40.30, 44.20) | 0.066 |
| Total Bilirubin,Median(Q1,Q3) | 10.00(7.70,13.70) | 10.00(7.70, 13.72) | 10.30(7.80, 12.60) | 0.963 |
| ALT,Median(Q1,Q3) | 13.00(10.00,18.00) | 13.00(10.00, 18.00) | 13.00(10.00, 18.00) | 0.431 |
| AST,Median(Q1,Q3) | 18.00(15.00,21.00) | 18.00(15.00, 21.00) | 18.00(15.00, 22.00) | 0.924 |
| Urea,Median(Q1,Q3) | 4.96(4.16,5.90) | 4.96(4.14, 5.87) | 5.00(4.17, 6.10) | 0.670 |
| Creatinine,Median(Q1,Q3) | 71.00(63.00,80.00) | 71.00(63.00, 80.00) | 73.00(63.00, 81.00) | 0.459 |
| Uric Acid,Median(Q1,Q3) | 286.00(243.00,333.00) | 285.00(242.75, 332.25) | 290.00(243.00, 340.00) | 0.416 |
| Surgery Duration,Median(Q1,Q3) | 180.00(150.00,210.00) | 180.00(150.00, 210.00) | 180.00(150.00, 235.00) | 0.203 |
| Tumor Volume,Median(Q1,Q3) | 45.00(24.00,87.00) | 46.50(24.00, 84.00) | 45.00(24.00, 96.00) | 0.920 |
| Gender, n(%) | 0.116 | |||
| Female | 131 (16.8%) | 121 (17.5%) | 10 (11.0%) | |
| Male | 650 (83.2%) | 569 (82.5%) | 81 (89.0%) | |
| Preoperative Nutritional Intervention, n(%) | 0.468 | |||
| No | 760 (97.3%) | 673 (97.5%) | 87 (95.6%) | |
| Yes | 21 (2.7%) | 17 (2.5%) | 4 (4.4%) | |
| Symptoms, n(%) | 0.836 | |||
| No | 11 (1.4%) | 9 (1.3%) | 2 (2.2%) | |
| Yes | 770 (98.6%) | 681 (98.7%) | 89 (97.8%) | |
| Hypertension, n(%) | 0.906 | |||
| No | 579 (74.1%) | 512 (74.2%) | 67 (73.6%) | |
| Yes | 202 (25.9%) | 178 (25.8%) | 24 (26.4%) | |
| Diabetes, n(%) | 0.251 | |||
| No | 693 (88.7%) | 609 (88.3%) | 84 (92.3%) | |
| Yes | 88 (11.3%) | 81 (11.7%) | 7 (7.7%) | |
| Coronary Heart Disease, n(%) | 0.130 | |||
| No | 737 (94.4%) | 648 (93.9%) | 89 (97.8%) | |
| Yes | 44 (5.6%) | 42 (6.1%) | 2 (2.2%) | |
| Surgical History, n(%) | 0.130 | |||
| No | 594 (76.1%) | 519 (75.2%) | 75 (82.4%) | |
| Yes | 187 (23.9%) | 171 (24.8%) | 16 (17.6%) | |
| Alcohol History, n(%) | 0.261 | |||
| No | 273 (35.0%) | 246 (35.7%) | 27 (29.7%) | |
| Yes | 508 (65.0%) | 444 (64.3%) | 64 (70.3%) | |
| Family History Of Cancer, n(%) | 0.749 | |||
| No | 719 (92.1%) | 636 (92.2%) | 83 (91.2%) | |
| Yes | 62 (7.9%) | 54 (7.8%) | 8 (8.8%) | |
| KPS Score, n(%) | 0.569 | |||
| ≥ 80 | 635 (81.3%) | 563 (81.6%) | 72 (79.1%) | |
| < 80 | 146 (18.7%) | 127 (18.4%) | 19 (20.9%) | |
| Preoperative Chemotderapy, n(%) | 0.905 | |||
| No | 761 (97.4%) | 673 (97.5%) | 88 (96.7%) | |
| Yes | 20 (2.6%) | 17 (2.5%) | 3 (3.3%) | |
| Surgical Procedure, n(%) | 0.436 | |||
| Endoscopic Surgery | 260 (33.3%) | 233 (33.8%) | 27 (29.7%) | |
| Open Surgery | 521 (66.7%) | 457 (66.2%) | 64 (70.3%) | |
| Surgical Approach, n(%) | 0.071 | |||
| Left Thoracic Approach | 576 (73.8%) | 516 (74.8%) | 60 (65.9%) | |
| Right Thoracic Approach | 205 (26.2%) | 174 (25.2%) | 31 (34.1%) | |
| Anastomosis Technique, n(%) | 0.311 | |||
| Mechanical Anastomosis | 778 (99.6%) | 688 (99.7%) | 90 (98.9%) | |
| Manual Anastomosis | 3 (0.4%) | 2 (0.3%) | 1 (1.1%) | |
| Anastomosis Site, n(%) | 0.241 | |||
| Intratdoracic | 628 (80.4%) | 559 (81.0%) | 69 (75.8%) | |
| Neck | 153 (19.6%) | 131 (19.0%) | 22 (24.2%) | |
| Elevation Approach, n(%) | 0.749 | |||
| Esophageal Bed | 719 (92.1%) | 636 (92.2%) | 83 (91.2%) | |
| Retrosternal | 62 (7.9%) | 54 (7.8%) | 8 (8.8%) | |
| Enteral Nutrition Route, n(%) | 0.135 | |||
| Non | 52 (6.7%) | 47 (6.8%) | 5 (5.5%) | |
| Nasojejunal tube | 680 (87.1%) | 604 (87.5%) | 76 (83.5%) | |
| Jejunostomy | 49 (6.3%) | 39 (5.7%) | 10 (11.0%) | |
| Extent Of Lymph Node Dissection, n(%) | 0.055 | |||
| Standard Two Field | 500 (64.0%) | 450 (65.2%) | 50 (54.9%) | |
| Above | 281 (36.0%) | 240 (34.8%) | 41 (45.1%) | |
| Thoracic Adhesions, n(%) | 0.309 | |||
| No | 501 (64.1%) | 447 (64.8%) | 54 (59.3%) | |
| Yes | 280 (35.9%) | 243 (35.2%) | 37 (40.7%) | |
| Pleural Effusion, n(%) | 0.175 | |||
| No | 687 (88.0%) | 603 (87.4%) | 84 (92.3%) | |
| Yes | 94 (12.0%) | 87 (12.6%) | 7 (7.7%) | |
| Ascites, n(%) | 0.409 | |||
| No | 682 (87.3%) | 605 (87.7%) | 77 (84.6%) | |
| Yes | 99 (12.7%) | 85 (12.3%) | 14 (15.4%) | |
| Pleural Metastasis, n(%) | 0.008 | |||
| No | 773 (99.0%) | 686 (99.4%) | 87 (95.6%) | |
| Yes | 8 (1.0%) | 4 (0.6%) | 4 (4.4%) | |
| Wide Excision, n(%) | 0.691 | |||
| No | 764 (97.8%) | 676 (98.0%) | 88 (96.7%) | |
| Yes | 17 (2.2%) | 14 (2.0%) | 3 (3.3%) | |
| Pain Relief Pump, n(%) | 0.026 | |||
| No | 64 (8.2%) | 62 (9.0%) | 2 (2.2%) | |
| Yes | 717 (91.8%) | 628 (91.0%) | 89 (97.8%) | |
| Transfer To ICU, n(%) | <0.001 | |||
| No | 766 (98.1%) | 684 (99.1%) | 82 (90.1%) | |
| Yes | 15 (1.9%) | 6 (0.9%) | 9 (9.9%) | |
| Anastomotic Leakage, n(%) | <0.001 | |||
| No | 764 (97.8%) | 682 (98.8%) | 82 (90.1%) | |
| Yes | 17 (2.2%) | 8 (1.2%) | 9 (9.9%) | |
| Degree of Tumor Resection, n(%) | 0.581 | |||
| R0 | 774 (99.1%) | 684 (99.1%) | 90 (98.9%) | |
| R1+R2 | 7 (0.9%) | 6 (0.9%) | 1 (1.1%) | |
| Tumor Location, n(%) | 0.241 | |||
| Upper | 45 (5.8%) | 39 (5.7%) | 6 (6.6%) | |
| Middle | 311 (39.8%) | 268 (38.8%) | 43 (47.3%) | |
| Lower | 425 (54.4%) | 383 (55.5%) | 42 (46.2%) | |
| T Stage, n(%) | 0.677 | |||
| T1-T2 | 336 (43.0%) | 295 (42.8%) | 41 (45.1%) | |
| T3-T4 | 445 (57.0%) | 395 (57.2%) | 50 (54.9%) | |
| N Stage, n(%) | 0.717 | |||
| N0 | 383 (49.0%) | 340 (49.3%) | 43 (47.3%) | |
| N+ | 398 (51.0%) | 350 (50.7%) | 48 (52.7%) | |
| M Stage, n(%) | 1.000 | |||
| M0 | 776 (99.4%) | 685 (99.3%) | 91 (100.0%) | |
| M1 | 5 (0.6%) | 5 (0.7%) | 0 (0.0%) | |
| G Stage, n(%) | 0.170 | |||
| G1-G2 | 428 (54.8%) | 372 (53.9%) | 56 (61.5%) | |
| G3-G4 | 353 (45.2%) | 318 (46.1%) | 35 (38.5%) | |
| P Stage, n(%) | 0.759 | |||
| I-II | 398 (51.0%) | 353 (51.2%) | 45 (49.5%) | |
| III-IV | 383 (49.0%) | 337 (48.8%) | 46 (50.5%) | |
| Circumferential Cut Edge, n(%) | 0.526 | |||
| >1mm | 775 (99.2%) | 685 (99.3%) | 90 (98.9%) | |
| ≤1mm | 6 (0.8%) | 5 (0.7%) | 1 (1.1%) | |
| Patdological Tissue Type, n(%) | 0.492 | |||
| Squamous cell carcinoma | 518 (66.3%) | 453 (65.7%) | 65 (71.4%) | |
| Adenocarcinoma | 212 (27.1%) | 192 (27.8%) | 20 (22.0%) | |
| Otder | 51 (6.5%) | 45 (6.5%) | 6 (6.6%) | |
| Lymphovascular Invasion, n(%) | 0.717 | |||
| No | 580 (74.3%) | 511 (74.1%) | 69 (75.8%) | |
| Yes | 201 (25.7%) | 179 (25.9%) | 22 (24.2%) | |
| Lymph Node Metastasis, n(%) | 0.604 | |||
| No | 389 (49.8%) | 346 (50.1%) | 43 (47.3%) | |
| Yes | 392 (50.2%) | 344 (49.9%) | 48 (52.7%) |
| Variables | Total (N = 781) | Test data (N = 232) | Trian data (N = 549) |
|
|---|---|---|---|---|
| Age,Median(Q1,Q3) | 63.00(57.50,69.00) | 63.00(58.00, 68.00) | 64.00(57.00, 69.50) | 0.300 |
| Smoking Index,Median(Q1,Q3) | 200.00(0.00,600.00) | 200.00(0.00, 600.00) | 200.00(0.00, 600.00) | 0.813 |
| BMI,Median(Q1,Q3) | 23.74(21.69,25.82) | 23.70(21.79, 25.70) | 23.78(21.67, 25.93) | 0.640 |
| Actual FEV1 Value,Median(Q1,Q3) | 2.78(2.43,3.08) | 2.80(2.43, 3.07) | 2.77(2.43, 3.08) | 0.738 |
| MVV,Median(Q1,Q3) | 99.36(80.81,121.48) | 99.78(82.61, 123.07) | 99.33(79.88, 120.24) | 0.375 |
| MVV Predicted Value,Median(Q1,Q3) | 99.67(83.88,112.62) | 102.41(84.00, 113.23) | 98.72(83.84, 112.18) | 0.437 |
| Neutrophils,Median(Q1,Q3) | 3.65(2.92,4.69) | 3.70(2.91, 4.68) | 3.65(2.92, 4.69) | 0.860 |
| Lymphocyte,Median(Q1,Q3) | 1.65(1.29,2.05) | 1.64(1.30, 2.02) | 1.65(1.29, 2.06) | 0.973 |
| Eosinophils,Median(Q1,Q3) | 0.10(0.05,0.17) | 0.09(0.06, 0.17) | 0.10(0.05, 0.16) | 0.832 |
| Basophil,Median(Q1,Q3) | 0.03(0.02,0.04) | 0.03(0.02, 0.05) | 0.03(0.02, 0.04) | 0.188 |
| Monocyte,Median(Q1,Q3) | 0.48(0.39,0.60) | 0.49(0.39, 0.60) | 0.47(0.38, 0.60) | 0.245 |
| PNI,Median(Q1,Q3) | 51.35(48.05,54.73) | 51.35(48.07, 54.50) | 51.30(48.02, 54.90) | 0.943 |
| NLR,Median(Q1,Q3) | 2.15(1.61,3.02) | 2.19(1.68, 2.91) | 2.13(1.60, 3.06) | 0.708 |
| LMR,Median(Q1,Q3) | 3.52(2.73,4.56) | 3.47(2.61, 4.37) | 3.56(2.77, 4.61) | 0.244 |
| PLR,Median(Q1,Q3) | 144.28(114.24,185.32) | 146.32(119.00, 180.66) | 143.50(111.14, 188.78) | 0.616 |
| dNLR,Median(Q1,Q3) | 1.58(1.23,2.06) | 1.59(1.23, 2.02) | 1.57(1.23, 2.10) | 0.828 |
| NLPR,Median(Q1,Q3) | 0.01(0.01,0.01) | 0.01(0.01, 0.01) | 0.01(0.01, 0.01) | 0.989 |
| SIRI,Median(Q1,Q3) | 1.01(0.70,1.56) | 1.03(0.75, 1.63) | 1.00(0.67, 1.55) | 0.375 |
| AISI,Median(Q1,Q3) | 243.12(149.39,407.73) | 254.49(156.92, 411.88) | 238.56(145.34, 406.91) | 0.396 |
| SII,Median(Q1,Q3) | 521.46(360.85,774.96) | 532.30(372.67, 754.71) | 514.94(354.71, 787.09) | 0.652 |
| PIV,Median(Q1,Q3) | 243.12(149.39,407.73) | 254.49(156.92, 411.88) | 238.56(145.34, 406.91) | 0.396 |
| Albumin-Globulin Ratio,Median(Q1,Q3) | 1.73(1.54,1.92) | 1.72(1.48, 1.94) | 1.74(1.56, 1.92) | 0.247 |
| Complemen C1q,Median(Q1,Q3) | 174.90(152.60,197.25) | 172.65(151.62, 199.65) | 175.10(152.75, 196.60) | 0.908 |
| LDH,Median(Q1,Q3) | 188.00(167.00,214.00) | 183.00(165.25, 210.00) | 190.00(168.00, 215.00) | 0.064 |
| 5’-NT,Median(Q1,Q3) | 3.00(3.00,4.00) | 4.00(3.00, 4.00) | 3.00(3.00, 4.00) | 0.474 |
| Total Protein,Median(Q1,Q3) | 68.10(64.75,71.20) | 68.60(65.00, 71.50) | 67.90(64.60, 71.05) | 0.213 |
| Albumin,Median(Q1,Q3) | 43.10(40.50,45.35) | 43.10(40.23, 45.68) | 43.10(40.60, 45.30) | 0.919 |
| Total Bilirubin,Median(Q1,Q3) | 10.00(7.70,13.70) | 9.70(7.70, 13.57) | 10.20(7.80, 13.70) | 0.539 |
| ALT,Median(Q1,Q3) | 13.00(10.00,18.00) | 13.00(9.00, 16.00) | 13.00(10.00, 18.00) | 0.105 |
| AST,Median(Q1,Q3) | 18.00(15.00,21.00) | 17.00(15.00, 21.00) | 18.00(15.00, 22.00) | 0.171 |
| Urea,Median(Q1,Q3) | 4.96(4.16,5.90) | 4.90(4.12, 5.94) | 4.99(4.16, 5.87) | 0.872 |
| Creatinine,Median(Q1,Q3) | 71.00(63.00,80.00) | 72.00(63.00, 79.75) | 71.00(63.00, 81.00) | 0.884 |
| Uric Acid,Median(Q1,Q3) | 286.00(243.00,333.00) | 290.50(247.25, 332.00) | 285.00(241.00, 333.50) | 0.950 |
| Surgery Duration,Median(Q1,Q3) | 180.00(150.00,210.00) | 180.00(150.00, 210.00) | 180.00(150.00, 210.00) | 0.445 |
| Tumor Volume,Median(Q1,Q3) | 45.00(24.00,87.00) | 54.00(24.00, 96.00) | 45.00(18.00, 84.00) | 0.097 |
| PPCs, n(%) | 0.813 | |||
| No | 690 (88.3%) | 204 (87.9%) | 486 (88.5%) | |
| Yes | 91 (11.7%) | 28 (12.1%) | 63 (11.5%) | |
| Gender, n(%) | 0.848 | |||
| Female | 131 (16.8%) | 38 (16.4%) | 93 (16.9%) | |
| Male | 650 (83.2%) | 194 (83.6%) | 456 (83.1%) | |
| Preoperative Nutritional Intervention, n(%) | 0.279 | |||
| No | 760 (97.3%) | 228 (98.3%) | 532 (96.9%) | |
| Yes | 21 (2.7%) | 4 (1.7%) | 17 (3.1%) | |
| Symptoms, n(%) | 0.610 | |||
| No | 11 (1.4%) | 2 (0.9%) | 9 (1.6%) | |
| Yes | 770 (98.6%) | 230 (99.1%) | 540 (98.4%) | |
| Hypertension, n(%) | 0.859 | |||
| No | 579 (74.1%) | 171 (73.7%) | 408 (74.3%) | |
| Yes | 202 (25.9%) | 61 (26.3%) | 141 (25.7%) | |
| Diabetes, n(%) | 0.596 | |||
| No | 693 (88.7%) | 208 (89.7%) | 485 (88.3%) | |
| Yes | 88 (11.3%) | 24 (10.3%) | 64 (11.7%) | |
| Coronary Heart Disease, n(%) | 0.297 | |||
| No | 737 (94.4%) | 222 (95.7%) | 515 (93.8%) | |
| Yes | 44 (5.6%) | 10 (4.3%) | 34 (6.2%) | |
| Surgical History, n(%) | 0.653 | |||
| No | 594 (76.1%) | 174 (75.0%) | 420 (76.5%) | |
| Yes | 187 (23.9%) | 58 (25.0%) | 129 (23.5%) | |
| Alcohol History, n(%) | 0.731 | |||
| No | 273 (35.0%) | 79 (34.1%) | 194 (35.3%) | |
| Yes | 508 (65.0%) | 153 (65.9%) | 355 (64.7%) | |
| Family History Of Cancer, n(%) | 0.106 | |||
| No | 719 (92.1%) | 208 (89.7%) | 511 (93.1%) | |
| Yes | 62 (7.9%) | 24 (10.3%) | 38 (6.9%) | |
| KPS Score, n(%) | 0.899 | |||
| ≥ 80 | 635 (81.3%) | 188 (81.0%) | 447 (81.4%) | |
| < 80 | 146 (18.7%) | 44 (19.0%) | 102 (18.6%) | |
| Preoperative Chemotderapy, n(%) | 0.600 | |||
| No | 761 (97.4%) | 225 (97.0%) | 536 (97.6%) | |
| Yes | 20 (2.6%) | 7 (3.0%) | 13 (2.4%) | |
| Surgical Procedure, n(%) | 0.646 | |||
| Endoscopic Surgery | 260 (33.3%) | 80 (34.5%) | 180 (32.8%) | |
| Open Surgery | 521 (66.7%) | 152 (65.5%) | 369 (67.2%) | |
| Surgical Approach, n(%) | 0.985 | |||
| Left Thoracic Approach | 576 (73.8%) | 171 (73.7%) | 405 (73.8%) | |
| Right Thoracic Approach | 205 (26.2%) | 61 (26.3%) | 144 (26.2%) | |
| Anastomosis Technique, n(%) | 1.000 | |||
| Mechanical Anastomosis | 778 (99.6%) | 231 (99.6%) | 547 (99.6%) | |
| Manual Anastomosis | 3 (0.4%) | 1 (0.4%) | 2 (0.4%) | |
| Anastomosis Site, n(%) | 0.760 | |||
| Intratdoracic | 628 (80.4%) | 185 (79.7%) | 443 (80.7%) | |
| Neck | 153 (19.6%) | 47 (20.3%) | 106 (19.3%) | |
| Elevation Approach, n(%) | 0.117 | |||
| Esophageal Bed | 719 (92.1%) | 219 (94.4%) | 500 (91.1%) | |
| Retrosternal | 62 (7.9%) | 13 (5.6%) | 49 (8.9%) | |
| Enteral Nutrition Route, n(%) | 0.707 | |||
| Non | 52 (6.7%) | 16 (6.9%) | 36 (6.6%) | |
| Nasojejunal tube | 680 (87.1%) | 204 (87.9%) | 476 (86.7%) | |
| Jejunostomy | 49 (6.3%) | 12 (5.2%) | 37 (6.7%) | |
| Extent Of Lymph Node Dissection, n(%) | 0.931 | |||
| Standard Two Field | 500 (64.0%) | 148 (63.8%) | 352 (64.1%) | |
| Above | 281 (36.0%) | 84 (36.2%) | 197 (35.9%) | |
| Thoracic Adhesions, n(%) | 0.977 | |||
| No | 501 (64.1%) | 149 (64.2%) | 352 (64.1%) | |
| Yes | 280 (35.9%) | 83 (35.8%) | 197 (35.9%) | |
| Pleural Effusion, n(%) | 0.617 | |||
| No | 687 (88.0%) | 202 (87.1%) | 485 (88.3%) | |
| Yes | 94 (12.0%) | 30 (12.9%) | 64 (11.7%) | |
| Ascites, n(%) | 0.740 | |||
| No | 682 (87.3%) | 204 (87.9%) | 478 (87.1%) | |
| Yes | 99 (12.7%) | 28 (12.1%) | 71 (12.9%) | |
| Pleural Metastasis, n(%) | 1.000 | |||
| No | 773 (99.0%) | 230 (99.1%) | 543 (98.9%) | |
| Yes | 8 (1.0%) | 2 (0.9%) | 6 (1.1%) | |
| Wide Excision, n(%) | 0.979 | |||
| No | 764 (97.8%) | 227 (97.8%) | 537 (97.8%) | |
| Yes | 17 (2.2%) | 5 (2.2%) | 12 (2.2%) | |
| Pain Relief Pump, n(%) | 0.390 | |||
| No | 64 (8.2%) | 16 (6.9%) | 48 (8.7%) | |
| Yes | 717 (91.8%) | 216 (93.1%) | 501 (91.3%) | |
| Transfer To ICU, n(%) | 1.000 | |||
| No | 766 (98.1%) | 228 (98.3%) | 538 (98.0%) | |
| Yes | 15 (1.9%) | 4 (1.7%) | 11 (2.0%) | |
| Anastomotic Leakage, n(%) | 0.979 | |||
| No | 764 (97.8%) | 227 (97.8%) | 537 (97.8%) | |
| Yes | 17 (2.2%) | 5 (2.2%) | 12 (2.2%) | |
| Degree of Tumor Resection, n(%) | 1.000 | |||
| R0 | 774 (99.1%) | 230 (99.1%) | 544 (99.1%) | |
| R1+R2 | 7 (0.9%) | 2 (0.9%) | 5 (0.9%) | |
| Tumor Location, n(%) | 0.071 | |||
| Upper | 45 (5.8%) | 20 (8.6%) | 25 (4.6%) | |
| Middle | 311 (39.8%) | 93 (40.1%) | 218 (39.7%) | |
| Lower | 425 (54.4%) | 119 (51.3%) | 306 (55.7%) | |
| T Stage, n(%) | 0.976 | |||
| T1-T2 | 336 (43.0%) | 100 (43.1%) | 236 (43.0%) | |
| T3-T4 | 445 (57.0%) | 132 (56.9%) | 313 (57.0%) | |
| N Stage, n(%) | 0.904 | |||
| N0 | 383 (49.0%) | 113 (48.7%) | 270 (49.2%) | |
| N+ | 398 (51.0%) | 119 (51.3%) | 279 (50.8%) | |
| M Stage, n(%) | 0.988 | |||
| M0 | 776 (99.4%) | 230 (99.1%) | 546 (99.5%) | |
| M1 | 5 (0.6%) | 2 (0.9%) | 3 (0.5%) | |
| G Stage, n(%) | 0.334 | |||
| G1-G2 | 428 (54.8%) | 121 (52.2%) | 307 (55.9%) | |
| G3-G4 | 353 (45.2%) | 111 (47.8%) | 242 (44.1%) | |
| P Stage, n(%) | 0.664 | |||
| I-II | 398 (51.0%) | 121 (52.2%) | 277 (50.5%) | |
| III-IV | 383 (49.0%) | 111 (47.8%) | 272 (49.5%) | |
| Circumferential Cut Edge, n(%) | 1.000 | |||
| >1mm | 775 (99.2%) | 230 (99.1%) | 545 (99.3%) | |
| ≤1mm | 6 (0.8%) | 2 (0.9%) | 4 (0.7%) | |
| Patdological Tissue Type, n(%) | 0.815 | |||
| Squamous cell carcinoma | 518 (66.3%) | 154 (66.4%) | 364 (66.3%) | |
| Adenocarcinoma | 212 (27.1%) | 61 (26.3%) | 151 (27.5%) | |
| Otder | 51 (6.5%) | 17 (7.3%) | 34 (6.2%) | |
| Lymphovascular Invasion, n(%) | 0.817 | |||
| No | 580 (74.3%) | 171 (73.7%) | 409 (74.5%) | |
| Yes | 201 (25.7%) | 61 (26.3%) | 140 (25.5%) | |
| Lymph Node Metastasis, n(%) | 0.944 | |||
| No | 389 (49.8%) | 116 (50.0%) | 273 (49.7%) | |
| Yes | 392 (50.2%) | 116 (50.0%) | 276 (50.3%) |
| Variables | Partial regression coefficient | Standard error |
| OR(95%CI) |
|
|---|---|---|---|---|---|
| Gender, n(%) | |||||
| Female | Reference | ||||
| Male | 0.377 | 0.397 | 0.949 | 1.457(0.670~3.172) | 0.343 |
| Age,Median(Q1,Q3) | 0.019 | 0.017 | 1.146 | 1.019(0.987~1.053) | 0.252 |
| Preoperative Nutritional Intervention, n(%) | |||||
| No | Reference | ||||
| Yes | 0.522 | 0.651 | 0.802 | 1.686(0.471~6.036) | 0.422 |
| Symptoms, n(%) | |||||
| No | Reference | ||||
| Yes | 0.037 | 1.069 | 0.035 | 1.038(0.128~8.437) | 0.972 |
| Hypertension, n(%) | |||||
| No | Reference | ||||
| Yes | -0.113 | 0.313 | 0.362 | 0.893(0.483~1.650) | 0.718 |
| Diabetes, n(%) | |||||
| No | Reference | ||||
| Yes | -0.731 | 0.535 | 1.367 | 0.481(0.169~1.373) | 0.172 |
| Coronary Heart Disease, n(%) | |||||
| No | Reference | ||||
| Yes | -0.765 | 0.742 | 1.032 | 0.465(0.109~1.990) | 0.302 |
| Surgical History, n(%) | |||||
| No | Reference | ||||
| Yes | -0.677 | 0.375 | 1.804 | 0.508(0.244~1.060) | 0.071 |
| Smoking Index,Median(Q1,Q3) | 0.000 | 0.000 | 0.332 | 1.000(1.000~1.000) | 0.740 |
| Alcohol History, n(%) | |||||
| No | Reference | ||||
| Yes | 0.438 | 0.299 | 1.465 | 1.550(0.862~2.786) | 0.143 |
| Family History Of Cancer, n(%) | |||||
| No | Reference | ||||
| Yes | 0.168 | 0.500 | 0.337 | 1.183(0.444~3.152) | 0.736 |
| BMI,Median(Q1,Q3) | 0.025 | 0.041 | 0.612 | 1.026(0.946~1.112) | 0.541 |
| Actual FEV1 Value,Median(Q1,Q3) | -0.103 | 0.249 | 0.413 | 0.902(0.553~1.471) | 0.680 |
| MVV,Median(Q1,Q3) | -0.006 | 0.005 | 1.230 | 0.994(0.985~1.003) | 0.219 |
| MVV Predicted Value,Median(Q1,Q3) | -0.002 | 0.006 | 0.271 | 0.998(0.986~1.010) | 0.786 |
| Neutrophils,Median(Q1,Q3) | 0.098 | 0.049 | 2.010 | 1.103(1.002~1.213) | 0.044 |
| Lymphocyte,Median(Q1,Q3) | -0.308 | 0.236 | 1.306 | 0.735(0.463~1.167) | 0.192 |
| Eosinophils,Median(Q1,Q3) | 1.805 | 0.786 | 2.296 | 6.083(1.302~28.414) | 0.022 |
| Basophil,Median(Q1,Q3) | 6.713 | 4.135 | 1.623 | 823.422(0.249~2727029.954) | 0.104 |
| Monocyte,Median(Q1,Q3) | 1.443 | 0.626 | 2.303 | 4.232(1.240~14.449) | 0.021 |
| PNI,Median(Q1,Q3) | -0.041 | 0.026 | 1.535 | 0.960(0.912~1.011) | 0.125 |
| NLR,Median(Q1,Q3) | 0.043 | 0.025 | 1.730 | 1.044(0.994~1.096) | 0.084 |
| LMR,Median(Q1,Q3) | -0.264 | 0.098 | 2.697 | 0.768(0.634~0.930) | 0.007 |
| PLR,Median(Q1,Q3) | 0.003 | 0.001 | 2.443 | 1.003(1.001~1.006) | 0.015 |
| dNLR,Median(Q1,Q3) | 0.121 | 0.058 | 2.103 | 1.129(1.008~1.264) | 0.035 |
| NLPR,Median(Q1,Q3) | 5.290 | 5.023 | 1.053 | 198.413(0.011~3739909.297) | 0.292 |
| SIRI,Median(Q1,Q3) | 0.034 | 0.030 | 1.141 | 1.035(0.976~1.097) | 0.254 |
| AISI,Median(Q1,Q3) | 0.000 | 0.000 | 1.284 | 1.000(1.000~1.000) | 0.199 |
| SII,Median(Q1,Q3) | 0.000 | 0.000 | 2.104 | 1.000(1.000~1.000) | 0.035 |
| PIV,Median(Q1,Q3) | 0.000 | 0.000 | 1.284 | 1.000(1.000~1.000) | 0.199 |
| Albumin-Globulin Ratio,Median(Q1,Q3) | -0.265 | 0.421 | 0.628 | 0.767(0.336~1.752) | 0.530 |
| Complemen C1q,Median(Q1,Q3) | -0.001 | 0.004 | 0.344 | 0.999(0.991~1.006) | 0.731 |
| LDH,Median(Q1,Q3) | 0.001 | 0.003 | 0.250 | 1.001(0.994~1.007) | 0.803 |
| 5’-NT,Median(Q1,Q3) | 0.002 | 0.080 | 0.028 | 1.002(0.857~1.173) | 0.978 |
| Total Protein,Median(Q1,Q3) | 0.001 | 0.023 | 0.023 | 1.001(0.957~1.046) | 0.981 |
| Albumin,Median(Q1,Q3) | -0.036 | 0.035 | 1.027 | 0.964(0.899~1.034) | 0.304 |
| Total Bilirubin,Median(Q1,Q3) | -0.000 | 0.026 | 0.010 | 1.000(0.949~1.053) | 0.992 |
| ALT,Median(Q1,Q3) | 0.006 | 0.006 | 0.964 | 1.006(0.994~1.018) | 0.335 |
| AST,Median(Q1,Q3) | 0.005 | 0.004 | 1.079 | 1.005(0.996~1.013) | 0.281 |
| Urea,Median(Q1,Q3) | 0.024 | 0.087 | 0.274 | 1.024(0.863~1.215) | 0.784 |
| Creatinine,Median(Q1,Q3) | -0.003 | 0.009 | 0.314 | 0.997(0.979~1.015) | 0.754 |
| Uric Acid,Median(Q1,Q3) | 0.001 | 0.002 | 0.689 | 1.001(0.998~1.005) | 0.491 |
| KPS Score, n(%) | |||||
| ≥ 80 | Reference | ||||
| < 80 | 0.148 | 0.333 | 0.446 | 1.160(0.604~2.226) | 0.656 |
| Preoperative Chemotherapy, n(%) | |||||
| No | Reference | ||||
| Yes | 0.348 | 0.781 | 0.445 | 1.416(0.307~6.539) | 0.656 |
| Surgery Duration,Median(Q1,Q3) | 0.002 | 0.003 | 0.903 | 1.002(0.997~1.008) | 0.366 |
| Surgical Procedure, n(%) | |||||
| Endoscopic Surgery | Reference | ||||
| Open Surgery | 0.223 | 0.295 | 0.756 | 1.250(0.701~2.229) | 0.449 |
| Surgical Approach, n(%) | |||||
| Left Thoracic Approach | Reference | ||||
| Right Thoracic Approach | 0.551 | 0.282 | 1.953 | 1.735(0.998~3.014) | 0.051 |
| Anastomosis Technique, n(%) | |||||
| Mechanical Anastomosis | Reference | ||||
| Manual Anastomosis | -12.527 | 624.194 | 0.020 | 0.000(0.000~Inf) | 0.984 |
| Anastomosis Site, n(%) | |||||
| Intrathoracic | Reference | ||||
| Neck | 0.202 | 0.324 | 0.622 | 1.224(0.648~2.311) | 0.534 |
| Elevation Approach, n(%) | |||||
| Esophageal Bed | Reference | ||||
| Retrosternal | 0.279 | 0.432 | 0.645 | 1.321(0.566~3.083) | 0.519 |
| Enteral Nutrition Route, n(%) | |||||
| Non | Reference | ||||
| Nasojejunal tube | 0.342 | 0.620 | 0.552 | 1.408(0.418~4.744) | 0.581 |
| Jejunostomy | 0.756 | 0.750 | 1.008 | 2.129(0.490~9.257) | 0.314 |
| Tumor Volume,Median(Q1,Q3) | -0.000 | 0.001 | 0.268 | 1.000(0.998~1.002) | 0.789 |
| Extent Of Lymph Node Dissection, n(%) | |||||
| Standard Two Field | Reference | ||||
| Above | 0.552 | 0.270 | 2.046 | 1.737(1.023~2.946) | 0.041 |
| Thoracic Adhesions, n(%) | |||||
| No | Reference | ||||
| Yes | 0.031 | 0.278 | 0.110 | 1.031(0.598~1.779) | 0.913 |
| Pleural Effusion, n(%) | |||||
| No | Reference | ||||
| Yes | -1.055 | 0.607 | 1.737 | 0.348(0.106~1.145) | 0.082 |
| Ascites, n(%) | |||||
| No | Reference | ||||
| Yes | -0.024 | 0.402 | 0.059 | 0.977(0.444~2.146) | 0.953 |
| Pleural Metastasis, n(%) | |||||
| No | Reference | ||||
| Yes | 2.086 | 0.828 | 2.519 | 8.050(1.589~40.786) | 0.012 |
| Wide Excision, n(%) | |||||
| No | Reference | ||||
| Yes | 0.445 | 0.786 | 0.566 | 1.561(0.334~7.290) | 0.571 |
| Pain Relief Pump, n(%) | |||||
| No | Reference | ||||
| Yes | 1.893 | 1.020 | 1.856 | 6.638(0.900~48.970) | 0.063 |
| Transfer To ICU, n(%) | |||||
| No | Reference | ||||
| Yes | 2.315 | 0.622 | 3.725 | 10.126(2.995~34.237) | 0.000 |
| Anastomotic Leakage, n(%) | |||||
| No | Reference | ||||
| Yes | 2.864 | 0.629 | 4.555 | 17.527(5.112~60.099) | 0.000 |
| Degree of Tumor Resection, n(%) | |||||
| R0 | Reference | ||||
| R1+R2 | 0.665 | 1.126 | 0.590 | 1.944(0.214~17.668) | 0.555 |
| Tumor Location, n(%) | |||||
| Upper | Reference | ||||
| Middle | 0.118 | 0.647 | 0.182 | 1.125(0.317~3.999) | 0.855 |
| Lower | -0.190 | 0.644 | 0.296 | 0.827(0.234~2.921) | 0.768 |
| T Stage, n(%) | |||||
| T1-T2 | Reference | ||||
| T3-T4 | -0.067 | 0.270 | 0.248 | 0.935(0.551~1.586) | 0.804 |
| N Stage, n(%) | |||||
| N0 | Reference | ||||
| N+ | 0.215 | 0.269 | 0.798 | 1.240(0.731~2.102) | 0.425 |
| M Stage, n(%) | |||||
| M0 | Reference | ||||
| M1 | -13.529 | 840.274 | 0.016 | 0.000(0.000~Inf) | 0.987 |
| G Stage, n(%) | |||||
| G1-G2 | Reference | ||||
| G3-G4 | -0.433 | 0.280 | 1.548 | 0.649(0.375~1.122) | 0.122 |
| P Stage, n(%) | |||||
| I-II | Reference | ||||
| III-IV | 0.200 | 0.269 | 0.746 | 1.222(0.722~2.068) | 0.456 |
| Circumferential Cut Edge, n(%) | |||||
| >1mm | Reference | ||||
| ≤1mm | 0.954 | 1.163 | 0.821 | 2.597(0.266~25.352) | 0.412 |
| Pathological Tissue Type, n(%) | |||||
| Squamous cell carcinoma | Reference | ||||
| Adenocarcinoma | -0.246 | 0.315 | 0.781 | 0.782(0.422~1.450) | 0.435 |
| Other | -0.377 | 0.625 | 0.603 | 0.686(0.201~2.336) | 0.547 |
| Lymphovascular Invasion, n(%) | |||||
| No | Reference | ||||
| Yes | -0.006 | 0.308 | 0.020 | 0.994(0.544~1.816) | 0.984 |
| Lymph Node Metastasis, n(%) | |||||
| No | Reference | ||||
| Yes | 0.240 | 0.269 | 0.890 | 1.271(0.750~2.154) | 0.374 |
| Variables | Partial regression coefficient | Standard error |
| OR(95%CI) |
|
|---|---|---|---|---|---|
| (Intercept) | -1.658 | 0.403 | 4.116 | 0.191(0.087~0.420) | 0.000 |
| Eosinophils,Median(Q1,Q3) | 1.779 | 0.803 | 2.216 | 5.924(1.229~28.562) | 0.027 |
| LMR,Median(Q1,Q3) | -0.247 | 0.107 | 2.310 | 0.781(0.634~0.963) | 0.021 |
| Pleural Metastasis, n(%) | |||||
| No | Reference | ||||
| Yes | 1.925 | 0.867 | 2.220 | 6.853(1.253~37.490) | 0.026 |
| Transfer To ICU, n(%) | |||||
| No | Reference | ||||
| Yes | 1.941 | 0.701 | 2.769 | 6.963(1.763~27.508) | 0.006 |
| Anastomotic Leakage, n(%) | |||||
| No | Reference | ||||
| Yes | 2.599 | 0.667 | 3.899 | 13.454(3.643~49.693) | 0.000 |
| Variable | VIF |
|---|---|
| Transferred To The ICU After Surgery | 1.006624 |
| Eosinophils | 1.007819 |
| LMR | 1.005374 |
| Pleural Metastasis | 1.010970 |
| Anastomotic Leakage | 1.005670 |
| Characteristics | Training set | Validation set |
|---|---|---|
| Threshold | 0.185 | 0.185 |
| Specificity | 0.967 | 0.956 |
| Sensitivity | 0.317 | 0.179 |
| Accuracy | 0.893 | 0.862 |
| TN | 470.000 | 195.000 |
| TP | 20.000 | 5.000 |
| FN | 43.000 | 23.000 |
| FP | 16.000 | 9.000 |
| NPV | 0.916 | 0.894 |
| PPV | 0.556 | 0.357 |
| FDR | 0.444 | 0.643 |
| FPR | 0.033 | 0.044 |
| TPR | 0.317 | 0.179 |
| TNR | 0.967 | 0.956 |
| FNR | 0.683 | 0.821 |
| 1-Specificity | 0.033 | 0.044 |
| 1-Sensitivity | 0.683 | 0.821 |
| 1-Accuracy | 0.107 | 0.138 |
| 1-NPV | 0.084 | 0.106 |
| 1-PPV | 0.444 | 0.643 |
| Precision | 0.556 | 0.357 |
| Recall | 0.317 | 0.179 |
| Youden | 0.285 | 0.134 |
| Closest.topleft | 0.467 | 0.677 |
| AUC | 0.665(0.585-0.745) | 0.561(0.446-0.676) |
| z | 4.041 | 1.043 |
| p | <0.001 | 0.297 |
- —Key Technologies Research and Development Program10.13039/501100012165
Peer Reviews
No public reviews on file for this paper yet. If you reviewed it on a platform where reviews are public (OpenReview, ICLR, NeurIPS, ICML), you can paste yours below so the community can read it here.
Videos
No videos yet. Explain this paper in a talk, walkthrough, or lecture? Add one.
Taxonomy
TopicsEsophageal Cancer Research and Treatment · Inflammatory Biomarkers in Disease Prognosis · Immune cells in cancer
Introduction
1
Esophageal cancer (EC) is one of the most aggressive malignant tumors in the world, and its consistently high incidence and death rates present a serious threat to public health across the world (1–4). For patients with resectable EC, a complete treatment plan focusing on radical EC resection remains the most successful therapeutic method (5, 6). However, postoperative problems are common due to the complexity of esophageal surgery (7–11). One of the most prevalent and serious categories of complications among these are postoperative pulmonary complications (PPCs), which include respiratory failure, pneumonia, and acute respiratory distress syndrome. They now have a significant impact on patients’ long-term prognosis and ability to recover (12–18).
Optimizing perioperative care requires identifying patients who are at high risk for PPCs. Several research have tried to develop accurate PPCs predictions (15, 19–23). Traditional predictive models primarily rely on clinical and pathological characteristics, encompassing a wide range of information. This includes preoperative patient data such as age, gender, body mass index (BMI), smoking history, preoperative pulmonary disease, FEV1/FVC ratio, diffusing capacity of the lung for carbon monoxide, white blood cell count, anemia, albumin levels, and history of neoadjuvant therapy. Intraoperative Information: Intraoperative bleeding, type of anesthesia, duration of surgery, surgical technique, pleural adhesions. Postoperative Information: Squamous cell carcinoma, anastomotic leakage and recurrent laryngeal nerve palsy, length of hospital stay, perioperative blood transfusion, T stage, etc. Despite being intimately linked to the incidence of PPCs in clinical practice, key postoperative events (like anastomotic leaks) are rarely consistently included in risk factor studies. This is especially true for the systemic inflammatory response, which is a major factor in postoperative outcomes and a hallmark of malignancy. Finding biomarkers that more accurately capture this pathophysiological milieu and its connection to PPCs is crucial.
Since inflammation is essential to the development and spread of cancer, it is commonly acknowledged as one of its defining characteristics (24–27). In light of this, routine blood test-based systemic inflammatory response indicators have become a class of biomarkers with high clinical usefulness because of their accessibility and affordability (28). For instance, it is widely known that composite indicators like the neutrophil-lymphocyte ratio (NLR), platelet-lymphocyte ratio (PLR), and lymphocyte-monocyte ratio (LMR) are accurate predictors of the host’s systemic inflammatory state (29–31). These ratios provide a strong prognostic ability for EC patients’ long-term survival results (32, 33). However, there is still a substantial research gap: few studies have specifically and methodically investigated the relationship between these easily accessible inflammatory markers and PPCs following EC surgery, nor have they combined preoperative inflammatory indicators with intraoperative and postoperative factors to fully identify independent risk factors for PPCs.
Preoperative inflammatory biomarkers, intraoperative variables, and postoperative key events/indicators are all part of the study’s objective to methodically identify the independent risk factors for postoperative pulmonary problems in EC patients. This study intends to close the current research gap and offer a thorough theoretical foundation for clinical risk stratification and focused preventive interventions by employing rigorous statistical techniques to elucidate the independent associations and possible interactions between these factors and PPCs.
Methods
2
Study participants
2.1
This research is a retrospective observational study conducted at a single center. Between January 2022 and December 2024, we included 781 patients who had radical resection for EC at Shandong University’s Esophageal Group in the Department of Thoracic Surgery at Qilu Hospital.
The following standards were used to determine which patients were included:
Criteria for Inclusion: (1) Primary EC at postoperative assessment with pathological confirmation; (2) Elective esophageal resection with the goal of curing the disease.
Exclusion criteria include: (1) preoperative distant metastases; (2) emergency surgery; (3) a severe or active pulmonary infection before surgery; (4) a significant clinical documentation gap; and (5) numerous primary malignancies that are concurrent or metachronous.
The Ethics Review Committee of Qilu Hospital, which is affiliated with Shandong University, gave its approval to this research protocol. The Declaration of Helsinki’s ethical guidelines are closely followed in this investigation. The Qilu Ethics Committees approved the investigation (registration number: KYLL-202008-023-1). The Ethics Committee approved an exemption from seeking patients’ individual informed permission due to the study’s retrospective nature. Figure 1 depicts the comprehensive patient selection procedure.
Patient selection flowchart for this study. PPCs, postoperative pulmonary complications.
Perioperative management protocol
2.2
Upon admission, all patients go through a thorough preoperative evaluation that includes imaging studies, cardiopulmonary function testing, and a thorough physical examination to rule out distant metastases and finally validate surgical indications. The hospital’s multidisciplinary team must jointly assess all cases that match surgical criteria in order to identify the best course of therapy. Individualized treatment plans will be created by oncology specialists for patients who need neoadjuvant therapy. These could consist of combination immunotherapy, chemoradiation, or chemotherapy.
Double-lumen endotracheal intubation was used for the procedure, which was conducted under general anesthesia. During preoperative planning, the surgical team decides the precise surgical approach depending on the patient’s unique situation and the location of the tumor. Surgical techniques include open and minimally invasive procedures, and access points include incisions in the left or right thorax. Standard two-field dissection, extended two-field dissection, and even three-field dissection are all possible for lymph nodes. The stomach is the preferred esophageal replacement organ during surgery, with the colon or jejunum coming in second or third. The esophageal bed or retrosternal approaches might be used to raise the organ. The neck or the thoracic cavity contain the anastomosis site. Either manual suturing or mechanical stapling are used to perform anastomosis. During surgery, a jejunostomy is performed if the placement of a nasojejunal feeding tube is not effective.
All patients were moved to the surgical critical care unit for one to three days of rigorous monitoring after surgery. On the first postoperative day, enteral nutrition and parenteral support were started, along with physical interventions such back and rotating percussion to encourage the removal of sputum. Patients were returned to the general ward once vital signs had stabilized. Oral feeding is usually started on the seventh postoperative day if anastomotic leaking from the upper gastrointestinal tract has been ruled out. Patients usually heal and are released 10–14 days after surgery if there are no problems such chylothorax, anastomotic leaking, or incisional infection. Patients diagnosed with intraoperative pleural metastasis undergo extended pleurectomy according to institutional guidelines, followed by adjuvant therapy (chemotherapy or immunotherapy), and are closely monitored during follow-up.
Data collection
2.3
Through a retrospective analysis of the electronic medical record system, the following four categories of perioperative variables were methodically gathered for this study:
General clinical characteristics
2.3.1
Demographic data, baseline conditions, and comorbidities were collected for patients, including: age, gender, body mass index (BMI), smoking index, and alcohol consumption history; Comorbidities included hypertension, coronary heart disease, diabetes, and family history of cancer; Preoperative treatment history, including surgical history and prior chemotherapy; Functional status assessed using the Karnofsky Performance Status (KPS) score; Maximum voluntary ventilation (MVV), projected MVV, and measured forced expiratory volume in one second (FEV1) are used to assess respiratory function; Records of the patients’ principal clinical symptoms and whether they received preoperative nutritional intervention were also maintained.
Preoperative hematologic and biochemical parameters
2.3.2
A week before surgery, all blood samples were taken. The parameters collected included:
Complete Blood Count Parameters: Neutrophil count, lymphocyte count, eosinophil count, basophil count, monocyte count.
Derived Inflammatory Markers: Calculated based on the above cell counts, including: Neutrophil-to-lymphocyte ratio (NLR), derived NLR (dNLR), lymphocyte-to-monocyte ratio (LMR), platelet-to-lymphocyte ratio (PLR), neutrophil-to-lymphocyte-to-platelet ratio (NLPR), systemic inflammatory response index (SIRI), aggregate immune inflammatory index (AISI), systemic immune inflammatory index (SII), and pan-immune inflammatory value (PIV).
Nutritional and Biochemical Markers: Prognostic Nutritional Index (PNI), Albumin, Total Protein, Albumin-Globulin Ratio, Complement C1q, Lactate Dehydrogenase (LDH), 5’-nucleotidase (5’-NT), total bilirubin, alanine aminotransferase (ALT), aspartate aminotransferase (AST), urea, creatinine, and uric acid.
Surgical variables
2.3.3
Comprehensive documentation of surgical procedures and intraoperative findings, such as anastomosis technique (mechanical/manual), anastomosis site (intrathoracic/cervical), esophageal substitute elevation route (retrosternal/esophageal bed), enteral nutrition access method (nasojejunal tube/jejunostomy), and degree of lymph node dissection (standard two-field/extended two-field/three-field). The existence of pleural adhesions, pleural effusion, ascites, pleural metastases, and whether prolonged resection was necessary because of tumor invasion were among the intraoperative observations that were recorded. The location of the tumor and postoperative care, such as the use of an analgesic pump and ICU stay, were noted. Another important component that was noted was anastomotic leaking.
Postoperative pathological variables
2.3.4
Using the 8th edition of the American Joint Committee on Cancer (AJCC) TNM staging system, all pathology findings were reexamined and verified. Tumor size, degree of tumor resection (R0/R1/R2), T stage, N stage, M stage, G stage (grade), P stage (pathological TNM stage), circumferential margin status, histological type, lymph node metastases status, and presence of vascular/lymphatic invasion were among the variables gathered (34).
We now state that for variables with low missingness (<5%), we used multiple imputation via random forest (using the mice package in R). Variables with missingness >10% were excluded from the analysis.
Variable definition
2.4
Pleural metastasis is defined as: macroscopically visible nodules or diffuse implantations on the parietal/visceral pleura observed by the primary surgeon during open thoracotomy or thoracoscopic surgery, confirmed by intraoperative frozen section pathology or definitive postoperative paraffin section pathology. Postoperative pulmonary complications include pneumonia, respiratory failure, acute respiratory distress syndrome (ARDS), clinically significant atelectasis, and massive pleural effusion. The clinical diagnosis of pneumonia is established when chest imaging shows new or increasing pulmonary infiltrates and at least two of the three criteria listed below are present: (1) body temperature >38 °C; (2) purulent airway secretions; (3) peripheral blood white blood cell count >10.0×10^9^/L or <4.0×10^9^/L (35). Respiratory failure is defined as a PaO_2_/FiO_2_ ratio ≤200 mmHg or the need for mechanical ventilation (36). Acute respiratory distress syndrome (ARDS) is diagnosed according to the Berlin criteria (37). Atelectasis is defined as the presence of unilateral or bilateral focal consolidation, indicating focal loss of ventilation. Atelectasis is not included in the case criteria for ARDS, pneumonia, or fluid overload (38). A massive pleural effusion is characterized by respiratory impairment that necessitates closed chest drainage or therapeutic thoracentesis (39).
The number of cigarettes smoked daily times the number of years smoked (cigarette-years) is the smoking index. When patients at nutritional risk get specialist nutritional care (such as enteral or parenteral nutrition or oral nutritional supplements) for at least seven days before surgery, this is referred to as preoperative nutritional intervention.
The following formula is used to determine the derived inflammatory markers:
Statistical analysis
2.5
This study’s statistical analyses were all conducted using R software (version 4.3.1). Depending on their normality, continuous variables were reported as mean ± standard deviation or median (interquartile range), and the Student’s t-test or Mann-Whitney U test were used for comparison. Categorical variables were presented as frequency (percentage) and compared using chi-square test or Fisher’s exact test.
Patients were divided into training and validation sets at random in a 7:3 ratio. The purpose of this split was to make sure that the risk factors that were found were robust; variables were found in the training set, and their stability was evaluated in the independent validation set. The primary objective was to identify factors independently associated with PPCs. Variables with p-values < 0.05 in univariate analysis were included in the multivariate logistic regression model. Forward stepwise selection was subsequently employed to obtain the final simplified model, thereby identifying independent factors. Results are presented as odds ratios (OR) with their 95% confidence intervals (CI).
Based on the final set of independent factors found in the primary study, a nomogram was created for exploratory reasons. The area under the receiver operating characteristic curve (AUC) and the optimism-corrected C-index (obtained via 1000 bootstrap resamples) were used to evaluate its discriminative capacity. The Hosmer-Lemeshow goodness-of-fit test and calibration plots were used to assess calibration. Decision curve analysis (DCA) was used to investigate clinical utility. SHapley Additive exPlanations (SHAP) analysis was used to display each factor’s contribution and direction of influence in the exploratory model.
Results
3
Patient characteristics
3.1
In this study, 781 individuals who had radical EC resection were included. 91 patients (11.7%) experienced PPCs (PPCs group), whereas 690 individuals (88.3%) did not (non-PPCs group). Table 1 provides a detailed comparison of the baseline characteristics of the two groups. Overall, PPCs were associated with significantly lower nutritional immunological indicators (LMR, PNI, albumin-globulin ratio), and significantly higher systemic inflammatory markers (neutrophil count, NLR, dNLR, SIRI). In comparison to the group without PPCs, this group also showed noticeably greater rates of anastomotic fistula formation, postoperative ICU admission, and intraoperative pleural metastases. Age, gender, tumor stage, and histological type were among the baseline parameters that did not show statistically significant variations between the two groups.
This study used random sampling to split all 781 patients into a training set (n=549) and a validation set (n=232), with a sample size ratio of roughly 7:3 between the two groups, in order to ensure the robustness of the identified risk factors. The training set and validation set comparison is displayed in Table 2. The two sets were found to have excellent balance across all key variables, including demographic data, clinical features, tumor pathological parameters, surgery-related variables, laboratory indicators, and postoperative complication rates (all P > 0.05). This balanced distribution validates the suitability of the random split and offers a solid foundation for the factor identification and stability evaluation to follow.
Identifying risk factors for PPCs using univariate and multivariate logistic regression analysis
3.2
Eleven variables were shown to be substantially linked to PPCs in patients with EC in the univariate logistic regression analysis (Table 3). Risk factors included neutrophil count, eosinophil count, monocyte count, dNLR, PLR, SII, extended lymph node dissection, intraoperative pleural metastasis detection, postoperative ICU admission, and anastomotic fistula formation; LMR showed protective effects. There was no statistical significance in the remaining clinical and pathological factors.
Five independent predictors of PPCs were finally found using forward stepwise multiple logistic regression analysis. The eosinophil count (OR = 5.924, p=0.027), intraoperative pleural metastasis (OR = 6.853, p=0.026), postoperative ICU admission(OR = 6.963, p=0.006), and postoperative anastomotic leakage (OR = 13.454, p=0.000) were found to be significant risk factors, while the LMR (OR = 0.791, p=0.021) was a protective factor. The five independent predictors found by the multivariate logistic regression are shown graphically in Figure 2’s forest plot. Table 4 displays the multivariate logistic regression analysis’s findings.
Forest plot of risk factors. LMR, lymphocyte-to-monocyte ratio; ICU, intensive care unit.
Construction of nomograms
3.3
Based on the five independent factors found in the initial multivariable analysis, a nomogram was created for exploratory and illustrative reasons. The purpose of this visualization tool is to show how these elements work together, but it is not meant to be the main prediction model used in clinical settings. Among these, anastomotic fistula, postoperative ICU admission and pleural metastases are binary variables (0 denotes absence, 1 denotes presence). R statistical software was used to create a nomogram for PPCs in patients with EC based on the aforementioned algorithm. A simple nomogram is shown in Figure 3A, and a stylized nomogram is shown in Figure 3B.
(A, B) Nomogram for predicting PPCs. LMR, lymphocyte-to-monocyte ratio.
Additionally, we performed multicollinearity diagnostics (Table 5). All of the variables in the final model had variance inflation factors (VIFs) of less than 1.02, which guaranteed the stability of the model’s findings and showed no substantial multicollinearity among the variables.
Model performance and validation
3.4
To evaluate the explanatory power and robustness of the identified risk factors, this study uses ROC curves, bias corrected C-index and radar charts to assess the predictive model’s performance. Figure 4A shows the ROC curve. The model exhibits moderate but stable discriminatory capability, as shown by the blue curve representing the training set (AUC = 0.665, 95% CI 0.585–0.745) and the pink curve representing the test set (AUC = 0.561, 95% CI 0.446–0.676). The model shows consistent performance across datasets, despite the AUC values reflecting the inherent difficulties in predicting PPCs simply based on preoperative and intraoperative parameters. The predictive model reaches its ideal cutoff value when specificity is 0.967 and sensitivity is 0.317 on the training set, as Figure 4B illustrates. The Youden index at this point is 0.185. The detailed results of the ROC curve are listed in Table 6 for reference. We used the Bootstrap approach (with 1000 resamples) to compute the bias corrected C-index. The model obtained a bias corrected C-index of 0.666 on the training set and 0.557 on the independent validation set, according to the results. A radar chart showing the model’s overall performance across several metrics on the training and test datasets is shown in Figure 5. The model retains strong and consistent classification capabilities across many datasets with no indications of overfitting, as shown by the remarkably identical graphical profiles covering large areas.
(A, B) ROC curve results. ROC, receiver operating characteristic; AUC, area under the curve.
Radar chart of the prediction model. NPV, negative predictive value; AUC, area under the curve.
The model shows satisfactory calibration following correction, as seen in Figure 6, where the calibrated curve nearly resembles the ideal diagonal line. We used the Hosmer-Lemeshow goodness-of-fit test. The test did not produce any statistically significant results in either the validation set (p = 0.628) or the training set (p = 0.371). This shows that, over the whole risk spectrum, the estimated risks derived from these inflammatory and surgical factors show great consistency with actual observed probabilities, demonstrating that the model accurately reflects the correlation between the identified factors and clinical outcomes.
(A, B) Calibration curve of the predictive model.
This study used decision curve analysis (DCA) and clinical impact curves (CIC) to assess the clinical relevance of the risk model. In the DCA of the training set (Figure 7A) and validation set (Figure 7B), the model’s net benefit curve showed positive clinical net benefit throughout a wide range of threshold probabilities (about 0.1 to 0.8). Both the number of people the model identified as high risk and the number of people who experienced actual events show a steady decline as the high-risk threshold varies in the CIC of Figures 8A, B. The proximity of the curves validates that incorporating Eosinophils, LMR, Intraoperative Pleural Metastasis, Postoperative ICU Admission and Anastomotic Leakage into risk stratification offers tangible clinical value, allowing clinicians to identify vulnerable patients who may benefit from intensified perioperative management.
(A, B) DCA of the training set and validation set. DCA, decision curve analysis.
(A, B) CIC of the training set and validation set. CIC, clinical impact curves.
Exploratory assessment of variable contributions
3.5
The SHAP analysis variable importance plot in Figure 9 illustrates the magnitude of association between each risk factor and PPCs within the multivariable risk analysis. The five risk factors’ relative contributions to the risk probability are reflected in the SHAP values displayed in the figure. The most important predictor, according to analysis, is “LMR”. “Eosinophils count”, “Anastomotic Leakage”, “Postoperative ICU Admission” and “Pleural Metastasis” come next. The inflammatory marker “LMR” showed a notable protective effect among these, while “Eosinophils count” demonstrated a strong positive association with increased risk.
(A, B) The SHAP analysis variable importance plot. SHAP, shapley additive explanations; LMR, lymphocyte-to-monocyte ratio.
The SHAP dependency plot, which consists of five subplots examining five different indicators, is shown in Figure 10. The horizontal axis in each subplot represents the value range of the related indicator, and the vertical axis is the SHAP values. The biological and clinical relationships between risk factors and SHAP values are revealed using data distribution visualization, which makes it evident how each indicator modulates the risk of PPCs across a range of values. More significantly, it shows that the model views these inflammatory markers and surgical complications as interacting and amplifying one another rather than acting independently, ultimately determining the overall clinical risk profile.
(A, B) The SHAP dependency plot. SHAP, shapley additive explanations; LMR, lymphocyte-to-monocyte ratio.
Logistic curve
3.6
The logistic curves for three continuous variables— eosinophils count, and LMR—are shown in (Figures 11A, B). In keeping with the typical features of a logistic function, these curves consistently show a large nonlinear effect of each variable on the response probability. They make evident the patterns of correlation between many factors and the likelihood of PPCs occurring.
The logistic curves for three continuous variables. LMR, lymphocyte-to-monocyte ratio.
RCS curve
3.7
To examine the relationship between continuous variables and PPCs, (Figures 12A, B) shows the RCS curves for eosinophil count and LMR, respectively. The findings show that eosinophil count show significant overall associations with outcomes (overall P < 0.05). There is no evidence of significant nonlinear trends (P−non−linear > 0.05), indicating effects closer to a linear pattern. However, the association between LMR and PPCs was not statistically significant (P−overall = 0.096, P−non−linear = 0.925).
RCS curves for three continuous variables. LMR, lymphocyte-to-monocyte ratio.
Discussion
4
The overall incidence of PPCs in our study was determined to be 11.65%. Patients’ quick recovery and long-term survival are significantly hampered by PPCs (40, 41). Additionally, they greatly extend hospital stays, which puts a strain on healthcare resources and increases the financial burden on patients’ families (42–44). The postoperative ICU admission, eosinophil count, LMR, intraoperative pleural metastasis, and postoperative anastomotic leakage are the five major independent risk factors identified in this comprehensive risk factor analysis. This method makes it possible to identify high-risk individuals based on biological and surgical characteristics, giving medical professionals vital information for targeted therapeutic interventions and focused prevention during the perioperative phase.
Transfer To ICU, intraoperative pleural metastasis and postoperative anastomotic leakage are the strongest independent risk variables (OR > 6) for predicting PPCs, as this study clearly demonstrates. Our results are in line with the study by Jin et al., which found anastomotic leaking to be an independent risk factor for postoperative pneumonia (19). Nevertheless, neither intraoperative pleural metastasis or postoperative ICU admission nor the connection between the three risk factors were included in their study. This clearly identifies a group of patients who are at high risk. When patients have intraoperative evidence of pleural metastasis, clinicians must take all essential precautions to prevent anastomotic leakage. Patients with anastomotic leakage complicated by pleural metastases need to be monitored at the highest level due to the compounding severity of their situation.
Preoperative peripheral blood eosinophil levels were found to be an independent strong risk factor (OR = 6.499), which is an important discovery. This contradicts the conventional understanding that eosinophils are only involved in parasitic or allergic illnesses. To the best of our knowledge, this is the first study to show a correlation between eosinophil counts and PPCs following surgery in patients with EC, as well as the first to integrate this discovery into a prediction model. We speculate that patients may have a Th2-dominant immune response as a baseline condition if preoperative high eosinophil counts are present (45–47). Postoperative surgical trauma may intensify this particular immunological microenvironment. On the one hand, it releases harmful granule contents such major basic protein and eosinophil cationic protein, which directly harm the airway epithelium (48–51). On the other hand, the Th1/cytotoxic immune response, which is crucial for fighting bacterial infections, may be weakened by Th2 dominance, greatly raising the risk of postoperative pneumonia (52–54). Eosinophils might therefore be thought of as a new, easily accessible biomarker that reflects certain immunological vulnerabilities in the body.
In contrast to eosinophils, the LMR demonstrated a protective effect in this study. A reduction in lymphocyte-mediated antitumor immune function and an increase in monocyte-mediated systemic inflammation are typical of LMR composite indicator (55). Our results show that a higher preoperative LMR is consistently associated with a lower risk of PPCs. This is consistent with its value in long-term prognosis studies across several cancers (56–60). This highlights the importance of maintaining a balance between the patient’s preoperative immune function and inflammatory levels for a smooth perioperative period. It also provides theoretical support for lowering complication risks by enhancing the patient’s baseline immune status.
This study’s creativity and methodical approach are its main advantages. This is the first time that a number of novel systemic inflammatory markers have been systematically evaluated and integrated into a risk analysis framework for PPCs following EC surgery. The independent predictive value of eosinophils and LMR was successfully validated. This gives the field a new biological dimension and sheds light on the immunological and inflammatory processes that underlie PPCs following surgery. Second, in order to thoroughly evaluate the utility of these markers, we used a very strict validation framework that included discrimination ability, calibration, clinical decision curves, and model interpretability analysis. We discovered a strong synergistic effect between pleural metastasis and anastomotic leaking by additive interaction analysis; this finding has obvious implications for clinical risk classification. In order to facilitate the application of these findings in clinical practice and the translation of research findings into clinical implementation, we finally converted the risk factors into an easy-to-use nomogram tool.
However, there are certain drawbacks to this study as well. First, despite thorough internal validation, the results of this single-center retrospective investigation could be skewed by selection bias. Further validation of their generalizability is needed in large-scale, prospective, multicenter cohort investigations. Second, even though we included a wide variety of clinical and laboratory variables, the analysis might not have fully taken into account some potential confounding factors, such as more precise pulmonary function measures, patient performance status scores, or unrecorded concurrent medications. Additionally, after excluding postoperative length of stay to avoid reverse causality, the overall discriminative power (AUC) of the preoperative risk model was moderate. This reflects the inherent complexity of PPCs, which are influenced by multiple dynamic intraoperative and postoperative factors beyond baseline inflammation. Finally, in our retrospective database, we did not systematically record whether patients had a history of asthma/allergies or routine preoperative steroid use. These conditions may influence the levels of inflammatory mediators in patients. Nevertheless, the strong independent associations and calibration of the identified risk factors confirm their biological and clinical significance. Future studies might include dynamic monitoring of postoperative inflammatory marker patterns, which might more accurately identify the window of opportunity for the beginning of complications.
Conclusion
5
This work systematically evaluated the independent prognostic value of novel inflammatory markers and surgical factors for PPCs. Instead of merely creating a forecasting tool, this study highlighted the biological significance of preoperative Eosinophils and LMR. Ultimately, it provides clinicians with valuable insights to recognize biologically vulnerable patients early, facilitating customized, focused preventive tactics for those at the highest risk.
The reference list from the paper itself. Each links out to its DOI / PubMed record.
- 1Simard EP Ward EM Siegel R Jemal A . Cancers with increasing incidence trends in the United States: 1999 through 2008. CA Cancer J Clin. (2012) 62:118–28. doi: 10.3322/caac.20141, PMID: 22281605 · doi ↗ · pubmed ↗
- 2Sung H Ferlay J Siegel RL Laversanne M Soerjomataram I Jemal A . Global cancer statistics 2020: GLOBOCAN estimates of incidence and mortality worldwide for 36 cancers in 185 countries. CA Cancer J Clin. (2021) 71:209–49. doi: 10.3322/caac.21660, PMID: 33538338 · doi ↗ · pubmed ↗
- 3Siegel RL Miller KD Fuchs HE Jemal A . Cancer statistics, 2021. CA Cancer J Clin. (2021) 71:7–33. doi: 10.3322/caac.21654, PMID: 33433946 · doi ↗ · pubmed ↗
- 4Bray F Ferlay J Soerjomataram I Siegel RL Torre LA Jemal A . Global cancer statistics 2018: GLOBOCAN estimates of incidence and mortality worldwide for 36 cancers in 185 countries. CA Cancer J Clin. (2018) 68:394–424. doi: 10.3322/caac.21492, PMID: 30207593 · doi ↗ · pubmed ↗
- 5Sjoquist KM Burmeister BH Smithers BM Zalcberg JR Simes RJ Barbour A . Survival after neoadjuvant chemotherapy or chemoradiotherapy for resectable oesophageal carcinoma: an updated meta-analysis. Lancet Oncol. (2011) 12:681–92. doi: 10.1016/S 1470-2045(11)70142-5, PMID: 21684205 · doi ↗ · pubmed ↗
- 6Lagergren J Smyth E Cunningham D Lagergren P . Oesophageal cancer. Lancet. (2017) 390:2383–96. doi: 10.1016/S 0140-6736(17)31462-9, PMID: 28648400 · doi ↗ · pubmed ↗
- 7Grimminger PP Goense L Gockel I Bergeat D Bertheuil N Chandramohan SM . Diagnosis, assessment, and management of surgical complications following esophagectomy. Ann N Y Acad Sci. (2018) 1434:254–73. doi: 10.1111/nyas.13920, PMID: 29984413 · doi ↗ · pubmed ↗
- 8Xu QL Li H Zhu YJ Xu G . The treatments and postoperative complications of esophageal cancer: a review. J Cardiothorac Surg. (2020) 15:163. doi: 10.1186/s 13019-020-01202-2, PMID: 32631428 PMC 7336460 · doi ↗ · pubmed ↗