Nonlinear Association Between THs, TSH, and HbA1c in Patients With Type 2 Diabetes Mellitus: A Retrospective Study
Mengjie Chen, Yuqin Gan, Fengxiang Tian, Yun Bao, Zhonglan Chen

TL;DR
This study found nonlinear relationships between thyroid hormones and blood sugar levels in patients with type 2 diabetes.
Contribution
The study reveals novel nonlinear associations between thyroid hormones (FT3, FT4, TSH) and HbA1c in type 2 diabetes patients.
Findings
FT4 shows a significant nonlinear relationship with HbA1c, with an inflection point at 14.82 pmol/L.
TSH demonstrates a nonlinear association with HbA1c, with an inflection point at 5.53 mIU/L.
Below the TSH threshold, higher TSH levels are inversely associated with HbA1c.
Abstract
This study aimed to investigate the potential non‐linear relationships between thyroid hormones and thyroid‐stimulating hormone levels on glycemic control levels. A retrospective analysis of electronic medical records was performed on patients with T2DM who received treatment at a tertiary care hospital in Chengdu, Sichuan Province, between 2018 and 2023. RCS regression and threshold effect analyses were employed to assess potential nonlinear associations among THs, TSH, and glycemic control. Data from a total of 1413 patients were included in the analysis. RCS regression revealed a significant non‐linear association between FT3 and HbA1c (p for nonlinearity < 0.05). Threshold effect analysis demonstrated no statistically significant inflection point for FT3 in relation to HbA1c (FT3 < 5.92 pmol/L, β = 0.008, 95% CI (−0.122, 0.281); FT3 > 5.92 pmol/L, β = −0.109, 95% CI (−0.261,…
Genes, proteins, chemicals, diseases, species, mutations and cell lines named across the full text — each resolved to its canonical identifier and authoritative record.
Click any figure to enlarge with its caption.
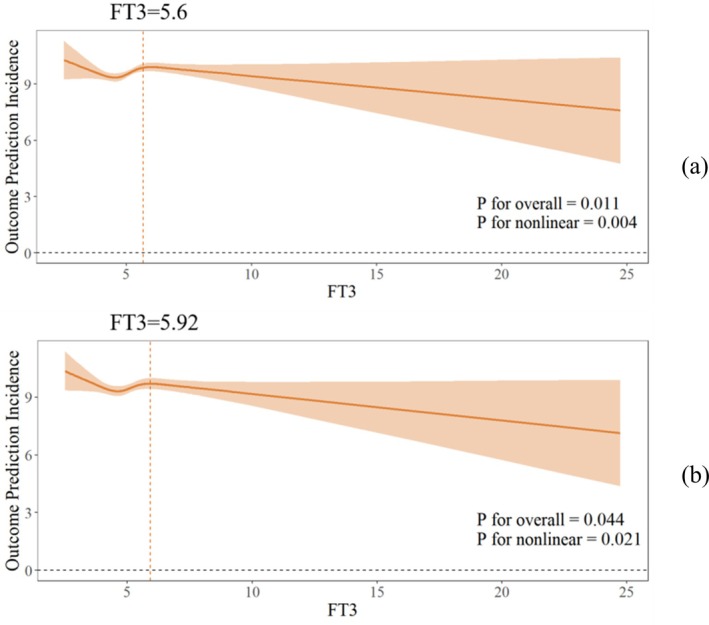 FIGURE 1
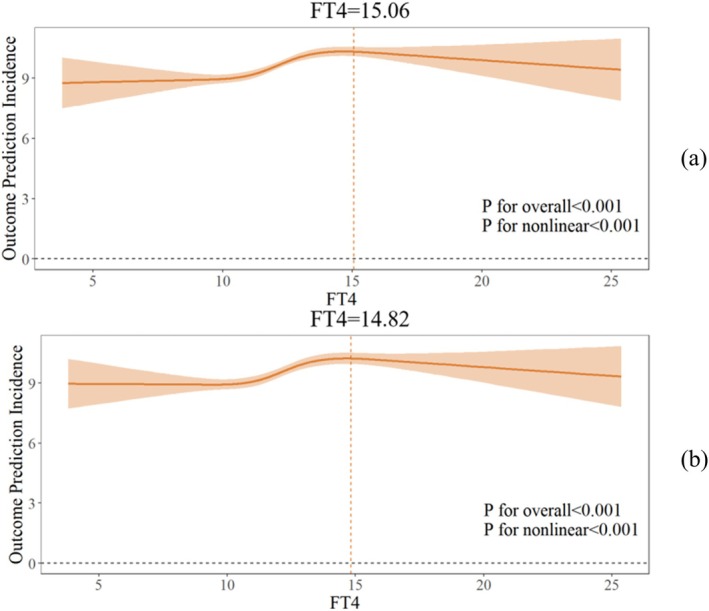 FIGURE 2
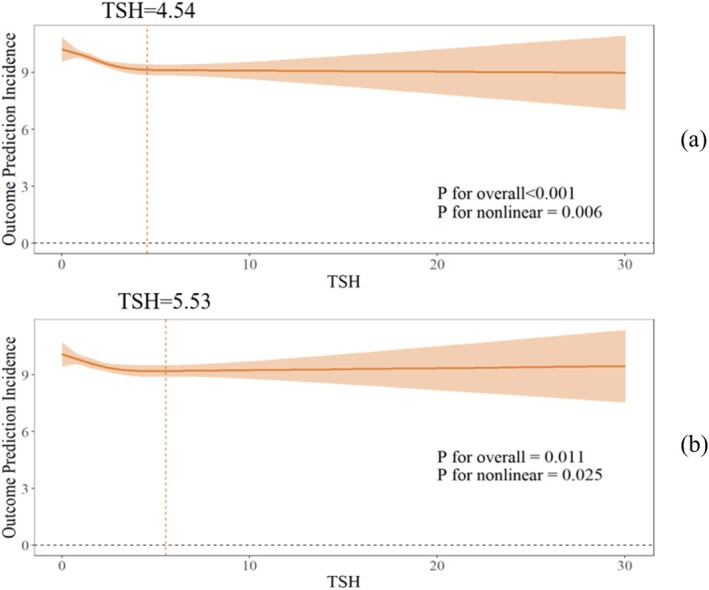 FIGURE 3
| Variables |
| Variable |
|
|---|---|---|---|
| Gender | FT4 (pmol/L) | 12.29 ± 2.25 | |
| Man | 814 (57.6%) | < 7.98 | 22 (1.6%) |
| Woman | 599 (42.4%) | 7.98–16.02 | 1323 (93.6%) |
| Age (years) | 56.38 ± 12.98 | > 16.02 | 68 (4.8%) |
| ≤ 60 years | 881 (62.3%) | TSH (mIU/L) | 1.73 (1.17, 2.71) |
| > 60 years | 532 (37.7%) | < 0.56 | 65 (4.6%) |
| BMI (kg/m2) | 24.07 ± 3.41 | 0.56–5.91 | 1298 (91.2%) |
| FT3 (pmol/L) | 5.15 ± 1.22 | > 5.91 | 59 (4.2%) |
| < 3.53 | 32 (2.3%) | HbA1c (%) | 9.63 ± 2.58 |
| 3.53–7.37 | 1361 (96.3%) | ≤ 7 | 275 (19.5%) |
| > 7.37 | 20 (1.4%) | > 7 | 1138 (80.5%) |
| Crude | Adjusted | |
|---|---|---|
| Fitting model by standard linear regression | 0.019 (−0.092–0.129) | −0.037 (−0.146–0.072) |
| Fitting model by two‐piecewise linear regression inflection point | 5.68 | 5.92 |
| FT3 < inflection point | 0.212 (−0.005, 0.429) | 0.008 (−0.122, 0.281) |
| FT3 > inflection point | −0.086 (−0.237, 0.064) | −0.109 (−0.261, 0.042) |
|
| 0.043 | 0.176 |
| Crude | Adjusted | |
|---|---|---|
| Fitting model by standard linear regression | 0.193 (0.134–0.252) | 0.179 (0.121–0.236) |
| Fitting model by two‐piecewise linear regression inflection point | 15.06 | 14.82 |
| FT4 < inflection point | 0.278 (0.205, 0.351) | 0.263 (0.189, 0.337) |
| FT4 > inflection point | −0.151 (−0.336, 0.034) | −0.116 (−0.287, 0.055) |
|
| < 0.001 | < 0.001 |
| Crude | Adjusted | |
|---|---|---|
| Fitting model by standard linear regression | −0.009 (−0.146–0.034) | −0.055 (−0.111–0) |
| Fitting model by two‐piecewise linear regression inflection point | 4.54 | 5.53 |
| TSH < inflection point | −0.267 (−0.384, −0.149) | −0.179 (−0.281,‐0.076) |
| TSH > inflection point | 0.015 (−0.068, 0.098) | 0.042 (−0.046, 0.13) |
|
| < 0.001 | 0.005 |
Peer Reviews
No public reviews on file for this paper yet. If you reviewed it on a platform where reviews are public (OpenReview, ICLR, NeurIPS, ICML), you can paste yours below so the community can read it here.
Videos
No videos yet. Explain this paper in a talk, walkthrough, or lecture? Add one.
Taxonomy
TopicsThyroid Disorders and Treatments · Thyroid Cancer Diagnosis and Treatment · Diabetes and associated disorders
Introduction
1
Diabetes mellitus poses a major public health challenge, with its global incidence rising steadily in recent decades. Type 2 diabetes mellitus (T2DM) represents the predominant form of diabetes, responsible for over 90% of global diabetes cases [1]. The overall prevalence of T2DM in China has reached 14.92%, and the number of diabetic patients has exceeded 140 million, ranking first globally [2]. This epidemic imposes considerable economic burdens and health risks at both societal and familial levels [1].
Hyperglycemia is a hallmark of diabetic metabolic abnormalities, primarily resulting from pancreatic β‐cell dysfunction [3, 4]. Chronic hyperglycaemia is associated with microvascular and macrovascular complications, reduced quality of life, and premature mortality [5]. Glycated hemoglobin (HbA1c) serves as a critical indicator for diabetes management, reflecting long‐term glycemic control over the preceding 2–3 months [6]. Elevated HbA1c levels are strongly associated with an increased risk of diabetes‐related complications and mortality [7]. Proactive management of HbA1c in individuals with diabetes is essential for attenuating these risks.
Thyroid hormones (THs), which are critical endocrine regulators in humans, play a pivotal role in regulating glucose metabolism [8, 9]. They modulate glucose homeostasis through pancreatic β‐cell activity and coordinated metabolic interactions among multiple organs, including the liver, pancreas, etc. [10]. Additionally, THs antagonize insulin's physiological effects, suppressing hepatic glucose production and impairing muscular glucose uptake [11]. Concurrently, the body's Thyroid‐stimulating hormone (TSH) levels are closely associated with neurocognitive deficits, obesity, dyslipidemia, T2DM, and related comorbidities [12]. Thyroid dysfunction can induce insulin resistance, cause blood glucose fluctuation, and aggravate glucose metabolism disorders. This not only increases the incidence and severity of diabetes but also complicates its clinical management [13, 14, 15, 16].
Rising blood glucose indicates that marked insulin resistance, which may be attributable to TSH and THs; this condition requires early intervention to achieve stricter glycemic control blood and improve the prognosis [17]. However, the precise regulatory effects of TH and TSH on blood glucose homeostasis remain debated. Some studies have indicated a positive correlation between TSH levels and HbA1c [18, 19], while others suggest that elevated TSH enhances insulin sensitivity, potentially leading to hypoglycemia [20]; notably, studies in diabetic populations have further observed that both TSH and Free triiodothyronine (FT3) are negatively correlated with HbA1c [12, 21]. In individuals with T2DM, even subtle variations in thyroid hormone levels may significantly influence blood glucose regulation. Importantly, most previous studies have relied on linear models, which could overlook potential threshold effects or non‐linear relationships.
To address this gap, we conducted a retrospective study to evaluate the nonlinear associations and threshold effects between FT3, FT4, TSH, and HbA1c using restricted cubic spline regression and segmented modeling. The findings from this study may provide new evidence for the mechanism of thyroid‐glucose metabolism interactions in T2DM, offering a novel theoretical basis and revealing potential therapeutic targets to improve glycemic control and clinical outcomes in patients with T2DM.
Methods
2
Design and Participants
2.1
This retrospective cohort study enrolled 1549 patients with T2DM from the Standardized Metabolic Management Center (MMC) at the Department of Endocrinology, a tertiary care hospital in Chengdu, China, between January 2018 and December 2023.
Inclusion criteria: (1) Diagnosis of T2DM according to the WHO 1999 diagnosis and classification criteria [22]; (2) Age ≥ 18 years at enrollment.
Exclusion criteria: (1) Concomitant severe chronic diseases (e.g., malignancies, hepatic/renal dysfunction, etc.); (2) Incomplete clinical data; (3) Diagnosis of other endocrine disorders (e.g., adrenal diseases, thyroid‐related conditions, and other endocrine disorders affecting thyroid function, etc.).
Data Collection
2.2
We collected general demographic and laboratory‐related data from the patients. Demographic variables primarily included age, sex, height, and weight. Body mass index (BMI) was calculated as the ratio of weight to height squared (kg/m^2^). BMI (kg/m^2^) = weight (kg)/height^2^ (m) [23].
The primary laboratory data included three thyroid function tests: free triiodothyronine (FT3), free tetraiodothyronine (FT4), and thyroid stimulating hormone (TSH). The reference ranges for these thyroid function parameters were as follows: FT3, 3.53–7.37 pmol/L; FT4, 7.98–16.02 pmol/L; and TSH, 0.56–5.91 mIU/L, based on the reference standards of the hospital's Laboratory Department.
Statistical Analysis
2.3
Data were exported from EpiData (Chinese version) management software and analyzed using IBM SPSS 27.0 and R 4.4. Quantitative data were presented as the mean ± standard deviation (χ¯ ± SD) or median with interquartile range (M [Q1, Q3]), while qualitative data were expressed as n (%). Restricted cubic spline (RCS)‐fitted multiple linear regression models were used to assess the nonlinear associations between the three thyroid function parameters and HbA1c, the number of knots set to 4, with adjustments for potential confounders, including sex, age, and BMI. Threshold analysis and segmented fitting were performed for each model. All statistical tests were two‐sided, with p < 0.05 considered statistically significant.
Ethical Considerations
2.4
The study was approved by the Ethics Committee of First Affiliated Hospital of Chengdu Medical College (approval no. 2022cyfyirb‐BA‐Dec01), and it was carried out in accordance with the Code of Ethics of the World Medical Association (Declaration of Helsinki).
Results
3
General Demographic Information
3.1
A total of 1549 patients with T2DM were collected in this study. After excluding 136 patients with incomplete data, 1413 participants were included in the final analysis. Among these, 814 were male (57.6%) and 599 were female (42.4%). The mean age of the patients was 56.38 ± 12.98 years, with 881 patients (62.3%) aged 60 years or younger. The average BMI was 24.07 ± 3.41 kg/m^2^, and the mean HbA1c level was 9.63% ± 2.58%. Further details are provided in Table 1.
Nonlinear Association Between FT3 and HbA1c
3.2
Both the unadjusted model and the model adjusted for confounders exhibited a significant nonlinear association between FT3 and HbA1c (both p for nonlinearity < 0.05; Figure 1). In the final model, threshold analysis and segmented regression were performed, revealing an inflection point at FT3 = 5.92 pmol/L. However, no significant association was observed between FT3 and HbA1c when FT3 < 5.92 pmol/L or FT3 > 5.92 pmol/L (FT3 < 5.92: β = 0.008, 95% CI (−0.122, −0.281); FT3 > 5.92: β = −0.109, 95% CI (−0.261–0.042); p for log‐likelihood ratio = 0.176; Figure 1; Table 2). These findings indicate a nonlinear relationship between FT3 and HbA1c, though no distinct threshold effect was identified.
Non‐linear relationship between FT3 and HbA1c: (a) crude model (b) adjusted for age, gender, BMI.
Nonlinear Association Between FT4 and HbA1c
3.3
Both the unadjusted model and the model adjusted for confounders exhibited a significant nonlinear association between FT4 and HbA1c (both p for nonlinearity < 0.05; Figure 2). In the final model, threshold analysis and segmented regression were performed, revealing an inflection point at FT4 = 14.82 pmol/L. A 0.263% increase in HbA1c was observed per unit increase in FT4 when FT4 < 14.82 pmol/L, but no significant association was found when FT4 > 14.82 pmol/L (FT4 < 14.82: β = 0.263, 95% CI (0.189, 0.337); FT4 > 14.82:β = −0.116, 95% CI (−0.287, 0.005); p for log‐likelihood ratio < 0.001; Figure 2; Table 3).
Non‐linear relationship between FT4 and HbA1c: (a) crude model (b) adjusted for age, gender, BMI.
Nonlinear Association Between TSH and HbA1c
3.4
Both the unadjusted model and the model adjusted for confounders exhibited a significant nonlinear association between TSH and HbA1c values (both p for nonlinearity < 0.05; Figure 3). In the final model, threshold analysis and segmented regression revealed an inflection point at TSH = 5.53 mIU/L. When TSH < 5.53 mIU/L, each unit increase in TSH was associated with a 0.179% decrease in HbA1c. However, no significant association was observed when TSH < 5.53 mIU/L (TSH < 5.53: β = −0.179, 95% CI (−0.281, −0.076); TSH > 5.53: β = 0.042, 95% CI (−0.046, 0.130); p for log‐likelihood ratio = 0.005; Figure 3; Table 4).
Non‐linear relationship between TSH and HbA1c: (a) crude model (b) adjusted for age, gender, BMI.
Discussion
4
Effect of FT3 on Blood Glucose
4.1
Our study identified a significant nonlinear association between FT3 and HbA1c, although no significant threshold effect was observed. This finding may be explained by the relatively concentrated distribution of FT3 levels in our study, as over 90% of participants exhibited values within the normal range. Within this range, thyroid hormones act synergistically with insulin to facilitate glucose disposal and utilization in peripheral tissues [24, 25]. Consequently, the influence of FT3 on HbA1c is limited [26, 27] and potentially masked by other metabolic factors. Previous studies have reported a positive correlation between BMI and FT3, as well as a significant effect of BMI on HbA1c [28, 29]. In the present study, we controlled for BMI as a confounding factor, which may have attenuated the threshold effect in the nonlinear relationship between FT3 and HbA1c.
Although no significant threshold effect was identified between FT3 and HbA1c, the observed nonlinear trend suggests a potential but modest protective effect of FT3 in glycemic regulation among patients with T2DM. Previous research has demonstrated a positive correlation between FT3 levels and pancreatic β‐cell function in pre‐diabetic populations, suggesting that FT3 may contribute to glucose homeostasis through mechanisms such as inhibiting β‐cell apoptosis and enhancing insulin gene transcription and expression [30, 31, 32]. These findings imply that FT3 should be considered a continuous regulatory factor in the glycemic management of patients with T2DM. However, the sensitivity of using FT3 alone as a clinical predictor for glycemic control is limited, necessitating an integrated interpretation in conjunction with other metabolic indicators.
However, existing evidence remains inconsistent; while Jing et al. [24] reported a negative correlation between FT3 and blood glucose, other studies have documented a positive association with fasting hyperglycemia [33]. These discrepancies underscore the necessity for large‐scale prospective cohort studies to further elucidate the dose–response relationship between FT3 and HbA1c regulation.
Effect of FT4 on Blood Glucose
4.2
Our study identified a significant nonlinear association between FT4 and HbA1c using restricted cubic spline modeling, with threshold analysis revealing an inflection point at 14.82 pmol/L. Specifically, when FT4 was below 14.82 pmol/L, higher FT4 values were correlated with increased HbA1c levels, whereas above this threshold, the association was not statistically significant. This finding provides a plausible explanation for the inconsistent results in previous meta‐analyses examining the FT4‐HbA1c relationship in euthyroid populations [34], as the lack of consideration for nonlinear effects could have led to the discrepant results.
From a biological perspective, FT4 may influence glucose metabolism through dual mechanisms within the low‐to‐moderate concentration range. On one hand, thyroid hormones can directly stimulate hepatic glucose production by activating key gluconeogenic enzymes, leading to elevated blood glucose levels [35, 36]. Relevant studies also indicate that individuals with lower FT4 levels exhibit higher fasting blood glucose and HbA1c levels [37], alongside an increased risk of prediabetes [36]. On the other hand, FT4 may enhance β‐adrenergic receptor sensitivity, indirectly exacerbating insulin resistance and impairing glucose utilization, thereby contributing to further elevations in HbA1c [38, 39].
However, when FT4 approaches the upper limit of the normal range, compensatory mechanisms may be activated, such as thyroid hormone receptor desensitization or upregulation of deiodinase activity, attenuating its regulatory impact on glucose metabolism [35, 40]. Thus, these homeostatic responses may explain the absence of a continued rise in HbA1c at elevated FT4 levels, suggesting that within the normal thyroid function range, FT4 fluctuations exert a limited influence on glucose homeostasis [41].
Effect of TSH on Blood Glucose
4.3
Threshold analysis of TSH and HbA1c in our study revealed an inflection point at 5.53 mIU/L. Specifically, TSH was negatively correlated with HbA1c when TSH was below 5.53 mIU/L, indicating a protective effect of TSH on HbA1c within this range. For patients with T2DM and normal thyroid function, maintaining TSH at relatively low levels may be more beneficial for glycemic control. However, when TSH exceeded 5.53 mIU/L, no significant correlation was observed. Previous studies on the effect of TSH on blood glucose levels have yielded inconsistent results [24, 42]. This finding challenges the traditional linear model assumption and provides a new perspective on the complex interplay between thyroid function and glucose metabolism.
The protective effects of TSH within the low‐to‐moderate concentration range reflect a compensatory mechanism in the early stages of hypothyroidism. Specifically, at lower concentrations, TSH reduces HbA1c levels by stimulating the release of free FT3 and FT4 from the thyroid gland, which could enhance insulin sensitivity and promote glucose uptake in peripheral tissues [35, 43]. However, when TSH exceeds 5.53 mIU/L, its association with HbA1c dissipates, which may indicate metabolic disturbances characteristic of the hypothyroid state. Hypothyroidism is often associated with insulin resistance and increased hepatic glucose production, both of which counteract the protective influence of TSH on glucose metabolism [44]. Furthermore, it has been suggested that the effect of TSH on HbA1c may plateau once a certain threshold is surpassed [43, 45, 46], possibly due to adaptive mechanisms such as the downregulation of insulin‐antagonistic effects or changes in thyroid hormone receptor sensitivity [47]. Thus, at higher TSH levels, the relationship between TSH and HbA1c may be obscured by these underlying metabolic dysfunctions. Similar findings have been reported in other studies; for example, the association between TSH and cardiovascular risk has also been shown to exhibit nonlinearity [48]. A large prospective study further suggested that TSH may offer metabolic protection at lower levels, but this effect diminishes or disappears beyond a certain threshold [49].
In this study, the associations of FT4 and TSH with HbA1c exhibit concentration‐dependent non‐linear characteristics, with 14.82 pmol/L and 5.53 mIU/L identified as the respective optimal concentration thresholds, providing potential biomarkers for glycemic management in the euthyroid population. Specifically, in individuals with FT4 < 14.82 pmol/L or TSH < 5.53 mIU/L, fluctuations in FT4 and TSH may significantly impact glucose metabolism, even within the normal range of thyroid function. Consequently, variations in thyroid hormones represent a non‐negligible factor in the glycemic management of patients with T2DM. In addition to glycemic control, regular monitoring of thyroid hormone levels is recommended. Timely clinical intervention should be initiated for patients exhibiting abnormal levels or high variability, particularly among high‐risk individuals with comorbid obesity or metabolic syndrome. While this study offers a novel perspective on the intricate relationship between thyroid hormones and glucose metabolism, further research is warranted to elucidate the underlying biological mechanisms and validate these clinical implications.
Limitation
5
Firstly, this study employed a retrospective design, precluding the ability to infer causality. Secondly, although potential confounders such as BMI, age, and sex were adjusted for, data regarding the use of insulin resistance indices, glucose‐lowering medications, or thyroid medications were not included, which may introduce residual confounding bias. Moreover, the thyroid hormone levels of the participants were predominantly within the reference range, which limits the generalizability of the findings to populations with abnormal thyroid function. Future longitudinal cohort or interventional studies, which account for thyroid antibody status and medication use and extend to subgroups with thyroid dysfunction, are recommended to further validate the generalizability and elucidate the mechanisms underlying the threshold effect.
Conclusion
6
This study is the first to identify nonlinear associations and threshold effects between FT3, FT4, TSH, and HbA1c using an innovative nonlinear analysis approach. Although the findings demonstrate an association rather than causation, they provide novel insights and evidence that support further investigation into the relationship between thyroid function and glucose metabolism. Additionally, they suggest a potential biomarker for the management of blood glucose levels in diabetic patients. Moving forward, we plan to conduct well‐designed prospective cohort studies or randomized controlled trials to further explore this association and establish causality.
Author Contributions
Mengjie Chen: writing – original draft, formal analysis, investigation. Yuqin Gan: formal analysis, investigation, writing – review and editing. Fengxiang Tian: investigation, data curation, validation. Yun Bao: writing – review and editing, supervision, writing – Reviewing. Zhonglan Chen: conceptualization, methodology, writing – review and editing. All authors have read and approved the final manuscript.
Funding
The authors have nothing to report.
Ethics Statement
The study was approved by the Ethics Committee of First Affiliated Hospital of Chengdu Medical College (approval no. 2022CYFYIRB‐BA‐Dec01), and it was carried out in accordance with the Code of Ethics of the World Medical Association (Declaration of Helsinki).
Consent
As this was a retrospective study that did not cause any harm to the patients, it was exempted by the Ethics Committee from the requirement of signing a patient informed consent form.
Conflicts of Interest
The authors declare no conflicts of interest.
The reference list from the paper itself. Each links out to its DOI / PubMed record.
- 1International Diabetes Federation , IDF Diabetes Atlas, 10th ed. (2021).
- 2National Centre for Geriatrics, Chinese Medical Association Diabetes Branch, Chinese Society Of Sports Science , “Guideline for Eexercise Therapy of Type 2 Diabetes Mellitus in China (20242024 Edition),” Chinese Journal of Sports Medicine 43, no. 06 (2024): 419–452, 10.3969/j.issn.1000-6710.2024.06.001. · doi ↗
- 3E. H. Elgazar , N. E. Esheba , S. A. Shalaby , and W. F. Mohamed , “Thyroid Dysfunction Prevalence and Relation to Glycemic Control in Patients With Type 2 Diabetes Mellitus,” Diabetes and Metabolic Syndrome: Clinical Research and Reviews 13, no. 4 (2019): 2513–2517, 10.1016/j.dsx.2019.07.020.31405670 · doi ↗ · pubmed ↗
- 4American Diabetes Association , “Classification and Diagnosis of Diabetes: Standards of Medical Care in Diabetes‐2019,” Diabetes Care 42, no. 1 (2019): S 13–S 28, 10.2337/dc 19-S 002.30559228 · doi ↗ · pubmed ↗
- 5K. Khunti , F. Zaccardi , A. Amod , et al., “Glycaemic Control Is Still Central in the Hierarchy of Priorities in Type 2 Diabetes Management,” Diabetologia 68, no. 1 (2025): 17–28, 10.1007/s 00125-024-06254-w.39155282 PMC 11663178 · doi ↗ · pubmed ↗
- 6American Diabetes Association , “6.Glycemic Targets: Standards of Medical Care in Diabetes‐2021,” Diabetes Care 44, no. Suppl 1 (2021): S 73–S 84, 10.2337/dc 21-S 006.33298417 · doi ↗ · pubmed ↗
- 7M. Stolar , “Glycemic Control and Complications in Type 2 Diabetes Mellitus,” American Journal of Medicine 123 (2010): S 3–S 11, 10.1016/j.amjmed.2009.12.004.20206730 · doi ↗ · pubmed ↗
- 8L. Yu , Z. Li , R. Yang , et al., “Impaired Sensitivity to Thyroid Hormones Is Associated With Elevated Blood Glucose in Coronary Heart Disease,” Front Endocrinol (Lausanne) 13 (2022): 895843, 10.3389/fendo.2022.895843.35784545 PMC 9240192 · doi ↗ · pubmed ↗