Genetic Analysis and Clinical Effect of ACE2 Gene Variants (rs2285666 and rs4646188) on Coronary Syndrome in Dyslipidaemia Patients
Shaimaa Y. Abdulfattah, Sumaya Saady

TL;DR
This study found that specific genetic variations in the ACE2 gene are linked to increased risk of coronary artery disease in people with dyslipidaemia.
Contribution
The study identifies ACE2 gene variants rs2285666 and rs4646188 as risk factors for coronary artery disease in dyslipidaemia patients.
Findings
The T-allele of rs2285666 increases CAD risk in both males and females with dyslipidaemia.
The G-allele of rs4646188 is significantly associated with CAD risk in both sexes.
Both gene variants are linked to dyslipidaemia-related lipid profile changes.
Abstract
This study aimed to investigate the association of two intronic polymorphisms of the ACE2 gene (rs2285666 and rs4646188) with coronary artery disease (CAD) in Iraqi patients with dyslipidaemia. This case-control study was conducted from March to September 2023 at the Iraqi Center of Heart Disease, Baghdad, Iraq, and included patients with CAD and dyslipidaemia. Genotyping was performed using TaqMan probes and real-time qPCR. A total of 170 participants were included in this study. Demographic, echocardiographic, and lipid profile data were analysed, revealing significant differences in age, left ventricular ejection fraction %, LV systolic diameter, LV diastolic diameter and lipid parameters. The T-allele of rs2285666 was significantly associated with CAD risk in both females (odds ratio [OR] = 2.06, 95% confidence interval [CI]: 1.06–4; P = 0.032) and males (OR = 3, 95% CI:…
Genes, proteins, chemicals, diseases, species, mutations and cell lines named across the full text — each resolved to its canonical identifier and authoritative record.
Click any figure to enlarge with its caption.
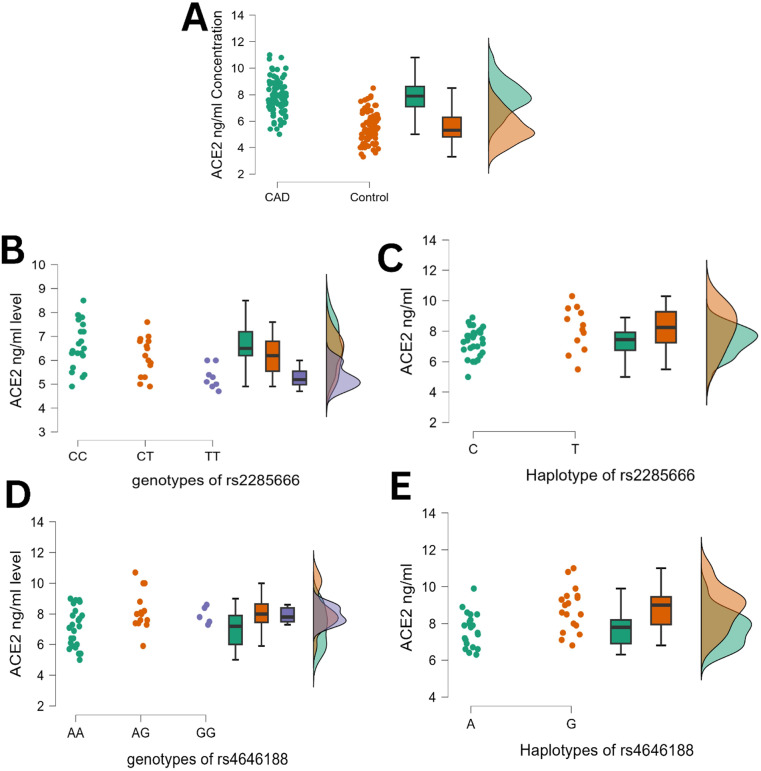 Fig. 1
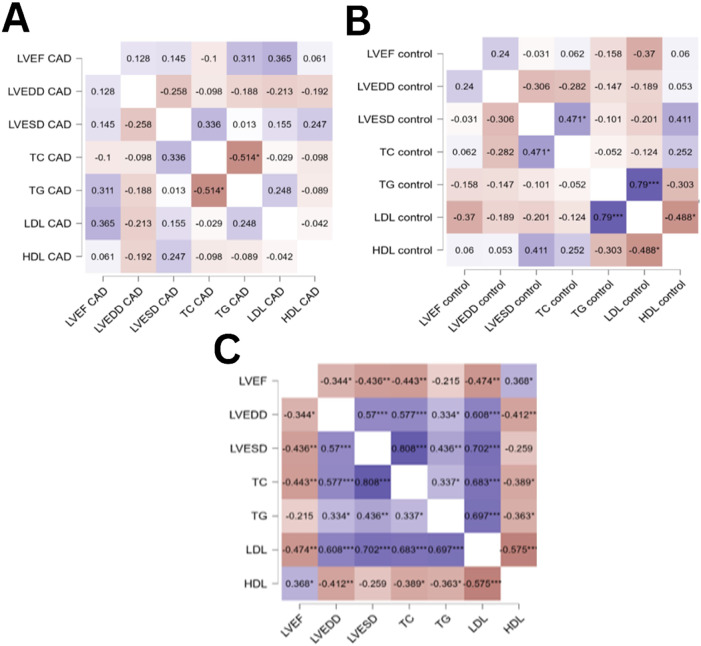 Fig. 2
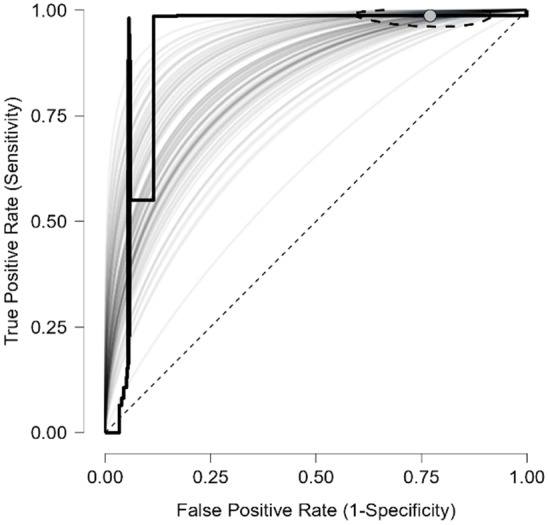 Fig. 3
| n (%) | |||
|---|---|---|---|
|
| |||
| Characteristic* | CAD (n = 85) | Control (n = 85) | |
| Mean age in years ± SD | 53.0 ± 8.7 | 45.7 ± 9.3 | 0.016 |
| Mean BMI in kg/m2 ± SD | 26.7 ± 3.8 | 25.02 ± 3.9 | 0.169 |
| Sex | >0.05 | ||
| Female | 45 (52.9) | 45 (52.9) | |
| Male | 40 (47.1) | 40 (47.1) | |
| Echocardiographic parameters | |||
| Median LVEF in % (IQR) | 55 (34–67) | 64 (58–69) | 0.001 |
| Mean LVEDD in mm ± SD | 50.2 ± 4.8 | 39.8 ± 3.4 | 0.001 |
| Median LVESD in mm (IQR) | 32.6 (26–44) | 22 (15–31) | <0.001 |
| Metabolic parameters | |||
| Mean triglyceride in mg/dL ± SD | 176.8 ± 34.9 | 137.1 ± 29.0 | <0.001 |
| Median total cholesterol in mg/dL (IQR) | 246.5 (180–379) | 122.7 (95.2–188.1) | <0.001 |
| Median LDL-C in mg/dL (IQR) | 256.1(151–295) | 71.1 (34.02–103.07) | <0.001 |
| Mean HDL-C in mg/dL ± SD | 46.1 ± 6.8 | 50.7 ± 5.6 | 0.028 |
| Mean HbA1C in % ± SD | 5.1 ± 0.8 | 5.3 ± 1 | 0.06 |
| Mean FPG in mg/dL ± SD | 90.5 ± 5.7 | 109 ± 6.4 | 0.09 |
| Medication | |||
| Statin | 55 (64.8) | ||
| Beta-blocker | 74 (87.1) | ||
| Aspirin | 80 (94.1) | ||
| n (%) | ||||||
|---|---|---|---|---|---|---|
|
| ||||||
| CAD | Control | OR (95% CI) | Overall's continuity-corrected | P/A fraction in population in % | ||
| rs2285666 intron 4 variants (G8790A) | ||||||
|
| ||||||
| C | 58 (64.4) | 71 (78.9) | Reference | |||
| T | 32 (35.6) | 19 (21.1) | 2.06 (1.06–4.00) | 0.047 | 0.032 | 18.3 |
| CC | 21 | 30 | Reference | |||
| CT | 16 | 11 | 1.7 (0.69–4.21) | 0.358 | 0.257 | 14.7 |
| TT | 8 | 4 | 2.22 (0.63–7.86) | 0.353 | 0.231 | 9.8 |
|
| ||||||
| C0 | 28 (70.0) | 35 (87.5) | Reference | |||
| T0 | 12 (30.0) | 5 (12.5) | 3 (0.96–9.39) | 0.099 | 0.05 | 20 |
|
| >0.05 | >0.05 | ||||
| rs4646188 intron 7 variants | ||||||
|
| ||||||
| A | 64 (71.1) | 75 (83.3) | Reference | |||
| G | 26 (28.9) | 15 (16.7) | 2.03 (0.99–4.15) | 0.075 | 0.05 | 14.7 |
| AA | 25 | 33 | Reference | |||
| AG | 14 | 9 | 1.81 (0.70–4.69) | 0.334 | 0.235 | 13.9 |
| GG | 6 | 3 | 2.15 (0.51–9.06) | 0.485 | 0.315 | 7.1 |
|
| ||||||
| A0 | 21 (52.5) | 30 (75.0) | Reference | |||
| G0 | 19 (47.5) | 10 (25.0) | 2.71 (1.07–6.92) | 0.062 | 0.038 | 30 |
|
| >0.05 | >0.05 | ||||
| TC within genotype/haplotype, n (%) | HDL within genotype/haplotype, n (%) | LDL within genotype/haplotype, n (%) | TG within genotype/haplotype, n (%) | |||||||||||||
|---|---|---|---|---|---|---|---|---|---|---|---|---|---|---|---|---|
|
|
|
|
| |||||||||||||
| <200 mg/dL | >200 mg/dL | OR (95% CI) | <60 mg/dL | >60 mg/dL | OR (95% CI) | <100 mg/dL | >100 mg/dL | OR (95% CI) | <150 mg/dL | >150 mg/dL | OR (95% CI) | |||||
| rs2285666 | ||||||||||||||||
|
| ||||||||||||||||
| CC | 34 (66.7) | 17 (33.3) | Reference | 14 (27.5) | 37 (72.5) | Reference | 30 (58.8) | 21 (41.2) | Reference | 36 (70.6) | 15 (29.4) | Reference | ||||
| CT+TT | 19 (48.7) | 20 (51.3) | 2.11 (0.90–4.91) | 0.130 | 15 (38.5) | 24 (61.5) | 0.61 (0.24–1.48) | 0.363 | 12 (30.8) | 27 (69.2) | 3.21 (1.35–7.67) | 0.006 | 17 (42.1) | 22 (57.9) | 3.11 (1.31–7.36) | 0.01 |
|
| ||||||||||||||||
| C0 | 41 (65.1) | 22 (34.9) | Reference | 22 (34.9) | 41 (65.1) | Reference | 34 (54) | 29 (46) | Reference | 48 (76.2) | 15 (23.8) | Reference | ||||
| T0 | 8 (47.1) | 9 (52.9) | 2.1 (0.72–6.11) | 0.262 | 9 (52.9) | 8 (47.1) | 0.47 (0.161–1.41) | 0.262 | 4 (23.5) | 13 (76.5) | 3.81 (1.14–12.77) | 0.018 | 11 (64.7) | 6 (35.3) | 1.75 (0.56–5.40) | 0.363 |
| rs4646188 | ||||||||||||||||
|
| ||||||||||||||||
| AA | 32 (55.2) | 26 (44.8) | Reference | 13 (22.4) | 45 (77.6) | Reference | 36 (62.1) | 22 (37.9) | Reference | 39 (68.4) | 18 (31.6) | Reference | ||||
| AG+GG | 18 (58.1) | 13 (41.9) | 0.89 (0.37–2.12) | 0.826 | 14 (43.8) | 18 (56.2) | 0.4 (0.146–0.93) | 0.054 | 27 (84.4) | 5 (15.6) | 0.3 (0.10–0.89) | 0.06 | 10 (31.2) | 22 (68.8) | 4.77 (1.89–11.99) | 0.001 |
|
| ||||||||||||||||
| A0 | 28 (54.9) | 23 (45.1) | Reference | 18 | 33 | Reference | 29 (56.9) | 22 (43.1) | Reference | 16 (37.2) | 27 (62.8) | Reference | ||||
| G0 | 9 (31) | 20 (69) | 2.65 (1.02–6.89) | 0.037 | 11 | 17 | 0.84 (0.32–2.18) | 0.809 | 9 (31) | 20 (69) | 2.93 (1.13–7.57) | 0.022 | 17 (58.6) | 12 (41.4) | 0.42 (0.16–1.08) | 0.094 |
Peer Reviews
No public reviews on file for this paper yet. If you reviewed it on a platform where reviews are public (OpenReview, ICLR, NeurIPS, ICML), you can paste yours below so the community can read it here.
Videos
No videos yet. Explain this paper in a talk, walkthrough, or lecture? Add one.
Taxonomy
TopicsParaoxonase enzyme and polymorphisms · Renin-Angiotensin System Studies · Adipokines, Inflammation, and Metabolic Diseases
1. Introduction
Coronary artery disease (CAD), a polygenic disorder that remains a major cause of death in countries with high and low incomes, is characterised by complicated interactions across various pathophysiological pathways with multiple genes and environmental risk factors.^1^ The second most common cause of mortality from cardiovascular disease is dyslipidaemia, which is known as abnormal elevated levels of one or more types of lipids in the blood. Dyslipidaemia is characterised by elevated levels of low-density lipoprotein (LDL) or triglycerides (TG) and a low concentration of high-density lipoprotein (HDL).^2^ Apart from established risk factors including age, gender, smoking, dyslipidaemia, hypertension, a family history of illness and diabetes mellitus (DM), new studies have demonstrated the significant contributions of genetic variants to the development of CAD. The renin-angiotensin-aldosterone system (RAAS) genes have drawn a lot of attention recently.^3^ Angiotensin converting enzyme 2 (ACE2) is a mono-carboxypeptidase that changes angiotensin II (Ang II) into angiotensin 1–7 (Ang 1–7) and is considered an important regulator of RAAS. By acting on the Mas receptor, ACE2 inhibits the detrimental effects of Ang II on cardiovascular damage and has significant cardiovascular protective properties.^4^ Recent investigations have revealed that ACE2 is immunoreactive in both cardiomyocytes and the endothelium and smooth muscle cells of the cardiac arteries, despite the fact that it was originally only found in the cardiac endothelial cells.^5^ With 20 introns and 18 exons, ACE2 spans 39.98 kb of genomic DNA and aligns to chromosome Xp22. However, little has been discovered about prevalent intronic variations and how they affect CAD across different global populations. A correlation between ACE2 expression levels and certain comorbidities has been demonstrated in prior studies; hyperglycaemia, for instance, raises ACE2 expression on the surface of monocytes. Additionally, smoking has been shown to increase the expression of ACE2 in pneumocytes and the small airway epithelium.^6^ Single nucleotide polymorphisms (SNPs) are common variants in the ACE2 genes that have been analysed and associated with an increased risk of several diseases. Introns make up the majority of ACE2 SNPs, which alter the receptor protein's expression level but not its structure.^7^ The SNP rs2285666 at the 4th base of the 3rd intron (C>T) is one of the most researched SNPs. It was proposed that this locus may modify messenger RNA (mRNA) splicing strategies, impacting the expression of the ACE2 gene and protein levels. The rs4646188 at the 7th intron (A>G) has been linked to elevated plasma levels of total cholesterol (TC), TG, LDL-cholesterol (LDL-C) and decreased HDL-C, as well as high blood pressure, cardiac hypertrophy or type-2 DM (T2DM).^8^ To the best of the authors' knowledge, there are no reports linking ACE2 SNPs to dyslipidaemia and CVD in the Iraqi population. Therefore, this study aimed to address that gap in the literature.
2. Methods
This case-control study was conducted at the Iraqi Center of Heart Disease, Baghdad, Iraq, from March to September 2023. Iraqi patients with CAD of either sex who were hospitalised for a computed tomography (CT) coronary angiography examination were included. Following CT coronary angiography, patients with significant narrowing (approximately 60% stenosis degree) in one or more coronary arteries were chosen one at a time. A single or multiple vascular condition was determined by the number of affected arteries (luminal narrowing ≥60%) in the three major coronary arteries (left anterior descending [LAD], left circumflex artery [LCx] and right coronary artery [RCA] and the patient was assessed for the angiographic degree of severity. Echocardiography was conducted using an ultrasound instrument to assess left ventricular ejection fraction (LVEF%, normal range >50%) and complementary assessments of the echocardiograph included LV systolic diameter and LV diastolic diameter. At recruitment, a medical questionnaire was utilized to gather self-documented data of each participant including age, gender, BMI, echocardiogram as well as status of hypertension and hyperlipidaemia. The medication information (statin, β-blocker and aspirin) was also obtained. Patients with autoimmune disease, congenital heart disease (CHD), renal and liver disfunction and malignant tumour were excluded. The control group contained participants of both sexes characterised with normal heart performance and no sign of CAD disorder, normal lipid level and were enrolled for routine clinical examination at the same period and hospital.
The power analysis for the sample size was done using JASP software version 0.19.3. A sample size of 85 patients with CAD and 85 healthy controls was determined (type I error rate α = 0.05, minimal effect size of interest Δ = 0.5).
Blood samples were collected from each participant after fasting for 12 hours. Serum levels of TC, TG and HDL were determined by standard method using a commercial kit (Biolabo/France). The Fried-Ewald equation was used to calculate the serum level of LDL-C. The normal range of serum levels of TC, TG, LDL and HDL were <200 mg/dl, <150 mg/dl, <100 mg/dl and ≥60 mg/dl, respectively. The European recommendations on cardiovascular disease prevention in clinical practice, which use LDL-C and TC readings to guide treatment, served as the basis for the definition of dyslipidaemia. LDL-C <100 mg/dL and TC <200 mg/dL were generally considered normal (non-dyslipidaemia). Patients were classified as having dyslipidaemia if they exceeded either criterion. The enzyme linked immunosorbent assay human kit (Invitrogen, Carlsbad, California, USA; Catalogue Number: EH489RB) was used to assess ACE2 levels.
DNA was isolated from blood samples using the Wizard Genomic DNA Purification Kit (Promega, Madison, Wisconsin, USA). Two SNPs located in the intronic region of the ACE2 gene (C>T, rs2285666) and (A>G, rs4646188) were genotyped using the current design of TaqMan probes for allelic discrimination by direct real-time PCR technique of one step (Cepheid smart cycle/USA). In the present study, two primers and probe sequences were prepared by Alpha DNA Ltd. (Canada). For rs2285666, the primers were forward: -5 GAGCATCTATGTGTTGAAACACA-3 and reverse: 5-CTAAATACAATGAGCACCATC-3; the C- and T-allele-specific (Fam and Vic) probe was 5-TTAGTAGCC/TTACC-3. For rs4646188, the primers were forward: 5-TAGAAATATGATTAGATATTCTAC-3 and reverse: 5-TCTCTGTGTTCCCTTCTGTTGA-3; the A- and G-allele-specific (Fam and Vic) probe was 5-GAATGA/GACAAATA-3. The recommended cycling conditions were step 1: initial denaturation at 95 °C for 10 minutes, repeated for 1 cycle; step 2: denaturation at 94 °C for 30 seconds; annealing at 59 °C for 35s, extension at 72 °C for 30 seconds, repeated over 5 cycles and final extension at 72 °C for 20 seconds; step 3 (Fam and Vic were added): denaturation at 94 °C for 20 seconds; annealing at 58 °C for 30 seconds, extension at 72 °C for 20 seconds and final extension at 72 °C for 20 seconds, repeated over 35 cycles.
Continuous variables were assessed for normality using the Kolmogorov-Smirnov and Shapiro-Wilk tests. Parametrically distributed variables (age, BMI, LVEDD, TG, HDL, HbA1c, FBG and ACE2 level) are presented as mean ± standard deviation and were compared using the independent samples t-test. Non-parametric variables (LVEF, LVESD, TC and LDL) are expressed as median and interquartile range (IQR), with comparisons performed using the Mann-Whitney U test. A classical ANOVA was used to compare ACE2 levels across different genotypes. Categorical variables are summarised as number and percentage. For the ACE2 gene, located on the X-chromosome, Hardy-Weinberg Equilibrium (HWE) was evaluated in the female cohort only using Chi-square analysis. The same test was used to assess the association between ACE2 SNPs and CAD severity. The risk of CAD development associated with each ACE2 SNP was quantified by calculating odds ratios (OR) with 95% confidence intervals (CI). A Fisher's exact test (two-tailed) was used to determine statistical significance, with a P value <0.05 considered statistically significant. The relationship between each SNP and categorical lipid variables (TC, HDL, LDL, TG) was similarly analysed using ORs, 95% CIs and Fisher's exact test. Correlations between cardiometabolic risk factors were evaluated using Spearman's rank correlation coefficient, a non-parametric method. All analyses were conducted using Statistical Package for Social Sciences (SPSS) software, Version 20 (IBM Corp., Armonk, New York, USA) and JASP, Version 0.19.3.
3. Results
A total of 85 patients with CAD were included (45 females and 40 males); the control group consisted of 85 participants (45 females and 40 males). The mean age of the CAD and control groups was significantly different (53.0 ± 8.7 versus 45.7 ± 9.3 years; P = 0.016), while gender and BMI showed no statistically significant differences (P >0.05). Based on echocardiography, cardiovascular factors such as LVEF% (median [IQR]: 55 [34–67] versus 64 [58–69]; P = 0.001), LV end diastolic diameter (LVEDD; 50.2 ± 4.8 versus 39.8 ± 3.4; P = 0.001) and LV end systolic diameter (LVESD; median [IQR]: 32.6 [26–44] versus 22 [15–31]; P = 0.001) were significantly different when comparing the CAD and control group. Compared with the control group, CAD patients had elevated levels of lipid profile (TC, TG and LDL-C; P <0.001 each) and lower HDL levels (P = 0.028) with significant differences except for fasting plasma glucose (P >0.05) [Table 1].
As the ACE2 gene is located on the X-chromosome, the data were analysed separately for each sex. It was found the results were consistent with HWE in CAD patients and control groups, and there were no significant differences between observed and expected results; this was assessed only for females. Moreover, the T-allele of rs2285666 in females had a significant association with CAD and higher prevalent frequency in the CAD group than in the female control group (32 versus 19; P = 0.047); this significant difference was maintained after correction (P = 0.032). The G-allele of rs4646188 was found to be significant after correction in females (P = 0.05). The data also identified the G-allele of rs4646188 in males as having a significant relationship with CAD after correction (P = 0.038) [Table 2].
A significant association was observed in the elevated level of TC in the G-allele of rs4646188 in male subjects (OR = 2.65; P = 0.037). On the other hand, the CT+TT (OR = 3.21; P = 0.006) in females and the T-allele in males (OR = 3.81; P = 0.018) of ACE2 SNP rs2285666, in addition, the G-allele in males of ACE2 SNP rs4646188 (OR = 2.93; P = 0.022) were associated with a significant increased level of LDL. The association between ACE2 SNPs and the level of TG showed that the CT+TT of rs2285666 (OR = 3.11; P = 0.01) and AG+ GG of rs4646188 (OR = 4.77; P = 0.001) in female subjects were associated with the elevated level of TG [Table 3]. Regarding to the concentration of ACE2, observations showed a significant elevated level of ACE2 in the CAD group compared to the control group (7.8 ± 1.27 versus 5.5 ± 1.1 ng/mL). Overall, the findings showed the serum level of ACE2 according to the genotype and haplotype of studied SNPs; the elevated levels were seen in CC genotype (6.63 ± 0.95 ng/mL) and CT genotype (6.17 ± 0.80 ng/mL) compared with the TT genotype (5.3 ± 0.48 ng/mL). In the male haplotype, the concentration level of ACE2 was significantly increased in the T-allele (8.15 ± 1.43 ng/mL) compared to the C-allele (7.30 ± 0.93 ng/mL). The ACE2 level of rs4646188 genotypes revealed a significant elevated level in the AG genotype (8.21 ± 1.27 ng/mL) compared to the AA genotype (7.11 ± 1.24 ng/mL) and a non-significant difference with the GG genotype (7.92 ± 0.56 ng/mL). ACE2 level was stratified according to male haplotype and showed the G-allele had a significantly higher serum level of ACE2 (8.79 ± 1.1 ng/mL) [Fig. 1].
Raincloud plots showing (A) ACE2 concentration between patients with coronary artery disease (CAD) and the control group, (B) ACE2 concentration among rs2285666 genotypes of CAD female subjects, (C) ACE2 concentration between C and T haplotype of rs2285666 of CAD male subjects, (D) ACE2 concentration among rs4646188 genotypes of CAD female subjects and (E) ACE2 concentration between A and G haplotype of rs4646188 of CAD male subjects.
A Spearman correlation between echocardiographic and lipid profile parameters revealed that, in the CAD group, no significant correlation was found between parameters but both TC and TG showed negatively correlation (r = –0.514; P <0.05). In the control group, the LVESD was significant positively correlated with TC (r = 0.471; P <0.05). A strong positive correlation of LDL and TG (r = 0.79; P <0.001) and negative correlation of LDL and HDL (r = –0.488; P <0.05) were found. Further analysis was performed in combined group to prevent the impact of sample size. However, LVEF demonstrated negative correlation with LVEDD (r = –0.344; P <0.05), LVESD (r = –0.436; P <0.01), TC (r = –0.443; P = 0.01) and LDL (r = –0.474; P <0.01), while a positive correlation was observed with HDL (r = 0.368; P <0.05). In contrast, the LVEDD showed a positive association with LVESD (r = 0.57; P <0.001), TC (r = 0.577; P <0.001), TG (r = 0.334; P <0.05) and LDL (r = 0.608; P <0.001) and was negatively associated with HDL (r = –0.412; P<0.01). LVESD was positively correlated with TC (r = 0.808; P <0.001), TG (r = 0.436; P <0.01) and LDL (r = 0.702; P < 0.001). TC was correlated with TG (r = 0.337; P <0.05), LDL (r = 0.683; P < 0.001) and HDL (r = 0.389; P < 0.05). LDL showed a strong negative association with HDL (r = –0.575; P <0.001) [Fig. 2].
*Spearman's heatmap correlation analysis of cardiometabolic risk factors in patients with (A) coronary artery disease, (B) the control group and (C) both groups combined.LVEF = left ventricular ejection fraction; LVEDD = left ventricular end diastolic diameter; LVESD = left ventricular end systolic diameter; LDL = low-density lipoprotein; HDL = high-density lipoprotein. The correlation coefficient (r2) is represented by values inside squares. Blue boxes indicate positive correlation while red boxes indicate negative correlation.*P <0.05, **P <0.01, **P <0.001
The receiving operating characteristic curve indicated the diagnostic value of ACE2. The accuracy was 0.842 ± 0.027 (sensitivity = 0.987, specificity = 0.230, cut-off value = 6.25ng/mL) and the result was significant (P = 0.002) [Fig. 3].
Receiving operating characteristic curve to evaluate the diagnostic indicator of ACE2 serum level.
Of the parameters that differed significantly between the CAD and control groups, receiver operating characteristic analysis revealed excellent diagnostic performance: LVEDD (area under the curve [AUC] = 0.91) and LVESD (AUC = 0.84) were identified as strong diagnostic indicators for CAD. Indicator of reduced function: LVEF also showed diagnostic value (AUC = 0.82), but its inverse association confirms the presence of reduced systolic function in the CAD group. Of the metabolic parameters analysed, TC and LDL-C were the most accurate predictors with AUCs of 0.91 and 0.90, respectively. TG also showed high diagnostic value (AUC = 0.86). HDL-C demonstrated a weaker, inverse relationship (AUC = 0.77). The corresponding sensitivity and specificity values were as follows: TC: sensitivity 88%, specificity 84%; LDL-C: sensitivity 90%, specificity 82%; TG: sensitivity 85%, specificity 80%; HDL-C (inverse relationship): sensitivity 76%, specificity 70%.
4. Discussion
Although several prior studies focused on the association between SNPs of ACE2 and cardiovascular disease, ACE2 gene variants in the Iraqi population with CAD and complications of dyslipidaemia using case-control study design had not been examined. This study found that LVEF%, LVEDD, LVESD, lipids and glucose homeostasis can be significant risk factors in CAD patients (P <0.05); these results could aid in identifying the risk category for the possibility of CAD susceptibility. The results were consistent with previous studies performed in Egyptian CAD patients.^9^ While assessing the pleiotropic functions of ACE2, it seems that the ACE2 performs a crucial role in diabetes by modulating glucose homeostasis in tissue specific manner.^10^
Several studies investigated the association between the severity of CAD and ACE2, indicating that the plasma level of ACE2 is useful in predicting CAD.^11^ In humans, genetic polymorphisms of the ACE2 gene are linked with the susceptible development of pathological myocardial hypertrophy and cardiac disease or may affect the structure of the cardiac muscle. According to earlier research, intronic polymorphisms may influence gene expression and play a role in the pathophysiology of a number of complicated conditions.^12^ Regretfully, the current study focused on only two ACE2 gene variants found in introns (rs2285666 and rs4646188).
In the current study, genotype frequencies of the two SNPs were not significantly different when comparing the CAD and control group. However, the T-allele of rs2285666 showed higher frequency in female (corrected P = 0.032) and male (corrected P = 0.05) CAD patients compared to the control group. Intrinsically, the G-allele frequency of rs4646188 also showed significant differences with increased risk of CAD in both female (corrected P = 0.05) and male (corrected P = 0.038) patients versus controls. Many studies observed associations between ACE2 SNPs and CAD; Patel et al.'s study found that the ACE2 SNPs, including rs4646188, were linked to Australian Caucasian individuals' risk of diabetes-related hypertension.^13^
In a meta-analysis by Lu et al. consisting of 7,251 patients with hypertension, there was a documented association between the AA genotype of rs2285666 and hypertension in females only.^14^ Indeed, Lui et al. also reported the rs4646188 SNP was associated not only with high-risk development of T2DM but also with the risk of dyslipidaemia, hypertension and lower LVEF of Uygur patients with T2DM.^15^ Considerable results by another study by Lui et al. indicated that rs4646188 was linked to an elevated risk of arterial fibrillation (AF) and cardioembolic stroke among diabetic patients in the Uygur population.^16^ In the same study, the results confirmed that the TT genotypes of rs4646188 correlated with a significant increase of left atrial end-systolic diameter in diabetic patients. But the study by Wang et al. suggested that the rs2285666 SNP did have a significant impact between AF patients and controls in Chinese male patients.^17^ Data supported by Luo et al. showed a high linkage of (TT+CT) genotypes of rs4646188 to the development risk of hypertension; TT+CT genotypes of rs2285666 were associated with essential hypertension (EH) of non-carotid arteriosclerosis stenosis (CAS) ≥50% compared with CAS ≥50% which influences stroke complications.^18^
Comparable outcomes were also observed for the ACE2 SNP rs2285666, which was correlated with elevated high blood pressure and stroke in northern Han Chinese but had lower effects on T2DM and AF.^19^ Yang et al.'s study showed that the myocardial infarction (MI) was linked to ACE2 polymorphisms (rs1978124, rs2285666 and rs4646142) and the results of the association study with female individuals showed that the AA genotype of rs2285666 was linked with MI at a non-significant level.^20^ Regard the findings of Niu et al. in the Han population of northern China, the C-allele of rs2285666 polymorphism in male carriers and the CC genotype in female carriers had been shown to have an association with essential hypertension.^21^ An additional investigation into orthostatic blood pressure responses in 3,630 Chinese Han participants revealed no correlation with the rs2285666 SNP.^22^ Research from two Chinese studies demonstrated a significant relationship between the rs2285666 single nucleotide polymorphism and hypertension specifically in women;^2324^ an association between the A-allele and elevated blood pressure was reported in one study and a separate investigation found a significant association for the GG genotype with high diastolic blood pressure. Further analysis found no correlation of the thickness of the septal wall and left ventricular mass with rs2285666 in German males.^25^
Among men with T2DM, A-allele carriers of the rs2285666 SNP exhibited reduced interventricular septal thickness and left ventricular mass at the end of diastole relative to those with the G-allele.^26^ A significant association was found between three specific ACE2 gene polymorphisms (SNPs: rs2074192, rs2285666 and rs2106809) and pulmonary circulation haemodynamic parameters (PAP). In female patients with CHD, carrying specific genetic haplotypes (CCA and CCG) was linked to a significantly lower risk of developing elevated PAP.^27^
Lipid disorder is the second most common risk factor for cardiovascular disease-caused death. The current study investigated the distribution of alleles and genotypes of ACE2 SNPs according to lipid levels in all participants. The findings showed a significant association between G-allele of s4646188 in males and a higher level of TC >200 mg/dL. Thus, the data showed a significant increase in the level of HDL in the AG+GG of rs4646188 in females. The significant elevated levels of LDL were shown in CT+TT in females and the T-allele in males of the rs2285666 SNP, as well as in the G-allele of rs4646188 in males. Furthermore, statistical differences were found between <150 and >150 mg/dL of TG in CT+TT of rs2285666 and AG+GG of rs4646188 in females. Xu et al.'s study was unable to identify any meaningful correlation between T2DM in either males or females with or without dyslipidaemia and rs2285666 SNP.^28^ According to Pan et al., specific genetic variations in the ACE2 gene (rs2285666 and rs4646188) are linked to dyslipidaemia, manifesting as lower HDL levels or combined lipid abnormalities; these polymorphisms were also associated with an increased risk of ischaemic stroke.^29^ While Lu et al. found that rs4646188 had a significant association with three types of dyslipidaemia (HDL, TC and LDL) at the P <0.05 level.^14^ Subsequent analysis indicated a differential association between the investigated SNPs and CAD severity.
In the current study, a significant correlation was identified specifically for the rs2285666 variant (P = 0.006), whereas other polymorphisms showed no clear link. This underscores the potential importance of the ACE2 pathway in cardiovascular disease, a system in which plasma activity is markedly increased during myocardial infarction and heart failure.^30^ However, the results observed the high level of ACE2 in CAD compared to the control group (7.8 ± 1.27 ng/mL versus 5.5 ± 1.1 ng/mL). Narula et al.'s study found a correlation between elevated levels of ACE2 and increased risk for diabetes, cardiac incidents and overall death.^31^ In addition, ACE2 expression can be increased by angiotensin receptor blockers and ACE inhibitors. Besides, the current study's evidence showed elevated level of ACE2 in CC genotype (6.63 ± 0.95 ng/mL) and CT genotype (6.17 ± 0.80 ng/mL) of rs2285666, in contrast, the T-allele had a higher level of ACE2 than G-allele in male subjects. In response to rs4646188 SNP, the elevated level was shown in AG genotype (8.21 ± 1.27 ng/mL) of females group and G-allele of males group (8.79 ± 1.1 ng/mL). Genetic variation in ACE2, particularly the intronic polymorphisms rs2285666 and rs4646188, can impact gene expression through post-transcriptional mechanisms such as mRNA splicing and stability. Altered ACE2 expression subsequently affects the balance of the RAAS. This provides a potential genetic basis for the cardioprotective phenotype often observed in women, which exists alongside distinct hormonal regulatory pathways.^32^ Asselta et al. reported that substitution of C for T increased the strength of the splice site in 9.2% resulting in a higher expression of the ACE2 protein.^33^ Correlation analysis confirmed the relationship between cardiometabolic variables in the current study; the group combination demonstrated a strong positive and negative association. This study was subject to certain limitations. First, the small sample size may impact the results' adaptability. Second, only from Iraqi participants were included which can limit the generalisability. Finally, gender differences may impact significantly on the study of ACE2 polymorphisms due to genetics and hormonal factors.
5. Conclusion
This study found that either rs2285666 or rs4646188 are a potential risk genetic marker of CAD in females and males in the presence of the T- and G-allele. According to these findings, individuals with CAD who would benefit from enhanced prevention of disease could be identified through genetic screening for these SNPs. The effects of these SNPs are influenced by dyslipidaemia status.
Authors' Contribution
Shaimaa Y. Abdulfattah: Methodology, Formal analysis, Conceptualization, Data curation, Writing, Original draft preparation, Review and editing. Sumaya Saady: Methodology, Software, Conceptualization.
Acknowledgment
We extend our sincere gratitude to all participants who made this study possible. We also acknowledge the dedicated efforts of the medical laboratory staff at the Iraqi Center of Heart Disease, Baghdad, Iraq, for their assistance in sample collection and data acquisition.
Ethics Statement
Approval of this case-control study was granted by the Ethics Committee of the Biotechnology Research Center/Al-Nahrain University with Reference number (M.B.2) and informed consent was obtained from all participants.
Conflict of Interest
The authors declare no conflicts of interest.
Funding
No funding was received for this study.
Data Availability
Data are available upon reasonable request from the corresponding author.
The reference list from the paper itself. Each links out to its DOI / PubMed record.
- 1Abdulfattah SY Al-Awadi SJ Al-Saffar HB. Plasma oxidized low-density lipoprotein level and mi RNA-146a gene expression, as a strong predictor for atherosclerotic coronary artery disease and its associated response to atorvastatin in a sample of the Iraqi population. Gene Rep 2020; 18:100563. https://doi.org/10.1016/j.genrep.2019.100563.10.1016/j.genrep.2019.100563 · doi ↗
- 2Yuan Y Chen W Luo L Xu C. Dyslipidemia: Causes, symptoms and treatment. IJSRD 2021; 5:1013–16. 10.31142/ijtsrd 38374. · doi ↗
- 3Jiang F Yang J Zhang Y Dong M Wang S Zhang Q Angiotensin-converting enzyme 2 and angiotensin 1–7: novel therapeutic targets. Nat Rev Cardiol 2014; 11:413–26. https://doi.org/10.1038/nrcardio.2014.59.10.1038/nrcardio.2014.5924776703 PMC 7097196 · doi ↗ · pubmed ↗
- 4Burrell LM Risvanis J Kubota E Dean RG Mac Donald PS Lu S Myocardial infarction increases ACE 2 expression in rat and humans. Eur Heart J 2005; 26:369–75. https://doi.org/10.1093/eurheartj/ehi 114.10.1093/eurheartj/ehi 11415671045 · doi ↗ · pubmed ↗
- 5Brake SJ Barnsley K Lu W Mc Alinden KD Eapen MS Sohal SS Smoking upregulates angiotensin-converting enzyme-2 receptor: a potential adhesion site for novel coronavirus SARS-Co V-2 (Covid-19). J Clin Med 2020; 9:841. https://doi.org/10.3390/jcm 9030841.10.3390/jcm 903084132244852 PMC 7141517 · doi ↗ · pubmed ↗
- 6Paniri A Hosseini MM Moballegh-Eslam M Akhavan-Niaki H. Comprehensive in silico identification of impacts of ACE 2 SN Ps on COVID-19 susceptibility in different populations. Gene Rep 2021; 22:100979. https://doi.org/10.1016/j.genrep.2020.100979.10.1016/j.genrep.2020.10097933294728 PMC 7716747 · doi ↗ · pubmed ↗
- 7Karakaş Çelik SÇakmak Genç G Pişkin NAçikgöz B Altinsoy B Kurucu Işsiz B Polymorphisms of ACE (I/D) and ACE 2 receptor gene (Rs 2106809, Rs 2285666) are not related to the clinical course of COVID-19: A case study. J Med Virol 2021; 93:5947–52. 10.1002/jmv.27160.34170561 PMC 8426884 · doi ↗ · pubmed ↗
- 8Lumpuy-Castillo J Vales-Villamarín C Mahíllo-Fernández IPérez-Nadador I Soriano-Guillén L Lorenzo O Association of ACE 2 polymorphisms and derived haplotypes with obesity and hyperlipidemia in female Spanish adolescents. Front Cardiovasc Med 2022; 9:888830. https://doi.org/10.3389/fcvm.2022.888830.10.3389/fcvm.2022.88883035586646 PMC 9108422 · doi ↗ · pubmed ↗