Antimicrobial Resistance Patterns and Cumulative Antibiogram of Clinically Significant Bacteria From a Tertiary Hospital in Indonesia
Rika Bur, Muhammad Alifian Remifta Putra, Nelly Puspandari, Syukrini Bahri, Evi Yuliana, Nadya Rashita Valentina Barus, Astari Arum Sari, Talitha Dhia Fairuza

TL;DR
This study presents an antibiogram from an Indonesian hospital, showing high resistance in bacteria like Klebsiella and Acinetobacter, stressing the need for better antibiotic use.
Contribution
The paper provides a detailed, stratified cumulative antibiogram from a tertiary hospital in Indonesia, highlighting local AMR patterns.
Findings
Klebsiella pneumoniae showed high multidrug resistance, with low susceptibility to third-generation cephalosporins.
Acinetobacter baumannii was only susceptible to amikacin and trimethoprim–sulfamethoxazole in respiratory and ICU isolates.
Escherichia coli from urine remained largely susceptible to several antibiotics, including meropenem and amikacin.
Abstract
Antimicrobial resistance (AMR) is a critical global health threat, with disproportionately high burdens in low‐ and middle‐income countries. In Indonesia, where antimicrobial stewardship initiatives are still developing, local antibiograms are scarce yet crucial to guide evidence‐based empirical therapy. We conducted a retrospective descriptive study of cumulative antibiogram data from YARSI Hospital, a tertiary care academic hospital in Jakarta, Indonesia, covering January–December 2024. Analysis followed Clinical and Laboratory Standards Institute (CLSI) M39‐A4 guidelines and was restricted to the first clinical isolate per species, patient, and specimen type. Susceptibility data were stratified by Gram classification, specimen source, and care setting, with semester‐wise comparisons (January–June vs. July–December). Among 1782 clinical specimens, Klebsiella pneumoniae predominated…
Genes, proteins, chemicals, diseases, species, mutations and cell lines named across the full text — each resolved to its canonical identifier and authoritative record.
Click any figure to enlarge with its caption.
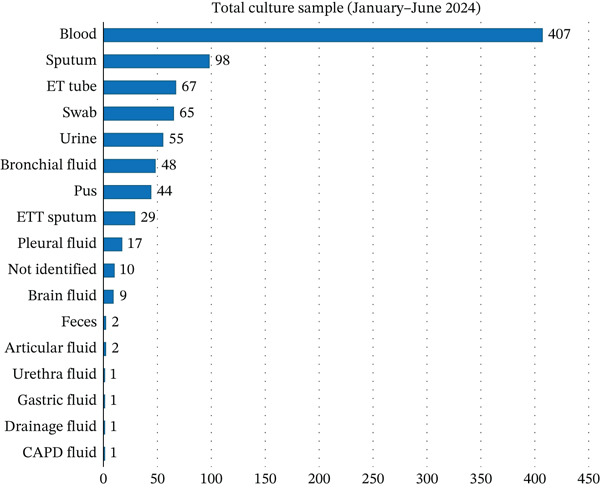 Figure 1
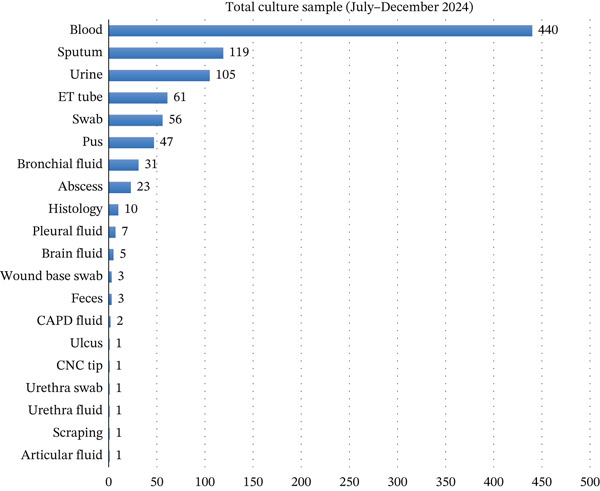 Figure 2
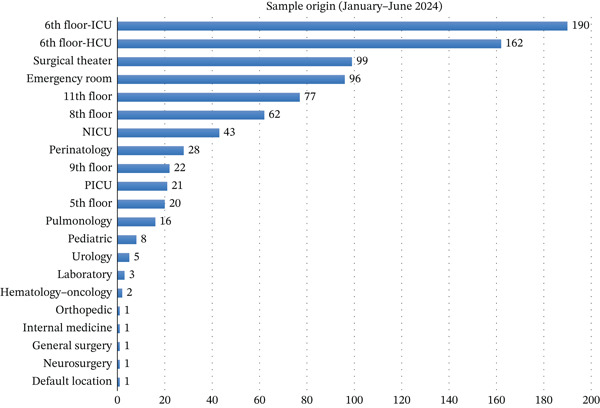 Figure 3
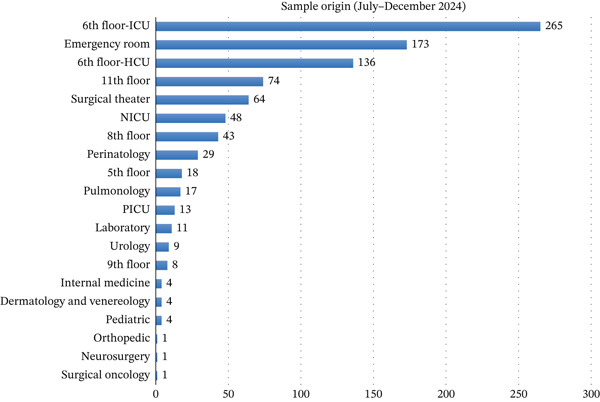 Figure 4
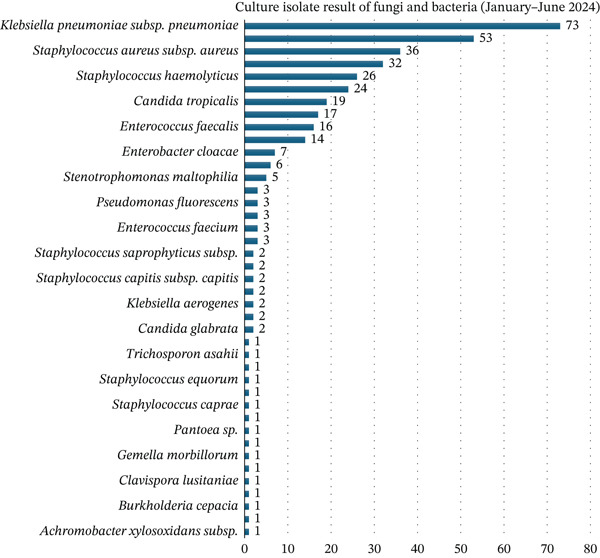 Figure 5
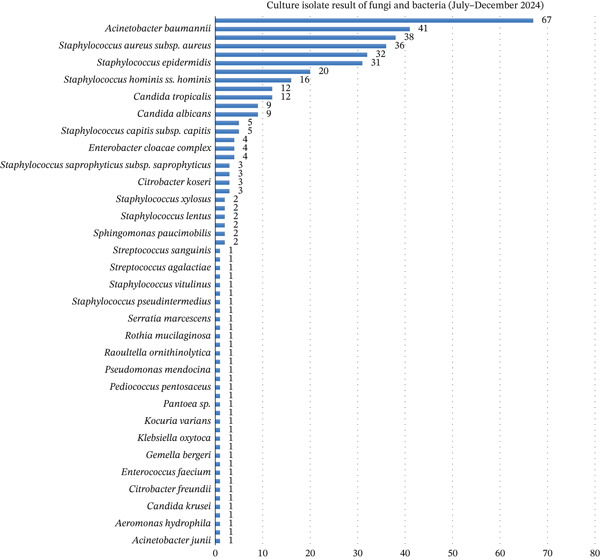 Figure 6
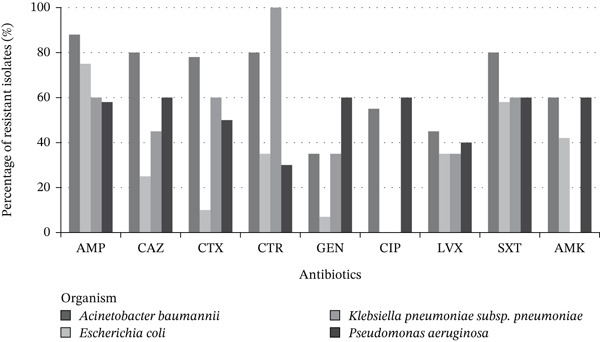 Figure 7
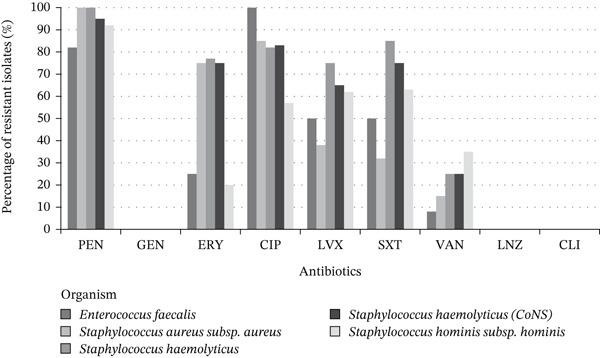 Figure 8
| Bacteria |
| CTX | CTR | CAZ | FEP | AMC | SAM | IPM | MEM | GEN | AMK | CIP | LVX | SXT |
|---|---|---|---|---|---|---|---|---|---|---|---|---|---|---|
|
| 23 | 4.30 | 21.70 | 39.10 | 4.30 | 65.20 | 21.70 | 56.50 | 1.40 | 65.20 | ||||
|
| 5 | 40 | 40 | 40 | 60 | 40 | ||||||||
|
| 4 | 25 | 25 | 25 | 25 | 25 | 75 | 75 | 25 | 50 | ||||
|
| 3 | 33.70 | 66.70 | 100 | 100 | 100 | 66.70 | 100 | 33.30 | 66.70 | ||||
|
| 2 | 0 | 0 | 0 | 0 | 100 | 0 | 50 | 0 | 50 | ||||
| Other Gram‐negative bacteria | 2 | 100 (1) | 100 (1) | 100 (1) | 0 (1) | 100 (1) | 100 (1) | 100 (1) | 100 (1) | 100 |
| Bacteria |
| CTX | CTR | CAZ | FEP | AMC | SAM | IPM | MEM | GEN | AMK | CIP | LVX | SXT |
|---|---|---|---|---|---|---|---|---|---|---|---|---|---|---|
|
| 24 | 41.70 | 16.70 | 58.30 | 0 | 66.70 | 12.50 | 66.70 | 83.30 | 66.70 | ||||
|
| 6 | 0 | 16.70 | 16.70 | 16.70 | 16.70 | 16.70 | 33.30 | 16.70 | 33.30 | ||||
|
| 6 | 16.70 | 83.30 | 83.30 | 33.30 | 83.30 | 50 | 100 | 50 | 50 | ||||
|
| 3 | 100 | 100 | 100 | 100 | 100 | ||||||||
| Other Gram‐negative bacteria | 5 | 20 | 20 | 50 (4) | 40 | 80 | 40 | 60 | 25 (4) | 0 |
| Bacteria |
| CTX | CTR | CAZ | FEP | AMC | SAM | IPM | MEM | GEN | AMK | CIP | LVX | SXT | FOS |
|---|---|---|---|---|---|---|---|---|---|---|---|---|---|---|---|
|
| 9 | 22.20 | 88.90 | 88.90 | 44.40 | 100 | 33.30 | 100 | 44.40 | 55.60 | |||||
|
| 4 | 0 | 0 | 50 | 0 | 100 | 0 | 74 | 0 | 0 |
| Bacteria |
| CTX | CTR | CAZ | FEP | AMC | SAM | IPM | MEM | GEN | AMK | CIP | LVX | SXT | FOS |
|---|---|---|---|---|---|---|---|---|---|---|---|---|---|---|---|
|
| 14 | 21.40 | 64.30 | 75 | 35.70 | 92.90 | 64.30 | 92.90 | 42.90 | 64.30 | |||||
|
| 4 | 0 | 0 | 0 | 0 | 75 | 0 | 25 | 0 | 50 | |||||
|
| 3 | 66.70 | 66.70 | 66.7 | 33.30 | 66.70 | |||||||||
|
| 2 | 50 | 100 | 100 | 100 | 100 | 50 | 100 | 50 | 50 | |||||
| Other Gram‐negative bacteria | 4 | 33.30 (3) | 33.30 (3) | 33.30 (3) | 0 (1) | 33.30 (3) | 33.30 (3) | 33.30 (3) | 33.30 (3) | 50 |
| Bacteria |
| CTX | CTR | CAZ | FEP | AMC | SAM | IPM | MEM | GEN | AMK | CIP | LVX | SXT |
|---|---|---|---|---|---|---|---|---|---|---|---|---|---|---|
|
| 33 | 0 | 6.10 | 6.10 | 6.10 | 6.10 | 12.10 | 78.80 | 6.10 | 57.60 | ||||
|
| 22 | 0 | 4.50 | 0 (21) | 13.60 | 0 | 31.80 | 50 | 27.30 | 63.60 | ||||
|
| 13 | 38.50 | 30.80 | 30.80 | 38.50 | 38.50 | ||||||||
|
| 8 | 0 | 25 | 75 | 25 | 87.50 | 25 | 100 | 12.50 | 50 | ||||
|
| 3 | 0 | 0 | 0 | 100 | 66.70 | 100 | 0 | 0 | |||||
| Other Gram‐negative bacteria | 8 | 0 (4) | 25 (4) | 100 (3) | 0 (3) | 100 (4) | 75 (4) | 75 (4) | 50 (4) | 57.10 (7) |
| Bacteria |
| CTX | CTR | CAZ | FEP | AMC | SAM | IPM | MEM | GEN | AMK | CIP | LVX | SXT |
|---|---|---|---|---|---|---|---|---|---|---|---|---|---|---|
|
| 19 | 0 | 22.2 (18) | 21.10 | 26.30 | 33.30 (18) | 21.10 | 94.70 | 22.20 (18) | 78.90 | ||||
|
| 13 | 7.70 | 15.40 | 25 (12) | 15.40 | 38.50 | 23.10 | 30.80 | 7.70 | 84.60 | ||||
|
| 10 | 20 | 30 | 20 | 20 | 20 | ||||||||
|
| 5 | 0 | 40 | 75 (4) | 20 | 100 | 80 | 100 | 40 | 60 | ||||
|
| 2 | 100 | 100 | 100 | 0 | 100 | 100 | 100 | 100 | 100 | ||||
| Other Gram‐negative bacteria | 7 | 40 (5) | 40 (5) | 60 (5) | 33.30 (3) | 80 (5) | 40 (5) | 80 (5) | 40 (5) | 42.90 |
| Bacteria |
| CTX | CTR | CAZ | FEP | AMC | SAM | IPM | MEM | GEN | AMK | CIP | LVX | SXT |
|---|---|---|---|---|---|---|---|---|---|---|---|---|---|---|
|
| 31 | 0 | 0 | 3.20 | 6.50 | 0 | 6.50 | 71 | 3.20 | 51.60 | ||||
|
| 20 | 5 | 15 | 35 | 15 | 45 | 35 | 45 | 25 | 75 | ||||
|
| 8 | 50 | 50 | 50 | 50 | 50 | ||||||||
|
| 4 | 0 | 25 | 25 | 0 | 75 | 25 | 100 | 25 | 50 | ||||
|
| 2 | 0 | 0 | 0 (1) | 0 | 100 | 0 | 50 | 0 | 50 | ||||
| Other Gram‐negative bacteria | 5 | 0 (1) | 0 (1) | 0 (1) | 0 (1) | 0 (1) | 0 (1) | 0 (2) | 0 (3) |
| Bacteria |
| CTX | CTR | CAZ | FEP | AMC | SAM | IPM | MEM | GEN | AMK | CIP | LVX | SXT |
|---|---|---|---|---|---|---|---|---|---|---|---|---|---|---|
|
| 30 | 0 | 17.20 (29) | 16.70 | 20 | 24.10 (29) | 16.70 | 76.70 | 13.80 (29) | 63.30 | ||||
|
| 28 | 0 | 14.30 | 32.10 | 14.30 | 28.60 | 14.30 | 32.10 | 7.10 | 78.60 | ||||
|
| 17 | 41.20 | 41.20 | 41.20 | 35.30 | 41.20 | ||||||||
|
| 5 | 0 | 80 | 80 | 20 | 100 | 40 | 100 | 20 | 20 | ||||
|
| 2 | 100 | 100 | 100 | 50 | 100 | 100 | 100 | 100 | 100 | ||||
| Other Gram‐negative bacteria | 7 | 0 (5) | 0 (5) | 40 (5) | 33.30 (3) | 60 (5) | 40 (5) | 80 (5) | 20 (5) | 57.10 |
| Bacteria |
| PEN | AMP | GEN | ERY | CIP | LVX | CLI | SXT | VAN | LNZ |
|---|---|---|---|---|---|---|---|---|---|---|---|
|
| 13 | 0 | 100 | 23.10 | 61.50 | 61.50 | 69.20 | 100 | 100 | ||
|
| 12 | 100 | 100 | 0 | 50 | 50 | 100 | 100 | |||
|
| 12 | 0 | 25 | 16.70 | 25 | 25 | 75 | 100 | 100 | ||
|
| 11 | 18.20 | 63.60 | 90.90 | 45.50 | 54.50 | 90.90 | 100 | 100 | ||
|
| 11 | 0 (10) | 60 (10) | 30 (10) | 30 (10) | 30 (10) | 30 (10) | 100 (10) | 100 (10) | ||
| Other Gram‐positive bacteria | 12 | 0 (6) | 50 (2) | 100 (4) | 50 (6) | 50 (6) | 50 (6) | 100 (4) | 100 (6) | 100 (6) |
| Bacteria |
| PEN | AMP | GEN | ERY | CIP | LVX | CLI | SXT | VAN | LNZ |
|---|---|---|---|---|---|---|---|---|---|---|---|
|
| 22 | 4.50 | 22.70 | 18.20 | 18.20 | 18.20 | 27.30 | 100 | 100 | ||
|
| 14 | 14.30 | 85.70 | 85.70 | 78.60 | 78.60 | 92.90 | 100 | 100 | ||
|
| 14 | 7.10 | 78.60 | 42.90 | 35.70 | 35.70 | 64.30 | 100 | 100 | ||
|
| 13 | 0 | 23.10 | 15.40 | 15.40 | 15.40 | 84.60 | 100 | 100 | ||
|
| 5 | 0 | 40 | 40 | 20 | 20 | 100 | 100 | 100 | ||
| Other Gram‐positive bacteria | 14 | 55.60 (9) | 50 (6) | 22.20 (9) | 33.30 (9) | 33.30 (9) | 83.30 (6) | 100 (9) | 100 (9) |
| Bacteria |
| PEN | AMP | GEN | ERY | CIP | LVX | CLI | SXT | VAN | LNZ |
|---|---|---|---|---|---|---|---|---|---|---|---|
|
| 4 | 0 | 50 | 0 | 50 | 50 | 25 | 100 | 100 | ||
|
| 3 | 100 | 100 | 0 | 0 | 0 | 100 | 100 | |||
| Other Gram‐positive bacteria | 3 | 33.30 | 100 (1) | 100 (2) | 33.30 | 0 | 0 | 50 (2) | 100 | 100 |
| Bacteria |
| PEN | AMP | GEN | ERY | CIP | LVX | CLI | SXT | VAN | LNZ |
|---|---|---|---|---|---|---|---|---|---|---|---|
|
| 5 | 60 | 60 | 0 | 40 | 40 | 100 | 100 | |||
|
| 2 | 0 | 50 | 50 | 50 | 50 | 50 | 100 | 100 | ||
| Other Gram‐positive bacteria | 3 | 66.70 | 100 (1) | 100 (2) | 66.70 | 66.70 | 66.70 | 100 (2) | 100 | 100 |
| Bacteria |
| PEN | AMP | GEN | ERY | CIP | LVX | CLI | SXT | VAN | LNZ |
|---|---|---|---|---|---|---|---|---|---|---|---|
| 5 | 0 (4) | 0 (4) | 0 (4) | 0 (4) | 0 (4) | 75 (4) | 100 (4) | 100 (4) | |||
|
| 4 | 0 | 25 | 0 | 0 | 0 | 0 | 100 | 100 | ||
|
| 3 | 100 | 100 | 0 | 33.30 | 33.30 | 100 | 100 | |||
|
| 3 | 33.30 | 66.70 | 66.70 | 66.70 | 100 | 100 | 100 | |||
|
| 2 | 50 | 50 | 0 | 0 | 0 | 100 | 100 | |||
| Other Gram‐positive bacteria | 4 | 0 (2) | 100 (2) | 50 (2) | 100 (2) | 100 (2) | 100 (2) | 100 (2) | 100 (2) |
| Bacteria |
| PEN | AMP | GEN | ERY | CIP | LVX | CLI | SXT | VAN | LNZ |
|---|---|---|---|---|---|---|---|---|---|---|---|
|
| 14 | 0 | 14.30 | 7.10 | 7.10 | 7.10 | 7.10 | 100 | 100 | ||
|
| 5 | 0 | 80 | 0 | 0 | 0 | 20 | 100 | 100 | ||
|
| 4 | 0 | 100 | 100 | 100 | 100 | 100 | 100 | 100 | ||
|
| 4 | 0 | 0 | 0 | 0 | 0 | 75 | 100 | 100 | ||
|
| 2 | ||||||||||
| Other Gram‐positive bacteria | 10 | 33.30 (6) | 100 (1) | 40 (5) | 33.30 (6) | 33.30 (6) | 33.30 (6) | 100 (5) | 100 (6) | 100 (6) |
Peer Reviews
No public reviews on file for this paper yet. If you reviewed it on a platform where reviews are public (OpenReview, ICLR, NeurIPS, ICML), you can paste yours below so the community can read it here.
Videos
No videos yet. Explain this paper in a talk, walkthrough, or lecture? Add one.
Taxonomy
TopicsAntibiotic Use and Resistance · Antibiotic Resistance in Bacteria · Urinary Tract Infections Management
1. Introduction
Antimicrobial resistance (AMR) is among the most pressing global health threats, undermining the effectiveness of antimicrobial agents and threatening decades of progress in infectious disease management [1–3]. The World Health Organization (WHO) has identified AMR as a top public health priority due to its significant contribution to preventable morbidity and mortality worldwide [2]. Recent estimates suggest that resistant bacterial infections were associated with nearly 5 million deaths in 2019, a figure projected to rise without coordinated containment strategies [3]. In healthcare settings, AMR leads to delayed recovery, prolonged hospitalization, increased healthcare costs, and severely limited therapeutic options, particularly for infections caused by multidrug‐resistant (MDR) and extensively drug‐resistant (XDR) organisms [4].
The burden of AMR is especially severe in low‐ and middle‐income countries (LMICs), where over‐the‐counter antibiotic access, limited diagnostic capacity, and inconsistent infection prevention and control practices accelerate the spread of resistant pathogens [5]. Indonesia exemplifies these challenges in which national surveillance reports document high rates of MDR organisms in tertiary care facilities, yet routine susceptibility data to guide empirical therapy remain scarce [6–9]. These gaps contribute to inappropriate prescribing practices and foster the persistence and spread of resistant strains, particularly in high‐risk clinical environments such as intensive care units (ICUs) [7, 9].
Cumulative hospital antibiograms are a cornerstone of antimicrobial stewardship programs. They summarize local susceptibility patterns, support evidence‐based empirical therapy, and help track emerging resistance trends [10]. When developed in line with standardized methodologies, such as those outlined by the Clinical and Laboratory Standards Institute (CLSI), antibiograms can inform institutional treatment guidelines and strengthen stewardship initiatives [11]. However, regular and stratified antibiogram reporting remains uncommon in many Indonesian hospitals, limiting the ability to tailor empirical treatment to local resistance ecology [6, 9].
This study reports the 2024 cumulative antibiogram of YARSI Hospital, a tertiary academic center in Jakarta, Indonesia. It consolidates susceptibility data from blood, urine, lower respiratory tract, and ICU‐derived isolates across two surveillance periods. To our knowledge, this is the first cumulative antibiogram report from a tertiary academic hospital in Jakarta that stratifies susceptibility by specimen type, care setting (ICU vs. non‐ICU), and semester within a single surveillance year, thereby complementing national AMR surveillance with actionable, institution‐specific data.
2. Methods
2.1. Study Setting, Design, and Period
A retrospective descriptive study was conducted at YARSI Hospital, a private tertiary academic hospital located in Central Jakarta, Indonesia, from January to December 2024. The hospital has a capacity of approximately 500 beds and provides inpatient and outpatient services across multiple specialties, including intensive care, surgery, internal medicine, pediatrics, and obstetrics and gynecology. The Clinical Microbiology Laboratory at YARSI Hospital routinely performs diagnostic cultures and antimicrobial susceptibility testing (AST) to support patient management and hospital‐wide infection control.
2.2. Study Population
All clinical specimens submitted to the Clinical Microbiology Laboratory for culture and AST during the study period were considered. Specimens originated from both inpatient and outpatient departments, including ICUs. To ensure data representativeness and avoid duplication, only the first isolate of a given bacterial species per patient per specimen type was included in the analysis, in accordance with CLSI M39‐A4 guidelines [9]. Records with incomplete microbiological data were excluded.
2.3. Data Collection
Microbiological records were retrieved retrospectively from the laboratory information system for the surveillance period. Extracted data included specimen type, bacterial species identified, and antimicrobial susceptibility profiles. Susceptibility data were stratified by Gram classification, specimen source (blood, urine, and lower respiratory tract), and patient care setting (ICU vs. non‐ICU). To assess temporal variation, isolates were also compared between two surveillance intervals: January–June 2024 (first semester) and July–December 2024 (second semester).
2.4. Laboratory Methods
All specimens were processed following standard bacteriological procedures. Identification and AST were performed using a combination of conventional microbiological methods and automated systems (VITEK 2, bioMérieux, France). Where applicable, initial culture media included blood agar, MacConkey agar, and chocolate agar (Oxoid, United Kingdom). Colonies were identified based on morphology, Gram stain, and confirmatory biochemical or automated system profiles.
AST was performed using the Kirby–Bauer disk diffusion method on Mueller–Hinton agar (Oxoid, United Kingdom) and/or automated broth microdilution via the VITEK 2 system, in accordance with CLSI 2024 guidelines. The bacterial suspension was standardized to 0.5 McFarland prior to inoculation. Plates were incubated at 35°C–37°C for 18–24 h.
The following antimicrobial agents were tested, with disk potencies where applicable:
- • β‐Lactams: cefotaxime (30 μg), ceftriaxone (30 μg), ceftazidime (30 μg), and cefepime (30 μg)
- • β‐Lactam/β‐lactamase inhibitors: ampicillin–sulbactam (10/10 μg) and amoxicillin–clavulanate (20/10 μg)
- •Carbapenems: imipenem (10 μg) and meropenem (10 μg)
- •Aminoglycosides: gentamicin (10 μg) and amikacin (30 μg)
- •Fluoroquinolones: ciprofloxacin (5 μg) and levofloxacin (5 μg)
- •Others: trimethoprim–sulfamethoxazole (1.25/23.75 μg), clindamycin (2 μg), vancomycin (MIC testing only), linezolid (10 μg), and fosfomycin (200 μg; where available)
2.5. Quality Control
Quality control was performed in accordance with CLSI recommendations. Reference strains used included Escherichia coli ATCC 25922, Staphylococcus aureus ATCC 25923, Pseudomonas aeruginosa ATCC 27853, and Enterococcus faecalis ATCC 29212. Media sterility was routinely checked by incubating 5% of each batch overnight, while performance testing was conducted using QC strains prior to culture and AST. Antibiotic disks were sourced from Oxoid (United Kingdom), and the selection of agents was based on CLSI guidelines and local availability.
2.6. Data Analysis and Interpretation
Data were entered and analyzed using Microsoft Excel 2021. Descriptive statistics were used to summarize the frequencies of organisms and the proportions of antimicrobial susceptibility. In addition, inferential analyses were conducted to evaluate semester‐wise differences in surveillance distributions. Differences in the distribution of specimen types, sample origins, and organism groups between Semester I (January–June) and Semester II (July–December) were assessed using Pearson’s chi‐square tests on aggregated counts.
To satisfy statistical assumptions and reduce sparse cells, low‐frequency categories were collapsed into clinically meaningful groups prior to inferential testing. Where overall chi‐square tests were significant, post hoc analyses were limited to prespecified, high‐volume categories with direct clinical relevance to minimize multiple testing and avoid overinterpretation of surveillance data. Post hoc comparisons used 2 × 2 chi‐square tests with Fisher’s exact tests where appropriate.
3. Results
3.1. Study Characteristics
During the 2024 surveillance period, a total of 1782 clinical specimens were processed at the YARSI Hospital Clinical Microbiology Laboratory. The majority of samples were obtained from hospitalized patients, particularly from blood, urine, and respiratory tract specimens. Data collection was stratified into two semesters: January–June (Semester I) and July–December (Semester II).
3.1.1. Sample Types
Blood was the most frequently submitted specimen in both semesters, comprising 407 cultures in Semester I, as shown in Figure 1, and 440 cultures in Semester II, as shown in Figure 2. Lower respiratory tract specimens (sputum, endotracheal tube [ETT] secretions, and bronchial washings) also contributed substantially, reflecting a clinical focus on respiratory infections. Urine, pus, and wound swabs were additional common specimen types.
Total culture sample from the first semester (January–June 2024).
Total culture sample from the second semester (July–December 2024).
The distribution of specimen types differed significantly between Semester I and Semester II (Pearson’s χ ^2^(7) = 23.07, p = 0.002; aggregated N = 1775). In post hoc analysis, urine specimens accounted for a significantly higher proportion of samples in Semester II compared with Semester I (χ ^2^(1) = 13.62, p < 0.001; Fisher’s exact p < 0.001).
3.1.2. Clinical Locations
Most specimens originated from high‐acuity settings, as summarized by Figures 3 and 4. The ICU (sixth‐floor ICU) consistently accounted for the largest proportion (190 specimens in Semester I and 265 in Semester II), followed by the emergency department, high care units (HCUs), and operating rooms. Other notable contributors included the NICU, pediatric wards, and pulmonology clinics.
Sample origin from the first semester (January–June 2024).
Sample origin from the second semester (July–December 2024).
After collapsing clinical locations into major service categories, the distribution of sample origins differed significantly between semesters (χ ^2^(7) = 37.42, p < 0.001; aggregated N = 1777). In post hoc analyses, the proportion of specimens originating from the emergency department increased significantly in Semester II (χ ^2^(1) = 20.14, p < 0.001; Fisher’s exact p < 0.001). In contrast, the proportion of specimens originating from the ICU/HCU did not differ significantly between semesters (χ ^2^(1) = 1.23, p = 0.267; Fisher’s exact p = 0.269).
3.1.3. Microbial Isolates
Across both semesters, Klebsiella pneumoniae and Acinetobacter baumannii were the most frequently isolated Gram‐negative organisms, as shown in Figures 5 and 6. In Semester I, K. pneumoniae accounted for 73 isolates, while in Semester II, A. baumannii predominated with 67 isolates. Among Gram‐positive organisms, S. aureus, Staphylococcus epidermidis, and other coagulase‐negative staphylococci (CoNS) (Staphylococcus hominis and Staphylococcus haemolyticus) were most common. Opportunistic fungi, including Candida tropicalis and Candida albicans, were also observed. The isolate distribution reflected the clinical burden of hospital‐acquired infections, particularly in critical care units.
Culture isolate result from the first semester (January–June 2024).
Culture isolate result from the second semester (July–December 2024).
When isolates were grouped into major organism categories, the distribution of organisms differed significantly between Semester I and Semester II (Pearson’s χ ^2^(6) = 115.96, p < 0.001; N = 453). This distributional shift was primarily driven by an increased proportion of nonfermenting Gram‐negative bacilli in Semester II compared with Semester I (31.7% vs. 4.7%; χ ^2^(1) = 55.91, p < 0.001; Fisher’s exact p < 0.001).
3.2. Overview of Clinical Isolates
Of the 1782 processed specimens, K. pneumoniae was the most frequent Gram‐negative isolate (19.6%), while S. epidermidis was the most common Gram‐positive organism in blood cultures. All analyses were deduplicated per CLSI M39‐A4 guidelines, with only the first isolate per species per patient per specimen type included. Organism–antibiotic combinations with < 30 isolates were excluded from antibiogram reporting to ensure statistical validity. Antibiogram interpretation focused on blood, urine, and lower respiratory tract isolates. Where provided, the number of isolates tested per antibiotic is indicated in parentheses; if no number is listed, susceptibility testing was conducted on all isolates of that species. Color coding was used in antibiogram tables to indicate sensitivity thresholds: orange for < 50% susceptible, yellow for 50%–75%, and green for ≥ 76%.
3.3. Gram‐Negative Bacteria
Among Gram‐negative bacilli, E. coli, K. pneumoniae, P. aeruginosa, and A. baumannii were the predominant pathogens. E. coli showed high resistance to ampicillin but retained moderate‐to‐high susceptibility to aminoglycosides, fluoroquinolones, and carbapenems. K. pneumoniae exhibited broad resistance across multiple antibiotic classes, including third‐generation cephalosporins, β‐lactam/β‐lactamase inhibitor combinations, and fluoroquinolones, raising concern for ESBL and carbapenemase activity. P. aeruginosa maintained moderate susceptibility to ceftazidime, cefepime, and aminoglycosides. A. baumannii was the most resistant organism, showing extensive drug resistance with limited susceptibility primarily to amikacin and trimethoprim–sulfamethoxazole. Some antibiotic–organism combinations lacked data due to limited isolate numbers or testing constraints.
3.3.1. Blood Isolates
K. pneumoniae and P. aeruginosa were the dominant Gram‐negative pathogens in blood cultures. K. pneumoniae isolates exhibited poor susceptibility (< 50%) to most cephalosporins and penicillin combinations, although 65.2% remained susceptible to meropenem and 56.5% to amikacin in Semester I (Tables 1 and 2). P. aeruginosa retained moderate susceptibility to ceftazidime and aminoglycosides (Tables 1 and 2).
3.3.2. Urine Isolates
E. coli was the leading uropathogen and retained high susceptibility to ceftazidime, cefepime, meropenem, and amikacin (> 88%, shown in Tables 3 and 4). Resistance was more pronounced to ampicillin–sulbactam and ciprofloxacin. In contrast, K. pneumoniae isolates from urine displayed markedly lower susceptibility across all tested agents (Tables 3 and 4).
3.3.3. Lower Respiratory Tract Isolates
Respiratory tract specimens were dominated by A. baumannii and K. pneumoniae. A. baumannii exhibited broad resistance but retained activity to amikacin (78.8%) and SXT (57.6%). K. pneumoniae from respiratory sources showed poor susceptibility, with < 32% sensitivity to most agents except amikacin (Tables 5 and 6).
3.3.4. ICU‐Specific Gram‐Negative Isolates
ICU‐derived Gram‐negative isolates were primarily A. baumannii, exhibiting MDR phenotypes with susceptibility only to amikacin (71%) and SXT (51.6%). K. pneumoniae from ICU patients showed moderate susceptibility to cefepime (35%) and SXT (75%) but significant resistance to carbapenems and fluoroquinolones (Tables 7 and 8).
3.4. Gram‐Positive Bacteria
Among Gram‐positive cocci, S. aureus, S. hominis, S. haemolyticus, and E. faecalis were commonly identified. Most isolates remained highly susceptible to vancomycin and linezolid, indicating preserved effectiveness of glycopeptides and oxazolidinones. S. aureus also showed good susceptibility to clindamycin and moderate susceptibility to fluoroquinolones. E. faecalis retained sensitivity to ampicillin and vancomycin but exhibited resistance to erythromycin. CoNS displayed reduced susceptibility to penicillin and macrolides, though they remained susceptible to vancomycin and linezolid. Incomplete data for some organism–antibiotic combinations were due to limited testing or low isolate counts.
3.4.1. Blood Isolates
CoNS (mainly S. hominis and S. epidermidis) dominated, with uniform susceptibility to VAN and LNZ but high resistance to β‐lactams and macrolides. E. faecalis remained susceptible to ampicillin and VAN (Tables 9 and 10).
3.4.2. Urine and Respiratory Isolates
E. faecalis and S. haemolyticus predominated in urine, showing resistance to fluoroquinolones but retaining susceptibility to VAN. Respiratory specimens yielded S. aureus and S. epidermidis, both demonstrating strong susceptibility to VAN, LNZ, and CLI (Tables 11 and 12).
3.4.3. ICU‐Specific Gram‐Positive Isolates
In the ICU, S. haemolyticus and S. epidermidis dominated Gram‐positive isolates. These showed persistent resistance to β‐lactams and fluoroquinolones but were uniformly susceptible to VAN and LNZ (Tables 13 and 14). The high frequency of CoNS from blood cultures raises concerns regarding contamination or suboptimal aseptic sampling.
3.5. Temporal Comparison Between Semesters
Semester‐based analysis revealed minimal fluctuations in susceptibility trends for most organism–antibiotic combinations. However, a subtle decline in carbapenem susceptibility was observed among ICU‐derived K. pneumoniae isolates from the first semester to the second semester. E. coli susceptibility remained stable, while A. baumannii showed progressive reduction in sensitivity to previously active agents, such as amikacin and SXT, in the second semester.
Figure 7 illustrates the antibiotic resistance trends among major Gram‐negative organisms isolated in 2024, including E. coli, K. pneumoniae, P. aeruginosa, and A. baumannii. The bar chart shows the average percentage of resistance to a selection of commonly used antibiotics. Overall, A. baumannii demonstrated the highest levels of resistance across nearly all agents tested, consistent with an MDR phenotype. K. pneumoniae also exhibited elevated resistance, particularly to third‐generation cephalosporins and fluoroquinolones. In contrast, E. coli showed moderate resistance patterns, while P. aeruginosa displayed variable resistance, with some susceptibility retained to ceftazidime and gentamicin.
Antibiotic resistance trends: Gram‐negative organisms. The vertical axis shows the percentage of resistant isolates; the horizontal axis lists individual antibiotics. Each bar color represents a specific organism, as indicated in the legend. Abbreviations: AMC, amoxicillin–clavulanate; AMK, amikacin; AMP, ampicillin; CAZ, ceftazidime; CIP, ciprofloxacin; CTR, ceftriaxone; CTX, cefotaxime; FEP, cefepime; GEN, gentamicin; IPM, imipenem; LVX, levofloxacin; MEM, meropenem; SAM, ampicillin–sulbactam; SXT, trimethoprim–sulfamethoxazole.
Figure 8 presents the resistance profiles of key Gram‐positive organisms, including S. aureus, S. hominis, S. haemolyticus, and E. faecalis. Resistance to penicillin and erythromycin was commonly observed, especially among CoNS. However, high susceptibility was generally preserved for vancomycin and linezolid across most species. These visual comparisons provide a clear overview of resistance burdens and support targeted empirical treatment decisions based on organism type and likely resistance mechanisms.
Antibiotic resistance trends: Gram‐positive organisms. The vertical axis shows the percentage of resistant isolates; the horizontal axis lists individual antibiotics. Each bar color represents a specific organism, as indicated in the legend. Abbreviations: AMP, ampicillin; CIP, ciprofloxacin; CLI, clindamycin; ERY, erythromycin; GEN, gentamicin; LNZ, linezolid; LVX, levofloxacin; PEN, penicillin; SXT, trimethoprim–sulfamethoxazole; VAN, vancomycin.
4. Discussion
4.1. AMR Landscape at YARSI Hospital
The 2024 cumulative antibiogram from YARSI Hospital in Jakarta demonstrates a substantial burden of MDR pathogens, particularly Gram‐negative bacilli isolated from ICU and respiratory specimens. By combining detailed stratification by ward, specimen source, and pathogen with strict adherence to current CLSI interpretive standards, this antibiogram provides a more methodologically rigorous and standardized depiction of local AMR than many previous Indonesian hospital reports, which have often focused on a single clinical unit or a limited group of organisms.
The observed resistance patterns are consistent with global and regional analyses, indicating that rising AMR is largely driven by sustained selection pressure from empiric and prolonged use of broad‐spectrum antibiotics, particularly in high‐acuity care settings where stewardship implementation may be variable [12]. In contexts where diagnostic support is limited or delayed, empiric regimens are often continued longer than intended, increasing exposure to high‐priority antibiotics and amplifying selective pressure [13]. This dynamic is especially relevant in tertiary hospitals managing critically ill patients, where clinical urgency may constrain opportunities for early de‐escalation.
Beyond their clinical implications, these findings also reflect a broader biosafety and biosecurity challenge within Indonesian healthcare and other low‐ and middle‐income settings [4–6]. The predominance of K. pneumoniae and A. baumannii across multiple care settings, coupled with consistently low susceptibility to cephalosporins, fluoroquinolones, and β‐lactam/β‐lactamase inhibitor combinations, suggests entrenched resistance rather than sporadic emergence.
From a biosecurity perspective, the circulation of MDR, XDR, and potentially pan‐drug‐resistant (PDR) organisms within hospital environments increases the risk of sustained transmission if infection prevention measures are suboptimal [5, 10]. These pathogens pose threats not only to patients but also to healthcare workers and the surrounding community, given their ability to persist on environmental surfaces and to disseminate resistance determinants through horizontal gene transfer [10, 11]. Consequently, rigorous infection control practices, including environmental cleaning, device management, and cohorting, remain essential components of institutional biosecurity alongside antimicrobial stewardship.
4.2. Comparisons With National and Regional Surveillance
The resistance patterns observed at YARSI Hospital are broadly consistent with reports from other Indonesian tertiary hospitals, where resistance of K. pneumoniae to third‐generation cephalosporins frequently exceeds 50% and carbapenem resistance has shown a rising trajectory [14–16]. Budayanti et al. [14] documented a high burden of MDR K. pneumoniae and P. aeruginosa, with A. baumannii emerging as a dominant ICU pathogen retaining susceptibility largely to amikacin. Subsequent studies have confirmed that A. baumannii remains a major challenge in critical care settings, with many isolates exhibiting extensive drug resistance and limited therapeutic options, often restricted to colistin [14, 16, 17]. National surveillance data further indicate a steady increase in carbapenem‐resistant Enterobacterales (CRE), underscoring the expanding scope of resistance beyond individual hospitals [16]. In Surabaya, Utami et al. [18] reported preserved susceptibility of urinary E. coli to carbapenems and aminoglycosides, alongside fluoroquinolone resistance exceeding 30%, a pattern concordant with the reduced ciprofloxacin activity against E. coli observed in the present study.
These national findings parallel broader Southeast Asian trends, where MDR K. pneumoniae predominates among ICU isolates and carbapenem resistance in A. baumannii has reached 40%–60% in countries such as Thailand and Vietnam [19, 20]. At the global level, longitudinal surveillance has demonstrated a sustained increase in carbapenem resistance among Enterobacterales over the past decade [21]. Collectively, these comparisons suggest that the resistance profiles observed at YARSI Hospital are not isolated anomalies but reflect shared regional and global pressures, including prolonged exposure to broad‐spectrum antibiotics in critical care environments and limited opportunities for effective de‐escalation.
Importantly, large observational analyses have highlighted a growing reliance on “Watch” and “Reserve” category antibiotics, agents with a higher propensity to select for resistance, particularly in hospital settings managing severe infections [22]. Without robust stewardship oversight, such prescribing patterns may accelerate resistance amplification across institutions. In parallel, contextual reviews have identified gaps in guideline implementation, diagnostic capacity, and policy coordination in LMICs, factors that can further exacerbate resistance trajectories when not addressed systematically [13]. Together, these data indicate that resistance patterns at YARSI Hospital are embedded within broader health‐system dynamics, reinforcing the need for coordinated stewardship, surveillance, and policy responses rather than isolated institutional interventions.
4.3. Isolate‐Specific Observations
In contrast to ICU and respiratory isolates, E. coli from urine specimens at YARSI Hospital retained relatively high susceptibility to ceftazidime, cefepime, meropenem, and amikacin. This pattern is consistent with other Indonesian and international reports [19, 23, 24] and likely reflects differences in care pathways and cumulative antibiotic exposure between community‐associated urinary tract infections (UTIs) and hospital‐acquired infections. In community‐acquired UTIs, antibiotic courses are generally shorter and narrower in spectrum, which may limit selective pressure compared with prolonged, multiclass exposure typical of critical care settings. These findings suggest that empirical regimens for uncomplicated community‐acquired UTIs remain largely effective. However, the observed reduction in susceptibility to fluoroquinolones and trimethoprim–sulfamethoxazole supports the use of culture‐guided therapy for recurrent, complicated, or healthcare‐associated UTIs, in line with current IDSA recommendations [25, 26].
Evidence from longitudinal antimicrobial stewardship studies indicates that structured stewardship interventions can incrementally improve prescribing appropriateness and reduce selective pressure on Gram‐negative bacilli, including ESBL‐producing organisms, in tertiary care environments [27]. The contrast between susceptibility patterns observed in urinary E. coli and those seen in ICU‐associated pathogens in the present study is therefore consistent with the established relationship between antibiotic intensity, duration of exposure, and resistance emergence across different clinical settings.
Among Gram‐positive organisms, S. epidermidis and E. faecalis demonstrated preserved susceptibility to vancomycin and linezolid, in agreement with regional and global surveillance data [28, 29]. Nevertheless, the frequent recovery of S. epidermidis from blood cultures warrants cautious interpretation, as this organism commonly represents contamination rather than true bloodstream infection [30, 31]. Such findings underscore the importance of diagnostic stewardship and strict aseptic blood culture collection practices, both to improve data quality and to avoid unnecessary escalation of antimicrobial therapy driven by misclassified contaminants.
4.4. Temporal Trends
Semester‐wise comparison revealed largely stable resistance trends during 2024. However, subtle but epidemiologically relevant changes were observed, including a modest decline in carbapenem susceptibility among ICU‐derived K. pneumoniae and increasing resistance of A. baumannii to trimethoprim–sulfamethoxazole in the second semester. Similar short‐term temporal fluctuations have been reported in Asian hospital surveillance studies and are thought to reflect cumulative antibiotic selection pressure, shifts in empiric prescribing patterns, and intermittent clonal dissemination within high‐acuity units, rather than abrupt changes in resistance mechanisms [32, 33].
The significant semester‐wise shifts in specimen mix, sample origins, and organism composition, particularly the increased contribution from the emergency department and nonfermenting Gram‐negative bacilli in the second semester, suggest changes in patient flow and case mix, potentially increasing exposure to healthcare‐associated pathogens at earlier stages of admission. Such epidemiological shifts underscore the importance of interpreting antibiogram trends in conjunction with hospital utilization patterns and reinforce the value of routine, stratified antibiogram surveillance to inform empirical therapy and stewardship planning [26, 27].
Broader global analyses indicate that these temporal resistance patterns are shaped by system‐wide determinants, including limited diagnostic capacity, inconsistent enforcement of antimicrobial stewardship policies, and unequal access to effective or last‐line antibiotics. Together, these factors influence antibiotic selection, duration of therapy, and opportunities for de‐escalation, thereby collectively driving resistance dynamics over time, particularly in low‐ and middle‐income healthcare settings [34, 35].
4.5. Implications and Limitations
These findings support three critical actions. First, routine, stratified antibiogram reporting is essential to detect emerging resistance patterns and to guide context‐specific empirical therapy, particularly in settings with heterogeneous patient populations and shifting epidemiology [36]. Second, strengthened antimicrobial stewardship programs are needed to curb inappropriate use of broad‐spectrum antibiotics, promote timely de‐escalation, and align prescribing with local resistance data and WHO AWaRe principles [37, 38]. Third, enhanced diagnostic stewardship and strict aseptic sampling practices are required to improve data validity, reduce blood culture contamination, and prevent unnecessary antibiotic escalation driven by misclassified isolates [39, 40].
This study is limited by its single‐center design, retrospective data collection, and the absence of molecular characterization of resistance mechanisms (e.g., carbapenemase genotyping), which constrain causal inference and mechanistic interpretation. Nonetheless, adherence to CLSI M39‐A4 methodology and comprehensive stratification by specimen type and care setting strengthen internal validity and provide actionable institutional insights for stewardship and infection prevention.
By situating YARSI Hospital’s resistance data within Indonesian, Southeast Asian, and global AMR trends, this report offers pragmatic evidence to refine empirical prescribing and stewardship strategies. Collectively, these findings underscore the importance of hospital‐level, stratified antibiogram surveillance as a foundational component of Indonesia’s broader response to AMR [41].
5. Conclusion
The 2024 cumulative antibiogram from YARSI Hospital highlights the substantial burden of AMR, predominantly driven by MDR K. pneumoniae and A. baumannii in critical care settings and invasive infections. These resistance patterns severely restrict empirical treatment options. In contrast, E. coli urinary isolates retained higher susceptibility to several key antibiotics, and Gram‐positive organisms remained largely sensitive to glycopeptides and oxazolidinones. Nonetheless, the predominance of resistant Gram‐negatives in the ICU and frequent recovery of S. epidermidis from blood cultures underscore persistent vulnerabilities in clinical practice.
These findings strongly support the need for routine, stratified antibiogram reporting and the implementation of locally adapted antimicrobial stewardship programs. Such measures are essential to optimize empirical therapy, improve diagnostic accuracy, and enable continuous surveillance of evolving resistance trends. Strengthening these practices is vital not only for safeguarding patient outcomes at the institutional level but also for contributing to Indonesia’s broader efforts in combating AMR as part of the global health agenda.
Author Contributions
R.B. contributed to conceptualization, methodology, supervision, validation, and writing (review and editing). M.A.R.P. contributed to conceptualization, data curation, formal analysis, investigation, methodology, visualization, writing (original draft), and writing (review and editing). S.B. contributed to data curation, investigation, resources, and writing (review and editing). N.P. contributed to project administration, resources, supervision, and writing (review and editing). E.Y. contributed to data curation, investigation, resources, and writing (review and editing). N.R.V.B. contributed to data curation, investigation, and writing (review and editing). A.A.S. contributed to data curation, investigation, and writing (review and editing). T.D.F. contributed to data curation, investigation, and writing (review and editing).
Funding
No funding was received for this manuscript.
Ethics Statement
This study received ethical approval from the Ethics Committee of YARSI Hospital, Jakarta. The study was conducted in accordance with the ethical standards of the committee and with the principles of the Declaration of Helsinki. Permission to access anonymized laboratory records was obtained from the hospital administration, and all data were deidentified prior to analysis to ensure confidentiality.
Consent
Given the retrospective design of the study and the exclusive use of deidentified laboratory data, the requirement for individual patient consent was waived by the Ethics Committee.
Conflicts of Interest
The authors declare no conflicts of interest.
The reference list from the paper itself. Each links out to its DOI / PubMed record.
- 1O’Neill J. , Tackling Drug-Resistant Infections Globally: Final Report and Recommendations, 2016, The Review on Antimicrobial Resistance.
- 2World Health Organization , Global Action Plan on Antimicrobial Resistance, 2015, World Health Organization, Geneva.10.7196/samj.964426242647 · doi ↗ · pubmed ↗
- 3Antimicrobial Resistance Collaborators , Global Burden of Bacterial Antimicrobial Resistance in 2019: A Systematic Analysis, Lancet. (2022) 399, no. 10325, 629–655.35065702 10.1016/S 0140-6736(21)02724-0PMC 8841637 · doi ↗ · pubmed ↗
- 4Laxminarayan R. , Duse A. , Wattal C. , Zaidi A. K. , Wertheim H. F. , Sumpradit N. , Vlieghe E. , Hara G. L. , Gould I. M. , Goossens H. , Greko C. , So A. D. , Bigdeli M. , Tomson G. , Woodhouse W. , Ombaka E. , Peralta A. Q. , Qamar F. N. , Mir F. , Kariuki S. , Bhutta Z. A. , Coates A. , Bergstrom R. , Wright G. D. , Brown E. D. , and Cars O. , Antibiotic Resistance—The Need for Global Solutions, Lancet Infectious Diseases.(2013) 13, no. 12, · doi ↗ · pubmed ↗
- 5Ayukekbong J. A. , Ntemgwa M. , and Atabe A. N. , The Threat of Antimicrobial Resistance in Developing Countries, Antimicrobial Resistance & Infection Control.(2017) 6, no. 1.10.1186/s 13756-017-0208-x PMC 543303828515903 · doi ↗ · pubmed ↗
- 6Ministry of Health of the Republic of Indonesia, World Health Organization , National Action Plan on Antimicrobial Resistance Control 2020–2024, 2020, World Health Organization Indonesia.
- 7Radji M. , Fauziah S. , and Aribinuko N. , Antibiotic Sensitivity Pattern of Bacterial Pathogens in the Intensive Care Unit of Fatmawati Hospital, Indonesia, Asian Pacific Journal of Tropical Biomedicine. (2011) 1, no. 1, 39–42, 10.1016/S 2221-1691(11)60065-8, 2-s 2.0-80054856256, 23569722.23569722 PMC 3609151 · doi ↗ · pubmed ↗
- 8Gach M. W. , Lazarus G. , Simadibrata D. M. , Sinto R. , Saharman Y. R. , Limato R. , Nelwan E. J. , van Doorn H. R. , Karuniawati A. , and Hamers R. L. , Antimicrobial Resistance Among Common Bacterial Pathogens in Indonesia: A Systematic Review, Lancet Regional Health Southeast Asia.(2024) 26, no. 26, 100414, 10.1016/j.lansea.2024.100414.38778837 PMC 11109028 · doi ↗ · pubmed ↗