Global prevalence of poor sleep quality in hemodialysis patients: a systematic review and meta-analysis
Gui-Fen Shi, Xu-Hua Zhou, Lin Chen, Ying-Jun Zhang, Wen-Wen Yu, Jiao Zhang, Li He, Si-Kai Tang

TL;DR
This study finds that about 64% of hemodialysis patients globally experience poor sleep quality, highlighting the need for better screening and interventions.
Contribution
The study provides the first global pooled prevalence estimate of poor sleep quality in hemodialysis patients.
Findings
The global prevalence of poor sleep quality among hemodialysis patients is 64.2%.
Subgroup analysis showed significant variation in prevalence based on cut-off values.
Meta-regression found no significant association between sleep quality prevalence and factors like age or dialysis duration.
Abstract
Poor sleep quality is associated with various adverse outcomes among hemodialysis (HD) patients. Although poor sleep quality is a widely recognized health issue in HD patients, the reported prevalence in the current literature are remarkably inconsistent. This study aimed to determine the global prevalence of poor sleep quality in HD patients. A comprehensive literature search was conducted across seven electronic databases (PubMed, Web of Science, Scopus, Embase, Cochrane Library, CINAHL, PsycINFO) from their inception to October 20, 2025. Data extraction was performed using a standardized form, and the methodological quality of included studies was evaluated with the Joanna Briggs Institute (JBI) critical appraisal checklist for prevalence studies. A random-effects model was applied to calculate the pooled prevalence of poor sleep quality, and the heterogeneity was quantified using…
Genes, proteins, chemicals, diseases, species, mutations and cell lines named across the full text — each resolved to its canonical identifier and authoritative record.
Click any figure to enlarge with its caption.
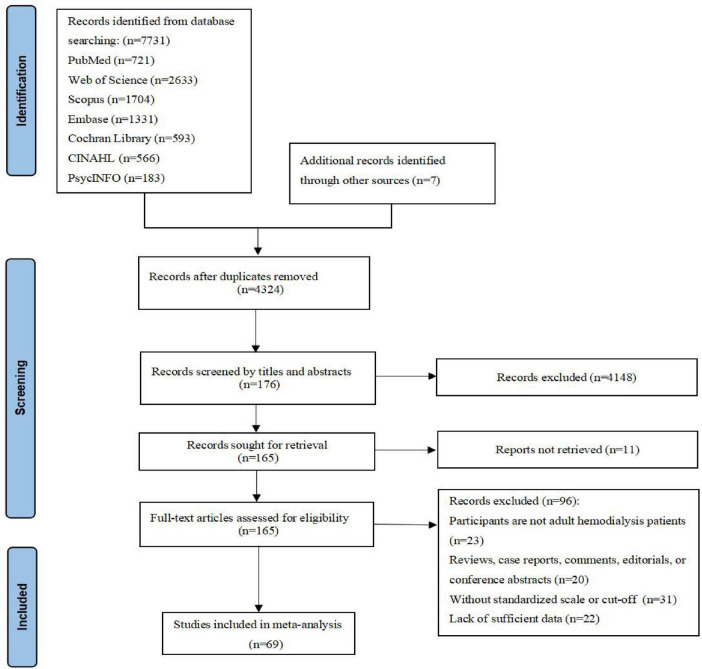 FIGURE 1
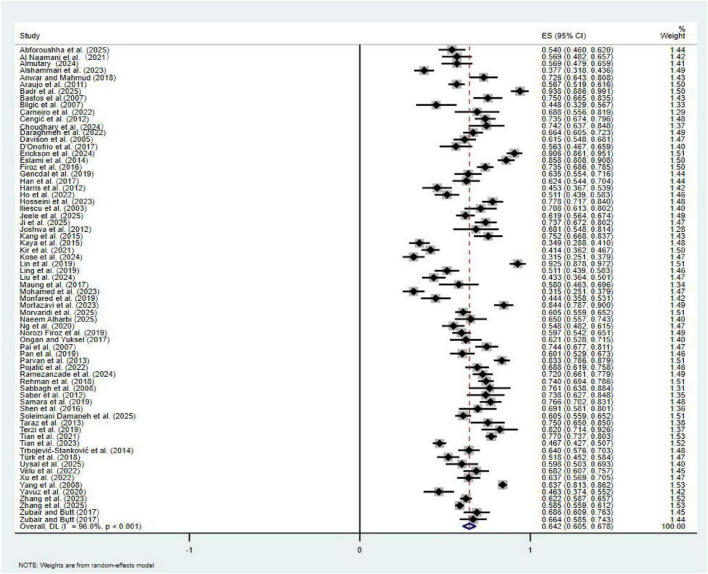 FIGURE 2
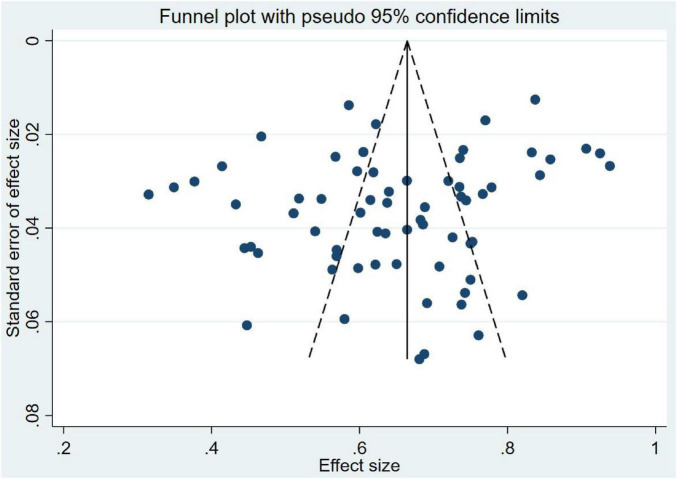 FIGURE 3
| Study | Country | Study design | Sample size | Mean age (years) | Dialysis duration (years) | Female (%) | Assessment tool | Cut-off value | Prevalence (%) |
|---|---|---|---|---|---|---|---|---|---|
| Abforoushha et al. ( | Iran | Cross-sectional | 150 | 65.61 ± 4.07 | 3.37 ± 2.20 | 49.3 | PSQI | ≥ 6 | 54.1% |
| Al Naamani et al. ( | Oman | Cross-sectional | 123 | NR | NR | 32.5 | PSQI | ≥ 5 | 56.9% |
| Almutary ( | Saudi Arabia | Cross-sectional | 116 | 50.66 ± 12.73 | NR | 54.3 | PSQI | ≥ 5 | 56.9% |
| Alshammari et al. ( | Saudi Arabia | Cross-sectional | 260 | NR | NR | 42.7 | PSQI | ≥ 5 | 37.7% |
| Anwar and Mahmud ( | Pakistan | Cross-sectional | 113 | NR | NR | 53.1 | PSQI | ≥ 5 | 72.6% |
| Araujo et al. ( | Brazil | Cross-sectional | 400 | 51.6 ± 15.5 | 5.9 ± 5.5 | 59.0 | PSQI | ≥ 6 | 56.7% |
| Badr et al. ( | Egypt | Cross-sectional | 81 | 47.2 ± 7.6 | NR | 48.1 | PSQI | ≥ 5 | 93.8% |
| Bastos et al. ( | Brazil | Cross-sectional | 100 | 46.1 ± 15.5 | 5.00 ± 4.58 | 41.0 | PSQI | ≥ 6 | 75.0% |
| Bilgic et al. ( | Turkey | Cross-sectional | 67 | 47.7 ± 11.4 | 8.64 ± 4.93 | 49.3 | PSQI | ≥ 6 | 44.8% |
| Carneiro et al. ( | Brazil | Cross-sectional | 48 | 48.32 ± 12.37 | 5.12 ± 3.82 | 45.8 | PSQI | ≥ 6 | 68.8% |
| Čengić et al. ( | Bosnia and Herzegovina | Cross-sectional | 200 | 56.8 ± 14.3 | 5.22 ± 4.75 | 39.0 | PSQI | ≥ 6 | 73.5% |
| Choudhary et al. ( | India | Cross-sectional | 66 | NR | NR | 40.9 | PSQI | ≥ 6 | 74.2% |
| Daraghmeh et al. ( | Palestine | Cross-sectional | 250 | 54.9 ± 15.08 | NR | 37.2 | PSQI | ≥ 5 | 66.4% |
| Davison et al. ( | Canada | Cross-sectional | 205 | 60.0 ± 15.9 | 2.77 ± 4.12 | 42.0 | PSQI | ≥ 7 | 61.5% |
| D’Onofrio et al. ( | Italy | Cross-sectional | 103 | NR | NR | 37.9 | PSQI | ≥ 5 | 56.3% |
| Erickson et al. ( | USA | Cross-sectional | 160 | 58 ± 14 | 4.13 ± 4.18 | 45.0 | PSQI | ≥ 5 | 90.6% |
| Eslami et al. ( | Iran | Cross-sectional | 190 | NR | NR | 39.5 | PSQI | ≥ 5 | 85.8% |
| Firoz et al. ( | Iran | Cross-sectional | 310 | 59.64 ± 13.94 | NR | 47.7 | PSQI | ≥ 6 | 73.5% |
| Gencdal et al. ( | Turkey | Cross-sectional | 137 | 49.74 ± 12.49 | 3.45 ± 3.87 | 38.7 | PSQI | ≥ 6 | 63.5% |
| Han et al. ( | China | Cross-sectional | 141 | 59.7 ± 15.3 | NR | 39.0 | PSQI | ≥ 5 | 62.4% |
| Harris et al. ( | USA | Cohort | 128 | 57.3 ± 13.8 | NR | 39.8 | PSQI | ≥ 6 | 45.3% |
| Ho et al. ( | Malaysia | Cross-sectional | 184 | 54.3 ± 12.6 | NR | 39.1 | PSQI | ≥ 6 | 51.1% |
| Hosseini et al. ( | Iran | Cross-sectional | 175 | 51.6 ± 16.4 | NR | 36.4 | PSQI | ≥ 6 | 78.2% |
| Iliescu et al. ( | Canada | Cross-sectional | 89 | 60.1 ± 16.8 | NR | 38.2 | PSQI | ≥ 6 | 70.8% |
| Jeele et al. ( | Somalia | Cross-sectional | 299 | 56.65 ± 12 | NR | 45.8 | PSQI | ≥ 6 | 61.9% |
| Ji et al. ( | Korea | Cross-sectional | 175 | 56.9 ± 13.8 | 5.5 ± 5.5 | 44.0 | PSQI | ≥ 6 | 73.7% |
| Joshwa et al. ( | India | Cross-sectional | 47 | 37.1 ± 13.1 | NR | 49.0 | PSQI | ≥ 5 | 68.1% |
| Kang et al. ( | Korea | Cross-sectional | 101 | 57.3 ± 12.2 | 2.98 ± 3.00 | 45.1 | PSQI | ≥ 5 | 75.2% |
| Kaya et al. ( | Turkey | Cross-sectional | 232 | 60.9 ± 14.1 | 3.57 ± 3.63 | 43.5 | PSQI | ≥ 6 | 34.9% |
| Kir et al. ( | Turkey | Cross-sectional | 338 | NR | NR | 47.6 | PSQI | ≥ 6 | 41.4% |
| Kose et al. ( | Somalia | Cross-sectional | 200 | 52.3 ± 14.13 | NR | 41.5 | PSQI | ≥ 6 | 31.5% |
| Lin et al. ( | China | Cross-sectional | 120 | NR | NR | 46.7 | PSQI | ≥ 6 | 92.5% |
| Ling et al. ( | Malaysia | Cross-sectional | 184 | 54.3 ± 12.6 | NR | 39.1 | PSQI | ≥ 6 | 51.1% |
| Liu et al. ( | China | Cross-sectional | 201 | 51.1 ± 9.0 | NR | 44.3 | PSQI | ≥ 6 | 43.3% |
| Maung et al. ( | USA | Cross-sectional | 69 | 55.6 ± 16.6 | NR | 50.7 | PSQI | ≥ 6 | 58.0% |
| Mohamed et al. ( | Somalia | Cross-sectional | 200 | 52.29 ± 14.13 | NR | 41.5 | PSQI | ≥ 6 | 31.5% |
| Monfared et al. ( | Iran | Cross-sectional | 126 | 54.9 ± 16.1 | NR | 38.9 | PSQI | ≥ 6 | 44.6% |
| Mortazavi et al. ( | Iran | Cross-sectional | 160 | 60.01 ± 13.52 | 6.37 ± 6.02 | 33.7 | PSQI | ≥ 6 | 84.4% |
| Morvaridi et al. ( | Iran | Cross-sectional | 423 | 52.83 | 4.95 | 40.7 | PSQI | ≥ 6 | 60.5% |
| Naeem Alharbi ( | Saudi Arabia | Cross-sectional | 100 | NR | NR | 58.0 | PSQI | ≥ 6 | 65.0% |
| Ng et al. ( | Malaysia | Cross-sectional | 217 | 57 ± 13 | 4.62 ± 4.06 | 50.2 | PSQI | ≥ 6 | 54.8% |
| Norozi Firoz et al. ( | Iran | Cross-sectional | 310 | 59.64 ± 13.94 | 3.32 ± 3.55 | 47.7 | PSQI | ≥ 6 | 59.7% |
| Ongan and Yuksel ( | Turkey | Cross-sectional | 103 | 59.19 ± 14.57 | NR | 51.5 | PSQI | ≥ 5 | 62.1% |
| Pai et al. ( | China | Cross-sectional | 164 | 57.9 ± 11.8 | NR | 53.0 | PSQI | ≥ 6 | 74.4% |
| Pan et al. ( | China | Cross-sectional | 178 | 62.9 ± 11.5 | 4.73 ± 3.35 | 42.0 | PSQI | ≥ 6 | 60.1% |
| Parvan et al. ( | Iran | Cross-sectional | 245 | 58.03 ± 14.03 | NR | 35.5 | PSQI | ≥ 6 | 83.3% |
| Pojatić et al. ( | Croatia | Cross-sectional | 170 | NR | NR | 40.6 | PSQI | ≥ 5 | 68.8% |
| Ramezanzade et al. ( | Iran | Cross-sectional | 225 | 58.23 ± 13.50 | NR | 41.3 | PSQI | ≥ 5 | 72.0% |
| Rehman et al. ( | Pakistan | Cross-sectional | 354 | NR | NR | 33.9 | PSQI | ≥ 6 | 74.0% |
| Sabbagh et al. ( | Canada | Cross-sectional | 46 | 61.9 ± 16.9 | NR | 34.0 | PSQI | ≥ 5 | 76.1% |
| Sabet et al. ( | Iran | Cross-sectional | 61 | 52.5 ± 18.0 | NR | 32.8 | PSQI | ≥ 6 | 73.8% |
| Samara et al. ( | Palestine | Cross-sectional | 167 | 57.6 ± 12.9 | NR | 47.9 | PSQI | ≥ 5 | 76.7% |
| Shen et al. ( | China | Cross-sectional | 68 | 61.75 ± 16.56 | 2.64 ± 2.45 | 36.8 | PSQI | ≥ 5 | 69.1% |
| Soleimani Damaneh et al. ( | Iran | Cross-sectional | 423 | 52.84 ± 14.63 | 4.12 ± 5.12 | 41.1 | PSQI | ≥ 6 | 60.5% |
| Taraz et al. ( | Iran | Cross-sectional | 72 | 56.68 ± 15.79 | 5.93 ± 5.36 | 41.7 | PSQI | ≥ 5 | 75.0% |
| Terzi et al. ( | Turkey | Cross-sectional | 50 | 64.46 ± 14.61 | NR | 56.0 | PSQI | ≥ 5 | 82.0% |
| Tian et al. ( | China | Cohort | 613 | 63.7 ± 7.8 | NR | 42.1 | PSQI | ≥ 5 | 77.0% |
| Tian et al. ( | China | Cohort | 595 | 57.40 ± 13.72 | NR | 41.2 | PSQI | ≥ 7 | 46.7% |
| Trbojević-Stanković et al. ( | Serbia | Cross-sectional | 222 | 57.3 ± 11.9 | 5.12 ± 5.03 | 40.5 | PSQI | ≥ 6 | 64.0% |
| Türk et al. ( | Turkey | Cross-sectional | 220 | NR | NR | 50.9 | PSQI | ≥ 6 | 51.8% |
| Uysal et al. ( | Turkey | Cross-sectional | 102 | NR | NR | 48.0 | PSQI | ≥ 5 | 59.8% |
| Velu et al. ( | India | Cross-sectional | 148 | 44 ± 14.5 | NR | 31.8 | PSQI | ≥ 5 | 68.2% |
| Xu et al. ( | China | Cross-sectional | 193 | 53.09 ± 11.68 | NR | 34.2 | PSQI | ≥ 6 | 63.7% |
| Yang et al. ( | China | Cross-sectional | 861 | NR | NR | 55.2 | PSQI | ≥ 5 | 83.7% |
| Yavuz et al. ( | Turkey | Cross-sectional | 121 | NR | NR | 54.5 | PSQI | ≥ 6 | 46.3% |
| Zhang et al. ( | China | Cross-sectional | 741 | 60 ± 14 | NR | 62.1 | PSQI | ≥ 6 | 62.2% |
| Zhang et al. ( | China | Cross-sectional | 1281 | 54.48 ± 13.09 | NR | 34.7 | PSQI | ≥ 6 | 58.5% |
| Zubair and Butt ( | Pakistan | Cross-sectional | 140 | NR | NR | 27.9 | PSQI | ≥ 5 | 68.6% |
| Zubair and Butt ( | Pakistan | Cross-sectional | 137 | NR | NR | 27.7 | PSQI | ≥ 5 | 66.4% |
| Subgroups | Number of studies | Prevalence (95% CI) | Heterogeneity | ||
|---|---|---|---|---|---|
| I2 | |||||
| Income level | 0.964 | ||||
| 13 | 64.0% (54.0–73.9%) | 95.2% | |||
| 56 | 64.2% (60.3–68.2%) | 96.2% | |||
| Study design | 0.502 | ||||
| 66 | 64.5% (60.8–68.3%) | 95.8% | |||
| 3 | 56.5% (33.4–79.6%) | 98.6% | |||
| Cut-off values | 0.006 | ||||
| 26 | 70.5% (65.4–75.6%) | 94.0% | |||
| 41 | 60.8% (56.4–65.2%) | 95.4% | |||
| 2 | 53.8% (39.4–68.3%) | 92.8% | |||
| Variables | Number of studies | Coefficient | Standard error | 95%CI | ||
|---|---|---|---|---|---|---|
| Sample size | 69 | -5.07 × 10⁻⁵ | −8.53 × 10⁻⁵ | −0.0002–0.0001 | −0.59 | 0.554 |
| Mean age (years) | 52 | 0.0023 | 0.0038 | 0.0053–0.0099 | 0.61 | 0.543 |
| Dialysis duration (years) | 20 | 0.0021 | 0.0217 | −0.0434–0.0476 | 0.10 | 0.924 |
| Female (%) | 69 | −0.0012 | 0.0024 | −0.0059–0.0036 | −0.50 | 0.620 |
Peer Reviews
No public reviews on file for this paper yet. If you reviewed it on a platform where reviews are public (OpenReview, ICLR, NeurIPS, ICML), you can paste yours below so the community can read it here.
Videos
No videos yet. Explain this paper in a talk, walkthrough, or lecture? Add one.
Taxonomy
TopicsDialysis and Renal Disease Management · Sleep and related disorders · Restless Legs Syndrome Research
Introduction
1
End-stage renal disease (ESRD) remains a serious global public health challenge (1). Patients with ESRD are dependent on renal replacement therapy to survive, of which hemodialysis (HD) is one of the most common treatments worldwide, supporting the lives of millions of individuals (2). As the number of ESRD patients continues to increase, the primary focus of clinical management has shifted from improving survival rates to enhancing the quality of life for long-term dialysis patients (3).
Sleep quality is generally defined as an individual’s subjective satisfaction with the sleep experience, encompassing sleep initiation, sleep maintenance, sleep depth, and feeling refreshed upon waking, all of which are equally crucial for ensuring a decent quality of life in HD patients (4, 5). Owing to the combined effects of uremic toxin-induced neurological symptoms, dialysis-related circadian rhythm disturbances, and comorbid emotional disorders, all contribute to the prevalent poor sleep quality observed in HD patients (6, 7). It is worth noting that poor sleep quality has a considerable and ongoing effect on the overall health of HD patients (5). Specifically, poor sleep quality is closely associated with numerous clinical adverse outcomes such as dialysis-related fatigue, cardiovascular events, cognitive impairment, infection, and mortality among HD patients (8–11). Therefore, a comprehensive understanding of the prevalence of poor sleep quality in HD patients and its associated factors is crucial for achieving better health outcomes for them.
An accurate estimation of the prevalence of poor sleep quality among HD patients is essential for informing the development of evidence-based prevention and treatment strategies. However, substantial heterogeneity exists in the reported prevalence of poor sleep quality among HD patients across existing studies, with estimates ranging from 31.5 to 93.8% (12–14). Potential resources that contribute to this significant heterogeneity may be attributed to several factors, including different demographic characteristics of the cohorts, instruments used to assess sleep quality, cut-off values, and study designs. To date, there has been no meta-analysis on the global prevalence of poor sleep quality among HD patients. Therefore, this study aimed to determine the global prevalence and its moderating factors of poor sleep quality in HD patients.
Materials and methods
2
This meta-analysis adhered to the Preferred Reporting Items for Systematic Reviews and Meta-Analyses (PRISMA) guidelines (15). The protocol was registered with PROSPERO (CRD420251175694).
Search strategy
2.1
A comprehensive literature search was conducted across seven electronic databases, including PubMed, Web of Science, Scopus, Embase, Cochrane Library, CINAHL, PsycINFO for articles published from inception until October 20, 2025. The search strategy incorporated MeSH and key terms, including “dialysis,” “hemodialysis,” “hamedialysis,” “sleep quality,” “sleeping quality,” “Pittsburgh sleep quality index,” and “PSQI.” The search syntax for each database is detailed in Supplementary Table S1. Manual searches of the reference lists of included articles and relevant reviews were conducted to identify additional eligible studies.
Inclusion and exclusion criteria
2.2
The inclusion criteria were as follows: (1) participants were adult patients (aged ≥ 18 years) on hemodialysis; (2) a cross-sectional or cohort design was adopted (only baseline data included for longitudinal studies); (3) poor sleep quality was defined using a validated instrument such as the PSQI; (4) the prevalence of poor sleep quality was reported or calculable. The exclusion criteria were: (1) reviews, case reports, comments, editorials, or conference abstracts; (2) not published in English; (3) the cut-off values for poor sleep quality were not provided. In cases of duplicate publications, only the study with the largest sample size was retained for analysis.
Data extraction
2.3
Data extraction was performed independently by two reviewers using a pilot-tested, standardized Excel form. The following data were extracted: first author, publication year, country, study design, sample size, mean age, dialysis duration, proportion of females, assessment tool, cut-off value, and prevalence of poor sleep quality. All extractions were cross-checked to ensure accuracy, with any discrepancies resolved by consensus.
Risk of bias assessment
2.4
The risk of bias in each included study was independently evaluated by two reviewers using the Joanna Briggs Institute (JBI) critical appraisal tool for prevalence studies (16). This checklist includes nine domains, each scored as “yes,” “no,” or “unclear/not applicable.” Based on the proportion of “yes” responses, the overall risk for each study was then classified as low (≥ 70%), moderate (50–69%), or high (≤ 49%). Any discrepancies were referred to a third reviewer and resolved by consensus discussion.
Data analysis
2.5
All analyses were conducted using Stata 15.0. The pooled prevalence of poor sleep quality among HD patients and its 95% confidence interval (CI) were derived using a random-effects model. Heterogeneity was evaluated using the I^2^ statistic, with substantial heterogeneity defined as I^2^ ≥ 50% (17). Potential sources of heterogeneity were explored via subgroup analyses based on study design, country income level, and the cut-off values applied. In addition, univariate meta-regression analyses were performed to identify moderators of the prevalence estimates, with sample size, mean age, dialysis duration, and proportion of females serving as covariates. Publication bias was examined visually by inspecting the funnel plot symmetry and statistically using Egger’s test. A leave-one-out sensitivity analysis was undertaken to assess the robustness of the pooled results. P < 0.05 was considered statistically significant (two-sided).
Results
3
Study selection
3.1
The initial search of electronic databases identified 7,731 records from databases and 7 from manual searches. After the removal of duplicates, 4,324 records were screened based on titles and abstracts. Of these, 165 full-text articles were assessed for eligibility. A total of 69 studies were ultimately incorporated into the meta-analysis. The study screening process is detailed in Figure 1.
Flow diagram of study selection.
Study characteristics
3.2
The detailed characteristics of the included studies are shown in Table 1. A total of 14,998 participants from 69 studies (7–11, 14, 18–76) were included, with mean ages ranging from 37.10 to 65.61 years. The included studies were conducted in 19 countries, including Iran (n = 11), China (n = 10), Turkey (n = 10), Pakistan (n = 5), Saudi Arabia (n = 4), Malaysia (n = 4), Somalia (n = 3), Canada (n = 3), USA (n = 3), India (n = 3), Brazil (n = 3), Palestine (n = 2), Korea (n = 2), Oman (n = 1), Egypt (n = 1), Bosnia and Herzegovina (n = 1), Italy (n = 1), Croatia (n = 1), and Serbia (n = 1). The sample sizes for individual studies varied from 46 to 1,281. All studies utilized the PSQI to assess sleep quality, employing different cut-off values: a PSQI score ≥ 5 was used in 26 studies, a score ≥ 6 in 41 studies, and a score ≥ 7 in 2 studies. The prevalence of poor sleep quality reported in the included studies varied considerably, with a range of 31.5–93.8%.
Risk of bias assessment of included studies
3.3
The risk of bias assessment results were detailed in Supplementary Table S2. Among the 69 evaluated responses, 55 (79.7%) were rated as having a low risk of bias, while 14 (20.3%) were considered to have a moderate risk of bias.
Prevalence of poor sleep quality in HD patients
3.4
Owing to the substantial heterogeneity observed across studies, a random-effects model was adopted for the meta-analysis. As shown in Figure 2, the pooled global prevalence of poor sleep quality among HD patients was 64.2% (95% CI: 60.5–67.8%, I^2^ = 96.0%).
Forest plot of pooled prevalence of poor sleep quality in HD patients.
Subgroup analysis and meta-regression analysis
3.5
Subgroup analysis was conducted to examine the sources of heterogeneity between studies (Table 2). Subgroup analysis based on country income level (Supplementary Figure S1) revealed no significant difference in the pooled prevalence of poor sleep quality between high-income (64.0%, 95% CI: 54.0–73.9%) and low- and middle-income countries (64.2%, 95% CI: 60.3–68.2%). When stratified by study design (Supplementary Figure S2), cross-sectional studies (64.5%, 95% CI: 60.8–68.3%) and cohort studies (56.5%, 95% CI: 33.4–79.6%) demonstrated similar prevalence of poor sleep quality among HD patients. Subgroup analysis by PSQI cut-off value (Supplementary Figure S3) revealed a significant negative correlation (P < 0.05). Specifically, the pooled prevalence of poor sleep quality decreased from 70.5% (95% CI: 65.4–75.6%) at a cut-off of ≥ 5–60.8% (95% CI: 56.4–65.2%) at a cut-off of ≥ 6 and then to 53.8% (95% CI: 39.4–68.3%) at a cut-off of ≥ 7.
The results of the univariate meta-regression (Table 3) demonstrated no significant associations between the pooled prevalence of poor sleep quality and the potential moderators, including sample size, mean age, dialysis duration, and female proportion (all P > 0.05).
Publication bias and sensitivity analysis
3.6
Neither visual inspection of the funnel plot (Figure 3) nor statistical evaluation by Egger’s test revealed any evidence of substantial publication bias (Egger’s test: t = 15.60, P = 0.055, Supplementary Figure S4). Furthermore, the sensitivity analysis confirmed that the pooled prevalence was robust (Supplementary Table S3).
Funnel plot of prevalence of poor sleep quality in HD patients.
Discussion
4
Given that poor sleep quality is a distressing symptom that significantly impairs quality of life in HD patients (8), this study pooled its prevalence in a global sample of 14,998 participants across 19 countries. To the best of our knowledge, this is the first meta-analysis to comprehensively estimate the global prevalence of poor sleep quality in this population. The pooled global prevalence of poor sleep quality among HD patients was 64.2%, which is substantially higher than rates reported in the general population and stroke survivors (77, 78). These findings are in line with expectations, since the various disease and treatment-related issues experienced by HD patients make them susceptible to sleep disturbances (23–26). Firstly, despite regular dialysis, the persistent accumulation of uremic toxins can impair central nervous system function, leading to conditions such as restless legs syndrome and periodic limb movements during sleep, which significantly disrupt sleep initiation in HD patients (24). In addition, the psychological burden of being dependent on dialysis, coupled with concerns about prognosis and socioeconomic issues, usually results in clinical anxiety and depression. These conditions have been demonstrated to be one of the primary contributors to sleep disturbances in these patients (33). Finally, the rigorous daytime schedule of hemodialysis, which generally requires a considerable time commitment several days a week for HD patients, interrupts their normal daily rhythms and is an important cause of sleep disturbances at night (45).
Subgroup analysis results indicated no significant difference in the pooled prevalence of poor sleep quality between high-income (64.0%, 95% CI: 54.0–73.9%) and low- and middle-income countries (64.2%, 95% CI: 60.3–68.2%). These findings may be attributed to several factors. First of all, the mechanisms leading to sleep disturbances in HD patients, such as the accumulation of uremic toxins, electrolyte imbalances, and the comorbidity burden, are inherently connected to renal failure itself (65). Furthermore, the widespread use of the PSQI as a standardized assessment tool ensures consistent measurement of outcomes, thereby reducing potential diagnostic variability that might otherwise result from economic disparities between countries (41–43). Lastly, economic status may be a less relevant indicator than specific factors such as dialysis adequacy, shift work patterns, or the level of family support, all of which have a more direct impact on sleep quality.
In subgroup analyses, the pooled prevalence of poor sleep quality was observed to be similar in both cross-sectional (64.5%, 95% CI: 60.8–68.3%) and cohort studies (56.5%, 95% CI: 33.4–79.6%). In our study, only the prevalence of poor sleep quality at baseline in cohort studies was included in the analysis. At baseline assessment, patients in longitudinal studies are essentially equivalent to those in cross-sectional studies, as they share comparable disease status, treatment exposure, and demographic characteristics before any specific follow-up occurs (79). The factors influencing sleep quality are therefore consistent across both study designs at this point. Therefore, for the purpose of estimating prevalence, information derived from baseline data in high-quality cohort studies should be considered as reliable.
In the stratified analysis based on cut-off values, significant differences were observed in the pooled prevalence of poor sleep quality among studies using different thresholds. Specifically, the pooled prevalence of poor sleep quality decreased from 70.5% (95% CI: 65.4–75.6%) at a cut-off of ≥ 5–60.8% (95% CI: 56.4–65.2%) at a cut-off of ≥ 6 and then to 53.8% (95% CI: 39.4–68.3%) at a cut-off of ≥ 7. Lower cut-off values inherently broaden the scope of case identification, encompassing individuals with milder clinical symptoms. Conversely, applying more stringent thresholds makes the diagnostic criteria for defining poor sleep quality more rigorous, restricting case designation to those exhibiting more pronounced clinical features. These results highlight the fact that choosing cut-off values has a crucial impact on both epidemiological estimates and the potential for developing targeted interventions to address the spectrum of sleep disorder severity in this population.
Given the high prevalence of poor sleep quality in HD patients, it is recommended to integrate sleep assessment into the routine clinical management of HD patients. Specifically, standardized tools should be used for screening during outpatient visits and follow-ups at the clinical screening level. Additionally, clinical nurses can incorporate sleep monitoring into daily assessments and provide sleep hygiene guidance. Finally, multidisciplinary teams integrating psychiatric and psychological services with rehabilitation therapy should be established to develop individualized intervention strategies.
Limitations
5
Some limitations should be considered. Firstly, consistent with other meta-analyses conducted on prevalence studies, the included studies exhibited a high level of heterogeneity. However, the heterogeneity remained unexplained by our subgroup and meta-regression analyses. Secondly, despite the lack of a statistical association between prevalence and income level in our subgroup analysis, the overrepresentation of articles from low- and middle-income countries in the included studies limits the robustness of this conclusion for high-income countries. Thirdly, the measurement of poor sleep quality relies on self-reporting tools, which may introduce recall bias. Fourthly, we excluded articles published in any language other than English, which may introduce potential selection bias. Finally, the findings of this study should be interpreted with caution, as they are primarily derived from the pooled results of multiple small-sample observational studies, and the statistical power of the publication bias test is limited.
Conclusion
6
In conclusion, this meta-analysis demonstrates that poor sleep quality is a common adverse symptom experienced by HD patients. Given the negative impact of poor sleep quality on HD patients, it is essential to routinely evaluate their sleep quality and implement evidence-based interventions.
The reference list from the paper itself. Each links out to its DOI / PubMed record.
- 1Du Q Jiang Y Liu Y. Prevalence of metabolic syndrome in patients with end-stage renal disease: a systematic review and meta-analysis. Int Urol Nephrol. (2024) 56:1057–69. 10.1007/s 11255-023-03790-z 37740847 · doi ↗ · pubmed ↗
- 2Wu M Li Y Hou X Zhang W Wang Z. The effects of glucose-containing dialysate on cardiovascular and cerebrovascular outcome events in hemodialysis patients. Semin Dial. (2025) 38:231–6. 10.1111/sdi.70005 40769947 · doi ↗ · pubmed ↗
- 3Asanova A Bolatov A Suleimenova D Khazhgaliyeva Y Shaisultanova S Altynova S Assessing quality of life in hemodialysis patients in kazakhstan: a cross-sectional study. J Clin Med. (2025) 14:5021. 10.3390/jcm 14145021 40725715 PMC 12295577 · doi ↗ · pubmed ↗
- 4Ho L Chan Y Daud Z’M. Dietary factors and sleep quality among hemodialysis patients in Malaysia. J Ren Nutr. (2022) 32:251–60. 10.1053/j.jrn.2021.02.003 33838975 · doi ↗ · pubmed ↗
- 5Jia W Wang Y Yang L Liu Q Dong W He W. Analysis of sleep quality categories and associated factors in patients on hemodialysis. Hemodial Int. (2025) 29:190–200. 10.1111/hdi.13201 39905714 · doi ↗ · pubmed ↗
- 6Al Naamani Z Gormley K Noble H Santin O Al Maqbali M. Fatigue, anxiety, depression and sleep quality in patients undergoing haemodialysis. BMC Nephrol. (2021) 22:157. 10.1186/s 12882-021-02349-3 33910523 PMC 8080199 · doi ↗ · pubmed ↗
- 7Almutary H. Fatigue and pruritus impact sleep quality in hemodialysis patients. Nat Sci Sleep. (2024) 16:2289–98. 10.2147/NSS.S 496376 39758161 PMC 11699828 · doi ↗ · pubmed ↗
- 8Alshammari B Alkubati S Pasay-An E Alrasheeday A Alshammari H Asiri S Sleep quality and its affecting factors among hemodialysis patients: a multicenter cross-sectional study. Healthcare. (2023) 11:2536. 10.3390/healthcare 11182536 37761733 PMC 10531149 · doi ↗ · pubmed ↗