Investigating the association of NBN gene polymorphisms with multiple cancers through statistical meta-analysis and bioinformatics insights
Md Harun-Or-Roshid, Md Selim Reza, Md Ariful Islam, Md Humaun Farid, Md Mostafizur Rahman, Saroje Kumar Sarkar, Md Nurul Haque Mollah

TL;DR
This study finds that certain genetic variations in the NBN gene are linked to increased risks of specific cancers like bladder and breast cancer, but results are not yet ready for clinical use.
Contribution
The study provides a comprehensive meta-analysis and bioinformatics validation of NBN gene polymorphisms in relation to cancer risks across multiple cancer types.
Findings
The rs1805794 polymorphism is significantly associated with increased risk of bladder and nasopharyngeal cancers.
The rs709816 polymorphism shows a significant link to breast cancer risk.
Bioinformatics analysis supports the meta-analysis findings and highlights the NBN gene's role in cancer susceptibility.
Abstract
Several individual genetic association studies, including meta-analyses, have investigated the association of two SNPs (rs1805794 and rs709816) of NBN gene with multiple cancer risks. However, their findings were inconsistent, making it challenging to use NBN gene as a diagnostic and prognostic biomarker. This study aims to provide an improved reliability on the association between NBN polymorphisms and multiple cancers through the extended statistical meta-analysis. We collected a comprehensive dataset comprising 58 individual SNP-cancer association studies, including 23 494 cases and 29 592 controls for rs1805794, and 5325 cases and 11 149 controls for rs709816 polymorphisms, using a systematic search strategy across online databases. The collected data were analyzed using statistical meta-analysis to investigate the association between two SNPs and cancers. This meta-analysis…
Genes, proteins, chemicals, diseases, species, mutations and cell lines named across the full text — each resolved to its canonical identifier and authoritative record.
Click any figure to enlarge with its caption.
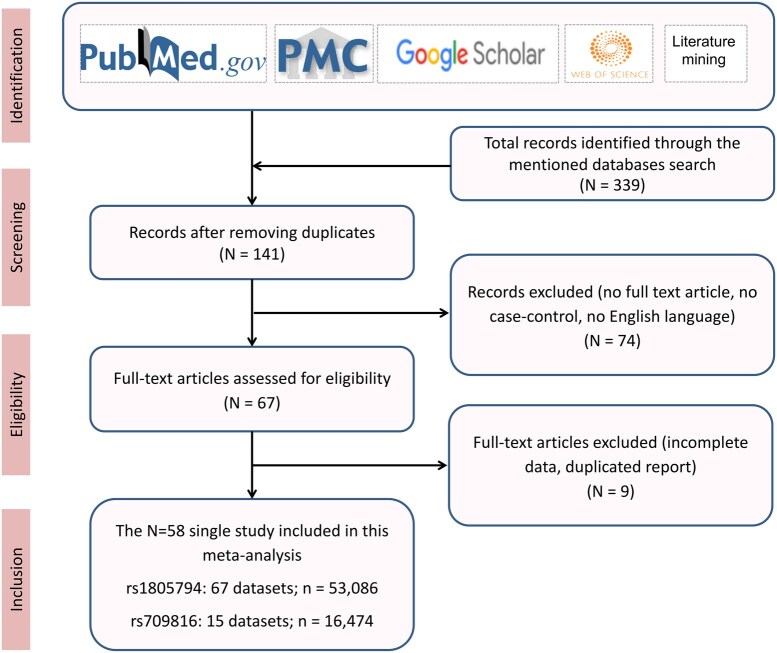 Figure 1
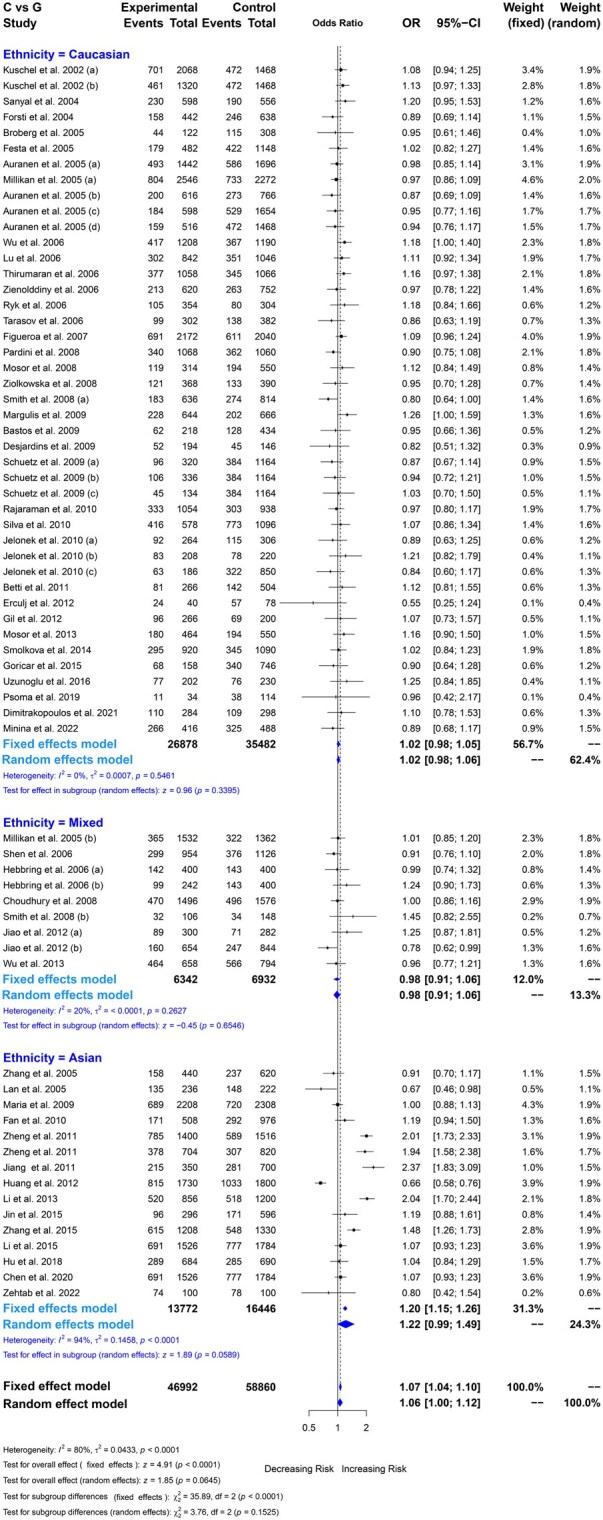 Figure 2
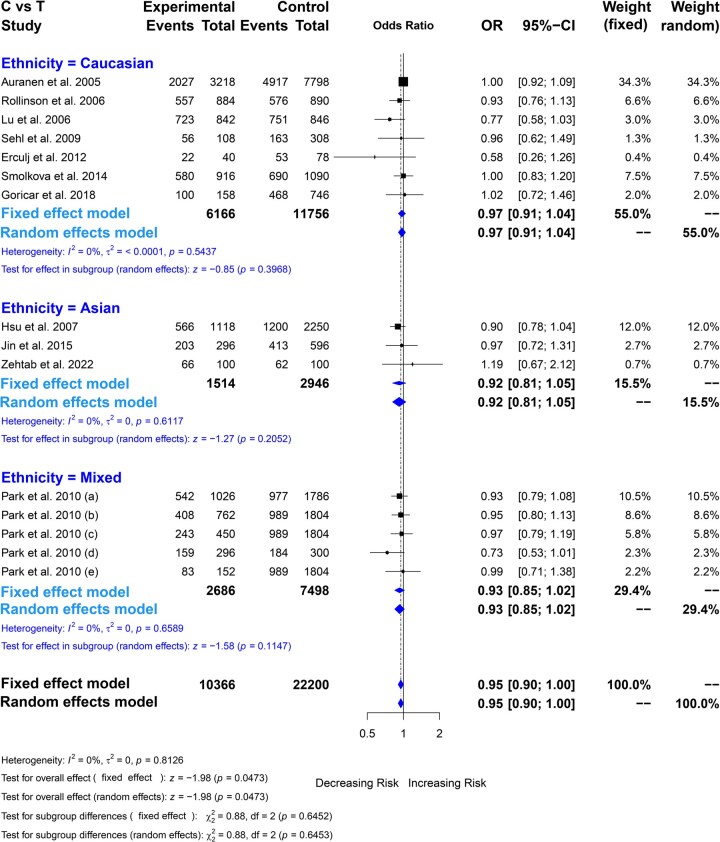 Figure 3
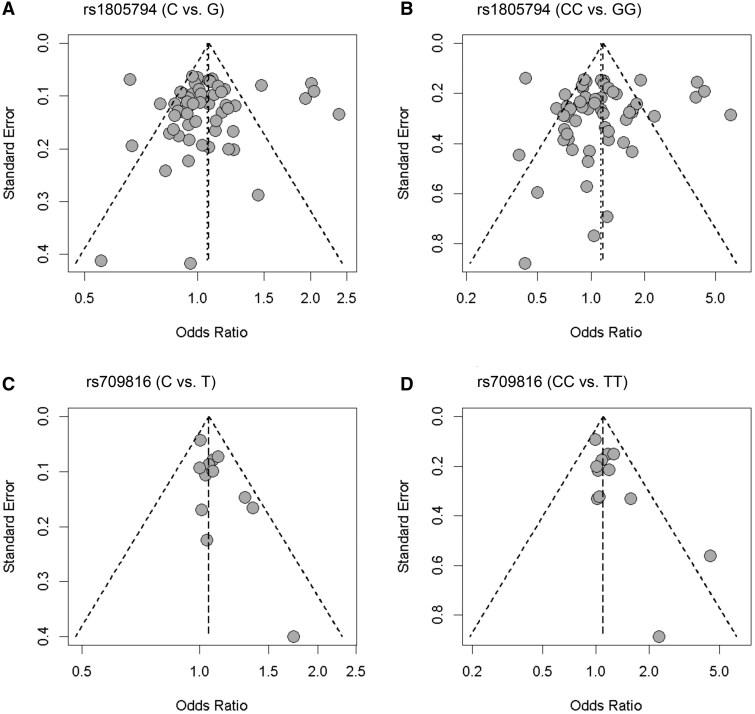 Figure 4
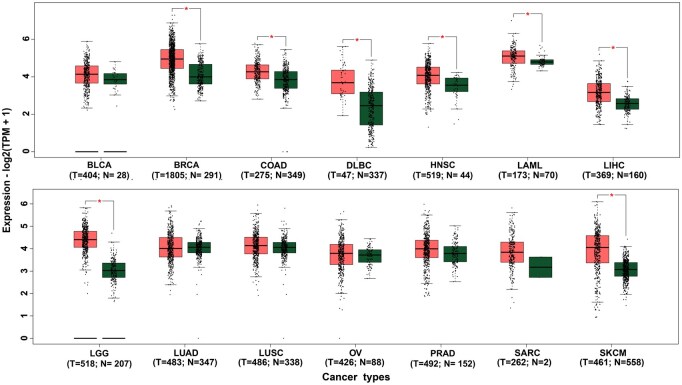 Figure 5
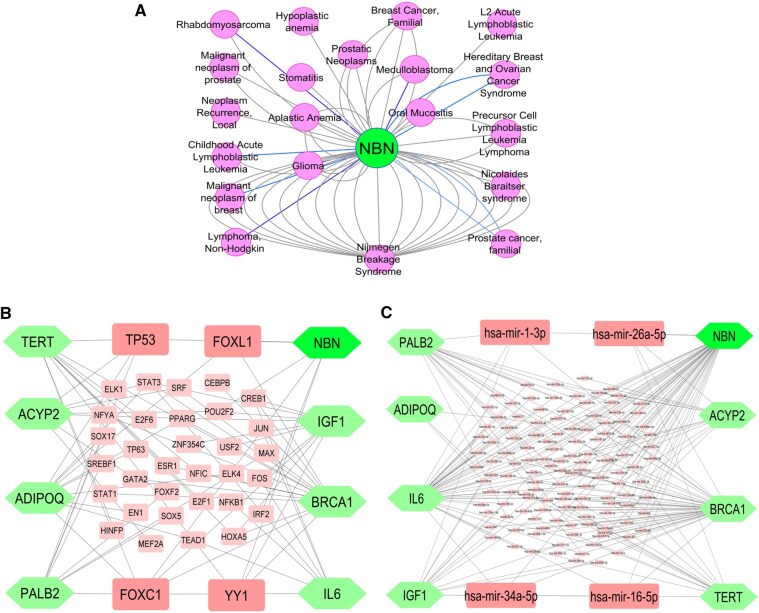 Figure 6
| Author | Year | Country | Ethnicity | Source of control | Case | Control | Cancer types |
|
|---|---|---|---|---|---|---|---|---|
|
| ||||||||
|
| 2002 | UK | Caucasian | Population | 1034 | 864 | Breast cancer | 0.850 (Y) |
|
| 2002 | UK | Caucasian | Population | 660 | 864 | Breast cancer | 0.850 (Y) |
|
| 2004 | Sweden | Caucasian | Hospital | 299 | 278 | Bladder cancer | 0.234 (Y) |
|
| 2004 | Germany | Caucasian | Population | 221 | 319 | Breast cancer | 0.920 (Y) |
|
| 2005 | Sweden | Caucasian | Hospital | 61 | 154 | Bladder cancer | 0.383 (Y) |
|
| 2005 | UK | Caucasian | Population | 721 | 848 | Ovarian cancer | 0.381 (Y) |
|
| 2005 | USA | Caucasian | Population | 308 | 383 | Ovarian cancer | 0.455 (Y) |
|
| 2005 | Denmark | Caucasian | Population | 299 | 827 | Ovarian cancer | 0.948 (Y) |
|
| 2005 | UK | Caucasian | Population | 258 | 734 | Ovarian cancer | 0.850 (Y) |
|
| 2005 | USA | Caucasian | Population | 1273 | 1136 | Breast cancer | 0.660 (Y) |
|
| 2005 | USA | Mixed | Population | 766 | 681 | Breast cancer | 0.533 (Y) |
|
| 2005 | Sweden | Caucasian | Hospital | 241 | 574 | Skin cancer | 0.937 (Y) |
|
| 2005 | China | Asian | Hospital | 220 | 310 | Breast cancer | 0.755 (Y) |
|
| 2005 | China | Asian | Population | 118 | 111 | Lung cancer | 0.319 (Y) |
|
| 2006 | USA | Caucasian | Population | 604 | 595 | Bladder cancer | 0.618 (Y) |
|
| 2006 | USA | Mixed | Population | 477 | 563 | Blood cancer | 0.365 (Y) |
|
| 2006 | China | Caucasian | Hospital | 421 | 423 | Breast cancer | 0.000 (N) |
|
| 2006 | Germany | Caucasian | Hospital | 529 | 533 | Skin cancer | 0.222 (Y) |
|
| 2006 | Norway | Caucasian | Hospital | 310 | 376 | Lung cancer | 0.495 (Y) |
|
| 2006 | USA | Mixed | Population | 200 | 200 | Prostate cancer | 0.047 (N) |
|
| 2006 | USA | Mixed | Population | 121 | 200 | Prostate cancer | 0.047 (N) |
|
| 2006 | Sweden | Caucasian | Population | 177 | 152 | Lung cancer | 0.000 (N) |
|
| 2006 | Russia | Caucasian | Population | 151 | 191 | Breast cancer | 0.982 (Y) |
|
| 2007 | USA | Caucasian | Hospital | 1086 | 1020 | Bladder cancer | 0.117 (Y) |
|
| 2008 | USA | Caucasian | Hospital | 318 | 407 | Breast cancer | 0.522 (Y) |
|
| 2008 | USA | Mixed | Hospital | 53 | 74 | Breast cancer | 0.169 (Y) |
|
| 2008 | UK | Mixed | Mixed | 748 | 788 | Bladder cancer | 0.414 (Y) |
|
| 2008 | Czech | Caucasian | Hospital | 532 | 532 | Colon cancer | 0.076 (Y) |
|
| 2008 | Poland | Caucasian | Population | 157 | 275 | Blood cancer | 0.266 (Y) |
|
| 2008 | Poland | Caucasian | Hospital | 184 | 195 | Laryngeal cancer | 0.393 (Y) |
|
| 2009 | USA | Caucasian | Hospital | 322 | 333 | Kidney cancer | 0.012 (N) |
|
| 2009 | Cyprus | Asian | Population | 1104 | 1154 | Breast cancer | 0.650 (Y) |
|
| 2009 | Portugal | Caucasian | Hospital | 109 | 217 | Thyroid cancer | 0.178 (Y) |
|
| 2009 | Canada | Caucasian | Population | 97 | 73 | Breast cancer | 0.608 (Y) |
|
| 2009 | Canada | Caucasian | Population | 160 | 582 | Blood cancer | 0.235 (Y) |
|
| 2009 | Canada | Caucasian | Population | 168 | 582 | Blood cancer | 0.235 (Y) |
|
| 2009 | Canada | Caucasian | Population | 67 | 582 | Blood cancer | 0.235 (Y) |
|
| 2010 | USA | Caucasian | Hospital | 527 | 469 | Brain cancer | 0.406 (Y) |
|
| 2010 | China | Asian | Hospital | 254 | 488 | Lung cancer | 0.312 (Y) |
|
| 2010 | Portugal | Caucasian | Hospital | 289 | 548 | Breast cancer | 0.365 (Y) |
|
| 2010 | Poland | Caucasian | Population | 132 | 153 | Colon cancer | 0.893 (Y) |
|
| 2010 | Poland | Caucasian | Population | 104 | 110 | Head and neck cancer | 0.446 (Y) |
|
| 2010 | Poland | Caucasian | Population | 93 | 425 | Breast cancer | 0.411 (Y) |
|
| 2011 | Italy | Caucasian | Population | 133 | 252 | Lung cancer | 0.757 (Y) |
|
| 2011 | China | Asian | Hospital | 700 | 758 | Nasopharyngeal cancer | 0.949 (Y) |
|
| 2011 | China | Asian | Hospital | 352 | 410 | Nasopharyngeal cancer | 0.346 (Y) |
|
| 2011 | China | Asian | Hospital | 175 | 350 | Blood cancer | 0.154 (Y) |
|
| 2012 | China | Mixed | Population | 150 | 141 | Blood cancer | 0.000 (N) |
|
| 2012 | China | Mixed | Population | 327 | 422 | Blood cancer | 0.000 (N) |
|
| 2012 | China | Asian | Hospital | 865 | 900 | Liver cancer | 0.251 (Y) |
|
| 2012 | Slovenia | Caucasian | Hospital | 20 | 39 | Blood cancer | 0.340 (Y) |
|
| 2012 | Poland | Caucasian | Hospital | 133 | 100 | Colon cancer | 0.627 (Y) |
|
| 2013 | Poland | Caucasian | Hospital | 232 | 275 | Blood cancer | 0.266 (Y) |
|
| 2013 | USA | Mixed | Population | 329 | 397 | Breast cancer | 0.197 (Y) |
|
| 2013 | China | Asian | Population | 428 | 600 | Blood cancer | 0.764 (Y) |
|
| 2014 | Germany | Caucasian | Population | 460 | 545 | Blood cancer | 0.607 (Y) |
|
| 2015 | China | Asian | Hospital | 148 | 298 | Bone cancer | 0.000 (N) |
|
| 2015 | China | Asian | Hospital | 604 | 665 | Brain cancer | 0.000 (N) |
|
| 2015 | China | Asian | Hospital | 763 | 892 | Colon cancer | 0.398 (Y) |
|
| 2015 | Slovenia | Caucasian | Hospital | 79 | 373 | Bone cancer | 0.000 (N) |
|
| 2016 | Turkey | Caucasian | Population | 101 | 115 | Breast cancer | 0.147 (Y) |
|
| 2018 | China | Asian | Hospital | 342 | 345 | Laryngeal cancer | 0.081 (Y) |
|
| 2019 | Greece | Caucasian | Hospital | 17 | 57 | Nasopharyngeal cancer | 0.112 (Y) |
|
| 2020 | China | Asian | Mixed | 763 | 892 | Bladder cancer | 0.398 (Y) |
|
| 2021 | Greece | Caucasian | Hospital | 142 | 149 | Nasopharyngeal cancer | 0.707 (Y) |
|
| 2022 | Iran | Asian | Hospital | 50 | 50 | Blood cancer | 0.046 (N) |
|
| 2022 | Russia | Caucasian | Population | 208 | 244 | Lung cancer | 0.073 (Y) |
|
| ||||||||
|
| 2005 | Turkey | Caucasian | Mixed | 1609 | 3899 | Ovarian cancer | 0.117 (Y) |
|
| 2006 | UK | Caucasian | Population | 442 | 445 | Blood cancer | 0.935 (Y) |
|
| 2006 | China | Caucasian | Hospital | 421 | 423 | Breast cancer | 0.515 (Y) |
|
| 2007 | China | Asian | Hospital | 559 | 1125 | Breast cancer | 0.055 (Y) |
|
| 2009 | USA | Caucasian | Population | 196 | 203 | Breast cancer | 0.000 (N) |
|
| 2010 | USA | Mixed | Mixed | 513 | 893 | Lung cancer | 0.146 (Y) |
|
| 2010 | USA | Mixed | Mixed | 381 | 902 | Skin cancer | 0.110 (Y) |
|
| 2010 | USA | Mixed | Mixed | 225 | 902 | Head and Neck cancer | 0.110 (Y) |
|
| 2010 | USA | Mixed | Mixed | 148 | 150 | Bladder cancer | 0.024 (N) |
|
| 2010 | USA | Mixed | Mixed | 76 | 902 | Laryngeal cancer | 0.110 (Y) |
|
| 2012 | Slovenia | Caucasian | Hospital | 20 | 39 | Blood cancer | 0.465 (Y) |
|
| 2014 | Germany | Caucasian | Population | 458 | 545 | Blood cancer | 0.659 (Y) |
|
| 2015 | China | Asian | Hospital | 148 | 298 | Bone cancer | 0.000 (N) |
|
| 2018 | Slovenia | Caucasian | Hospital | 79 | 373 | Bone cancer | 0.000 (Y) |
|
| 2022 | Iran | Asian | Hospital | 50 | 50 | Blood cancer | 0.637 (Y) |
| rs1805794 (G > C) | Study number | Sample size | CC vs. GG | CC vs. CG + GG | CC + CG vs. GG | CG vs. GG | C vs. G | |||||
|---|---|---|---|---|---|---|---|---|---|---|---|---|
| OR [95% CI] |
| OR [95% CI] |
| OR [95% CI] |
| OR [95% CI] |
| OR [95% CI] |
| |||
|
| 67 | 53 086 | 1.06 [1.00–1.12] | .0645 | 1.13 [0.99–1.29] | .0784 | 1.05 [0.98–1.11] | .1631 | 1.07 [0.99–1.15] | .0862 | 1.1 [0.98–1.23] | .0993 |
|
| 56 | 47 230 | 1.05 [0.98–1.12] | .1673 | 1.09 [0.95–1.26] | .2188 | 1.04 [0.97–1.11] | .2831 | 1.05 [0.97–1.14] | .200 | 1.08 [0.96–1.21] | .210 |
|
| 16 | 15 111 | 1.00 [0.95–1.05] | .8995 | 0.99 [0.89–1.11] | .9126 | 1.01 [0.94–1.09] | .6942 | 1.01 [0.94–1.08] | .7773 | 0.99 [0.9–1.1] | .8712 |
|
| 6 | 7288 |
|
| 1.15 [0.98–1.33] | .0794 |
|
|
|
| 1.07 [0.93–1.24] | .3216 |
|
| 4 | 4378 | 0.95 [0.86–1.04] | .2454 | 0.85 [0.69–1.05] | .1326 | 1.0 [0.87–1.14] | .9645 | 0.97 [0.85–1.1] | .5842 | 0.85 [0.69–1.04] | .1123 |
|
| 2 | 1877 | 1.10 [0.96–1.26] | .1852 | 1.2 [0.9–1.61] | .2209 | 1.09 [0.89–1.33] | .4169 | 1.11 [0.92–1.35] | .2653 | 1.15 [0.88–1.52] | .3106 |
|
| 6 | 2823 | 1.01 [0.9–1.13] | .8595 | 0.88 [0.55–1.41] | .5945 | 1.05 [0.88–1.25] | .5748 | 1.05 [0.89–1.24] | .556 | 0.96 [0.67–1.38] | .8192 |
|
| 13 | 7877 | 1.1 [0.9–1.35] | .3458 | 1.47 [0.93–2.33] | .0981 | 1.03 [0.81–1.3] | .8288 | 1.11 [0.84–1.47] | .4478 | 1.34 [0.95–1.88] | .0992 |
|
| 2 | 721 | 1.09 [0.88–1.36] | .4201 | 0.98 [0.62–1.55] | .9351 | 1.48 [1.07–2.04] | .0179 | 1.33 [0.98–1.8] | .0634 | 0.8 [0.53–1.22] | .3029 |
|
| 4 | 3237 | 1.00 [0.9–1.11] | .9932 | 0.95 [0.77–1.18] | .6491 | 1.09 [0.94–1.27] | .2646 | 1.05 [0.91–1.22] | .4994 | 0.91 [0.75–1.11] | .3615 |
|
| 2 | 1066 | 1.01 [0.85–1.2] | .9332 | 1.12 [0.76–1.64] | .5691 | 0.9 [0.69–1.18] | .4495 | 0.94 [0.73–1.22] | .6572 | 1.15 [0.81–1.62] | .4379 |
|
| 2 | 2265 | 1.2 [0.79–1.82] | .3885 | 1.5 [0.91–2.47] | .1079 | 1.06 [0.62–1.81] | .8247 | 1.17 [0.65–2.11] | .5985 |
|
|
|
| 4 | 2585 |
|
|
|
|
|
|
|
| 1.85 [0.93–3.69] | .0800 |
|
| 2 | 898 | 1.06 [0.84–1.33] | .6346 | 2.65 [0.16–4.47] | .4941 | 0.96 [0.43–2.14] | .9225 | 0.96 [0.43–2.14] | .9225 | 2.94 [0.18–4.86] | .4488 |
|
| 4 | 2960 | 0.97 [0.7–1.33] | .8463 | 1.03 [0.46–2.29] | .9417 | 0.85 [0.62–1.16] | .3000 | 0.88 [0.59–1.31] | .5198 | 1.13 [0.59–2.19] | .7121 |
|
| ||||||||||||
|
| 15 | 15 109 | 1.22 [0.99–1.49] | .0589 | 1.53 [0.97–2.41] | .0683 | 1.2 [1.0–1.45] | .055 | 1.29 [0.99–1.68] | .0551 | 1.34 [0.97–1.84] | .0726 |
|
| 43 | 31 340 | 1.02 [0.98–1.05] | .3047 | 1.05 [0.97–1.14] | .2169 | 1.0 [0.95–1.05] | .9076 | 1.01 [0.97–1.06] | .5953 | 1.05 [0.95–1.16] | .3079 |
|
| 9 | 6637 | 0.98 [0.91–1.06] | .6483 | 0.93 [0.77–1.12] | .4292 | 1.1 [0.9–1.35] | .3654 | 1.06 [0.88–1.26] | .5513 | 0.9 [0.77–1.06] | .2051 |
|
| ||||||||||||
|
| 33 | 26 926 | 1.01 [0.95–1.09] | .713 | 1.02 [0.87–1.19] | .8149 | 1.02 [0.94–1.1] | .6443 | 1.02 [0.93–1.12] | .6755 | 1.02 [0.9–1.15] | .8110 |
|
| 32 | 22 969 |
|
|
|
| 1.07 [0.97–1.19] | .1787 | 1.12 [0.99–1.28] | .0679 | 1.2 [0.99–1.45] | .0695 |
|
| 2 | 3191 | 1.04 [0.94–1.15] | .4725 | 1.04 [0.83–1.29] | .7409 | 1.11 [0.95–1.29] | .1955 | 1.09 [0.94–1.26] | .2576 | 0.98 [0.81–1.2] | .8805 |
Peer Reviews
No public reviews on file for this paper yet. If you reviewed it on a platform where reviews are public (OpenReview, ICLR, NeurIPS, ICML), you can paste yours below so the community can read it here.
Videos
No videos yet. Explain this paper in a talk, walkthrough, or lecture? Add one.
Taxonomy
TopicsThyroid and Parathyroid Surgery · Protease and Inhibitor Mechanisms · HER2/EGFR in Cancer Research
Introduction
Cancer is the second leading cause of death, accounting for ∼10 million deaths annually [1]. It develops due to the accumulation of genetic mutations that disrupt normal cellular functions. The NBN (Nibrin) gene, also known by aliases such as Nijmegen breakage syndrome 1 (NBS1), p95 protein of the MRE11/RAD50 complex, ATV, plays a crucial role in DNA repair and maintaining genome stability [2]. At least 10 mutations in the NBN gene have been linked to NBS, a condition characterized by growth retardation, recurrent infections, and an increased risk of cancer. Several genome-wide association studies (GWAS) or individual genetic association studies (IGAS) have explored the association between NBN gene single nucleotide polymorphisms (SNPs) and cancer risk across various cancer types using case-control samples. However, findings have been inconsistent, likely due to various cancer types, control group selection, ethnic diversity, and limited sample sizes [3–8]. To achieve a more accurate and comprehensive assessment, researchers have conducted statistical meta-analysis that integrate all available GWAS findings [3–13].
Over time, numerous individual GWAS or IGAS analyses have been conducted to investigate the association between the NBN gene polymorphisms (rs1805794 and rs709816) and multiple cancer types. Studies have examined this association in various cancers, including bladder cancer [14–20], blood cancer [21–30], bone cancer [31, 32], brain cancer [33, 34], breast cancer [35–49], colon cancer [48, 50–52], laryngeal cancer [20, 53, 54], liver cancer [55], lung cancer [20, 56–60], kidney [61], nasopharyngeal cancer [62, 63], ovarian cancer [64], prostate cancer [65], skin cancer [20, 66, 67], and thyroid cancer [68]. However, the reported associations have been inconsistent, varies across studies due to differences in case-control sample sizes, ethnic populations, and types of cancers. To establish a consensus on these associations across different cancer types and ethnic subgroups, meta-analysis is a crucial tool for evaluating the role of NBN polymorphisms as potential biomarkers. Previous meta-analyses reported that the SNP rs1805794 is significantly associated with blood and nasopharyngeal cancers [3], lung cancer [4, 8], and bladder cancer [4, 5], but showed no significant association with overall cancer risk [3, 4], particularly breast cancer [4, 7], as well as ovarian and colon cancers [4] and bone cancer [6]. Similarly, meta-analysis findings for rs709816 indicated no significant association with the bone cancer risk [6]. Meta-analysis relies on pooled estimates from fixed-effect or random-effect models, which are chosen based on homogeneity analysis. However, heterogeneity depends on the sample sizes within each cancer group and subgroups, necessitating updates to meta-data and statistical methods to enhance reliability. Although rs1805794 and rs709816 have been extensively investigated in earlier studies, inconsistencies in reported associations across cancer types remain unresolved. Moreover, several previous meta-analyses were limited by smaller sample sizes, restricted subgroup analyses, or a lack of integrative bioinformatic interpretation. Therefore, further investigations incorporating larger datasets and advanced analytical approaches remain essential for refining the understanding of NBN gene polymorphisms in cancer susceptibility.
In this context, the present study aims to provide an updated and comprehensive evaluation by incorporating a larger pooled dataset, refined subgroup and meta-regression analyses, and complementary functional insights. While the relative saturation of studies on these polymorphisms may limit the discovery of novel associations, this updated synthesis offers a more robust and reliable assessment of their role in cancer susceptibility.
In this study, we have conducted a comprehensive statistical meta-analysis to establish a consensus on the association between NBN gene polymorphisms (rs1805794, rs709816) and multiple cancer risks, utilizing a larger pooled dataset, refined subgroup and meta-regression analyses, and complementary functional insights. While the relative saturation of studies on these polymorphisms may limit the discovery of novel associations, this updated synthesis offers a more robust and reliable assessment of their role in cancer susceptibility. We systematically collected all available single studies related to these NBN gene polymorphisms and applied updated statistical methods. Importantly, the association of the NBN gene with multiple cancer risks was investigated not only at the SNP level but also across other platforms, including microarray, RNA-seq, and so on. Consequently, our approach integrated both statistical meta-analysis and bioinformatics tools to provide a robust evaluation of the NBN gene’s role in cancer susceptibility.
Materials and methods
Collection of meta-data related to NBN gene polymorphisms and multiple cancers
Literature search strategy
We conducted text-mined data searches up to December 2024, focusing exclusively on English-language literature across PubMed, PubMed Central, Google Scholar, and Web of Science. Our search employed a structured combination of keywords related to NBN gene polymorphisms, including individual SNP identifiers (“rs1805794” and “rs709816”), variations (“E185Q,” “Glu185Glu,” “8360G > C,” “1197 T > C”), and their combinations with cancer-specific terms (“rs1805794, cancer,” “rs709816, cancer,” “NBN, rs1805794, rs709816,” “NBS1, rs1805794, rs709816”). The initial screening involved reviewing titles and abstracts to select relevant studies, followed by full-text assessments conducted by two authors, with disagreements resolved through consensus revisions. Additionally, the reference lists of included studies were manually checked to identify further relevant publications. This comprehensive approach ensures the thoroughness of our review, reduces bias, and promotes transparency and reproducibility in accordance with best practices for systematic reviews.
Eligibility criteria
We conducted the study based on the preferred reporting items for systematic reviews and meta-analyses (PRISMA) statements filed [69]. Also, this study was registered in PROSPERO (CRD420251034651). Initially, articles were screened and excluded based on their titles and abstracts if found irrelevant. Subsequently, studies were selected for the meta-analysis based on the following criteria: (i) the study investigated the association between NBN gene polymorphisms (rs1805794, rs709816) and cancer susceptibility, (ii) the study utilized a case-control or nested case-control design, and (iii) the study provided the necessary genotypic frequency information. Studies were excluded from the meta-analysis if they did not meet these specified criteria.
Data extraction and quality assessment
Two authors independently investigated the eligible study to compile the datasets. We gathered essential information from each qualifying study including first author, year of publication, country, ethnicity (Asian, Caucasian, and Mixed), source of control populations (Hospital-based, Population-based, Mixed), number of cases and controls, type of cancers, and genotypic frequencies. To verify the accuracy of the included study, we applied the Hardy-Weinberg equilibrium (HWE) test based on the control populations using Chi-square statistic. A study was deemed suitable for inclusion in the meta-analysis if the HWE test yielded a P value ≥.05.
Statistical meta-analysis
To accurately determine the association between the NBN gene polymorphisms (rs1805794, rs709816) and multiple cancer risks, we conducted a comprehensive statistical meta-analysis as follows. Initially, the accuracy of the studies included was verified using the HWE test, which was conducted using the Chi-square statistic. This test assessed the null hypothesis that the genotypic ratios under the control population were consistent, deeming a study suitable for meta-analysis if the P value was ≥.05.
We calculated the pooled odds ratio (OR) [70] and corresponding 95% confidence interval (CI) to assess the association between SNPs and cancer susceptibility. The pooled ORs were derived using either a fixed-effect (FE) or random-effect (RE) model, depending on the outcome of the heterogeneity analysis. The heterogeneity among the individual studies was evaluated by using Cochran’s Q-statistic [70, 71] and its extended Higgin’s and Thompson I^2^ statistic [70, 72]. Significant heterogeneity was indicated by a Q-test P value <.10 and an I^2^ value >50%. In cases of significant heterogeneity, the RE model was employed to estimate the pooled effect, otherwise, the FE model was utilized. The pooled ORs were calculated from genotypic case-control frequency datasets by using either the Mantel-Haenszel method [73] or the inverse variance method [74] for the FE or RE model, respectively.
The meta-data were analyzed using five different genetic models, such as (i) homozygote (CC vs. GG; CC vs. TT), (ii) recessive (CC vs. CG + GG; CC vs. CT + TT), (iii) dominant (CC + CG vs. GG; CC + CT vs. TT), (iv) heterozygote (CG vs. GG; CC vs. TT), and allelic contrast (C vs. G; C vs. T) models. The association between SNPs and cancer risk was visually represented in forest plots. Furthermore, subgroup analyses were conducted based on cancer types, ethnicity, and source of control populations to elucidate specific associations. To explore potential sources of heterogeneity, we conducted a meta-regression analysis using the RE model. Estimates were obtained using the restricted maximum likelihood (REML) method, and statistical significance was assessed with z-tests and 95% CI. The results were interpreted based on effect size estimates and their corresponding P values. Publication bias was assessed for each study both graphically, using funnel plots [75] and statistically, through Egger’s linear regression test [76] and Begg’s test [77]. These tests confirmed the absence of publication bias with P values >.05. Additionally, the sensitivity of meta-analysis results was tested by excluding studies that failed the HWE test. The methodological approach for conducting the meta-analysis is detailed extensively in the referenced study [10–13]. All the statistical analyses were performed using R-software (R × 64 3.5.2), supported by the “meta” package (http://meta-analysis-with-r.org/).
Bioinformatics analysis
To support the link of NBN-gene polymorphisms with multiple cancers identified by statistical meta-analysis, we considered bioinformatics analysis by using different web-tools and databases. We performed expression analysis of NBN gene through Box plots with multiple cancers based on the Gene Expression Profiling Interactive Analysis 2 (GEPIA2) database that combined the cancer genome atlas (TCGA) and genotype-tissue expression (GTEx) databases [78], to investigate the differential expression patterns in cancerous and normal tissues. In order to further verify the link of NBN-gene with multiple cancers by integrating relevant data from different sources, we performed a disease-gene association study through the DisGeNET database constructed based on the data sources including curated, inferred, animal models and literature review [79]. To investigate the common pathogenetic processes of the NBN gene with some other cancer-causing genes/proteins (IL6, BRCA1, ADIPOQ, IGF1, ACYP2, TERT, PALB2) [10, 80–86], common transcriptional and post-transcriptional regulators were disclosed through the interaction network analysis of those genes including NBN with the transcription factors (TFs) and microRNAs by using the databases ENCODE and miRTarBase, respectively, in the NetworkAnalyst [87]. Then, we explored cancer-related gene ontology (GO) terms and KEGG pathways by the enrichment analysis of those genes using some popular bioinformatics web tools (GeneCodis [88], DEVID, Enrichr [89], and ToppFun [90]). Thus bioinformatics analysis results might support the link of NBN-gene with multiple cancers.
Results
Meta-analysis results
Study characteristics
Initially, we reviewed 339 articles retrieved through an online databases search. After removing duplicates, 141 studies remained. Further screening led to the selection of 58 individual studies, with 74 studies excluded due to incomplete information. The flow diagram of the study selection process is illustrated in Fig. 1. The selected 58 studies were categorized based on NBN gene polymorphisms, with 54 studies utilizing 67 datasets for rs1805794 and 11 studies utilizing 15 datasets for rs709816. The final dataset comprised a total of 53 086 subjects (cases: 23 494; controls: 29 592) for rs1805794 and 16 474 subjects (cases: 5325; controls: 11 149) for rs709816 polymorphisms. The subjects in these datasets represented 16 types of cancer, including bladder, blood, bone, brain, breast, colon, head and neck, kidney, laryngeal, liver, lung, nasopharyngeal, ovarian, prostate, skin, and thyroid cancers, across three ethnic groups (Asian, Caucasian, and mixed). For estimating the meta effect, cancer types with only one available study, such as head and neck, kidney, liver, and thyroid cancers for rs1805794, as well as bladder, head and neck, laryngeal, lung, ovarian, and skin cancers for rs709816 polymorphisms, were grouped and named as the “other” category. The “other” cancer category was used to represent the group of single studies, rather than implying biological similarity among them. This group is heterogeneous and should not be interpreted as a biologically unified cancer category, and findings from this subgroup have therefore been interpreted with caution. The detailed dataset information is provided in Table 1.
Systematic dataset construction process for meta-analysis (data searching, screening, selecting); where “N” represents the number of studies and “n” denotes the sample sizes.
Quantitative synthesis of rs1805794 (G > C)
We performed a statistical meta-analysis for the rs1805794 SNP, which showed the insignificant association between NBN gene rs1805794 polymorphism and overall cancer risk under the all genetic models (CC vs. GG*:* OR =1.06, 95% CI = 1.00–1.12, *P = .*0645; CC vs. CG + GG: OR = 1.13, 95% CI =0.99–1.29, *P = .*0748; CC + CG vs. GG: OR =1.05, 95% CI = 0.98–1.11, *P = .*1631; CG vs. GG: OR =1.07, 95% CI = 0.99–1.19, *P = .*0862; C vs. G: OR = 1.10, 95% CI = 0.98–1.23, *P = .*0993; Table 2 and Fig. 2, Figs. S1–S4). Although the association with overall cancer risk was statistically insignificant, all the ORs were greater than the null value (OR = 1), suggesting statistical significance was not achieved, and the null hypothesis cannot be rejected. Subgroup analysis by cancer types revealed a significant association with increasing the risk between rs1805794 and bladder cancer under three genetic models (CC vs. GG: OR = 1.09, *P = .*0193; CC + CG vs. GG: OR = 1.13, *P = .*0186; CG vs. GG: OR = 1.13, *P = .*0110), and with nasopharyngeal cancer under all genetic models (CC vs. GG: OR = 1.56, *P = .*0120; CC vs. CG + GG: OR = 2.28, *P = .*0342; CC + CG vs. GG: OR = 1.58, *P = .*0001; CG vs. GG: OR = 1.98, *P = .*0001). However, this polymorphism showed an insignificant association with other cancer types under any genetic models (Table 2). Subgroup analysis by ethnicity indicated that rs1805794 polymorphism was not significantly associated with overall cancer risk in Asian, Caucasian, or mixed populations under any genetic models (Table 2). When analyzed based on the source of the control population, the hospital-based subgroup showed a significant association with overall cancer risk under two genetic models (CC vs. GG: OR = 1.11, *P = .*0461; CC vs. CG + GG: OR = 1.27, 0.0410), whereas no significant association was observed for population-based controls (Table 2).
The association between rs1805794 polymorphism and cancer risk by showing the Forest plot under allelic comparison (C vs. G) with different ethnic populations. The square represents the ORs with their weighted size, the parallel lines indicate 95% CI, and the diamond plot indicates the overall or estimate.
Quantitative synthesis of rs709816 (T > C)
The meta-analysis results indicated a significant association between NBN gene rs709816 polymorphism and overall cancer risk under a single genetic model (CC vs. TT: OR = 0.95, *P = .*0469) (see Table 2, Fig. 3, Figs. S5–S8). The subgroup analysis by cancer types revealed a significant association with decreasing the risk between rs709816 and breast cancer under a single genetic model (CC vs. TT: OR = 0.88, *P = .*0362). However, this polymorphism showed an insignificant association with the rest of the specific cancer subgroups. Subgroup analysis by ethnicity revealed no significant association between rs709816 and overall cancer in any population, except for the mixed population under the allelic model (C vs. T: OR = 0.87, *P = .*0440; Table 2). When analyzed based on the source of the control population, a significant association was observed in the hospital-based population under the recessive model (CC vs. CT + TT), while no significant association was found in population-based controls (Table 2).
The association between rs709816 polymorphism and cancer risk by showing the Forest plot under allelic comparison (C vs. T) with different ethnic populations.
Source of heterogeneity
We observed the significant heterogeneity of NBN gene rs1805794 polymorphism for overall cancer risk through all the genetic models (CC vs. GG: Q = 316.04, df = 66, *P = .*0001, I^2^ = 79.1%; CC+CG vs. GG: Q = 218.77, df = 66, *P = .*0001, I^2^ = 69.8%; CG vs. GG: Q = 139.33, df = 66, *P = .*0001, I^2^ = 52.6%; C vs. G: Q = 328.03, df = 66, *P = .*0001, I^2^ = 79.9%; Table S1). The subgroup of blood, brain, nasopharyngeal, and other cancers with the ethnicity of Asian and Caucasian, as well as HB and PB control populations, showed the main sources of heterogeneity. To specify the potential sources of heterogeneity across various genetic models (C vs. G, CC vs. GG, CG vs. GG, CC + CG vs. GG, CC vs. CG + GG), we conducted a meta-regression analysis within the subgroup characterized by high I^2^ (>50%) values. The results for the overall cancer group indicated that ethnicity, cancer type, and case-control ratio significantly contributed to heterogeneity in specific models (Table S2, Fig. S9). Among cancer types, liver cancer demonstrated a significant negative association with effect size across multiple models, particularly in the C vs. G (*P < .*001), CC vs. GG (*P < .*001), CG vs. GG (*P < .*001), CC + CG vs. GG (*P < .*001), and CC vs. CG + GG (*P = .*012) models. This suggests that genetic effects in rs1805794 may vary depending on the cancer type (Table S2, Fig. S9). Ethnicity (Caucasian and mixed populations) also appeared as a key factor influencing effect size across several models, with significant associations in the C vs. G, CC vs. GG, CG vs. GG, and CC + CG vs. GG models (*P < .*05 for all comparisons) (Table S2, Fig. S9). In subgroup analyses, ethnicity remained a significant moderator in the blood cancer and HB subgroups, while the case-control ratio was a significant factor in the Asian and blood cancer subgroups (*P < .*05). No significant moderators were identified in the PB subgroup (Table S2, Fig. S9). The NBN gene rs709816 polymorphism did not exhibit significant heterogeneity for overall cancer risk or across all subgroups, which may be attributed to the small number of individual studies included in the analysis. All the heterogeneity results are shown in Tables S1 and S2.
Publication bias
The publication bias of the eligible studies was assessed visually using funnel plots (Fig. 4) for the rs1805794 and rs709816 polymorphisms under two respective genetic combinations (C vs. G; CC vs. GG; C vs. T; CC vs. TT). The symmetry of funnel plots indicated no apparent publication bias. Further statistical validation using Begg’s test (C vs. G: *P = .*8342; CC vs. GG: *P = .*9374; C vs. T: *P = .*4106; CC vs. TT: *P = .*2171; Table S3) confirmed the absence of publication bias for both polymorphisms. However, Egger’s test (C vs. G: *P = .*6494; CC vs. GG: *P = .*5127; C vs. T: *P = .*0211; CC vs. TT: *P = .*0223; Table S3) suggested that while rs1805794 showed no publication bias, rs709816 exhibited bias under the allelic (C vs. T) and homozygote (CC vs. TT) models.
Funnel plots assessing publication bias in studies examining polymorphisms in the NBN gene. Each plot uses the standard error to evaluate the asymmetry in the distribution of odds ratios from individual studies, indicating the absence of publication bias. Panel (A) shows rs1805794 for the C vs. G allele comparison, (B) for the CC vs. GG genotype comparison, (C) for rs709816 C vs. T allele comparison, and (D) for the CC vs. TT genotype comparison. Each circle represents an individual study, and the dashed lines indicate the expected distribution under no publication bias.
Sensitivity analysis
We conducted a sensitivity analysis to assess robustness of our findings and the reliability of this meta-analysis. The overall cancer risk was evaluated using two datasets: (i) including all eligible studies and (ii) excluding studies that did not confirm HWE testing (Table 2). Although the overall estimates remained largely consistent between the two datasets, several associations were modest in magnitude and in some cases approached borderline statistical significance, suggesting that the observed effects may be relatively weak. Furthermore, potential publication bias, particularly for rs709816, as indicated by Egger’s test, may have influenced these results. Therefore, while the sensitivity analysis supports the overall stability of the findings, the associations should be interpreted cautiously and considered exploratory rather than definitive.
False positive report probability (FPRP) and power analyses
To evaluate the reliability of the meta-analysis findings and assess the likelihood of false-positive associations, we conducted a false-positive report probability (FPRP) analysis. In the experiment, the biological importance parameter using a prior probability (π) of 0.01, and the FPRP threshold was 0. 2 [94]. An OR of 1.5 was considered for increasing risk, while an OR of 0.67 was used for a protective effect, allowing us to estimate the statistical power and FPRP [95]. Previous studies suggest that an OR of 1.5 and an FPRP of 0.2 serve as plausible thresholds for detecting a biologically significant effect [96–98]. The results of our analysis confirmed that the rs1805794 SNP was significantly associated with an increased risk of nasopharyngeal and brain cancers (Table S4).
Bioinformatics results
To support the findings of statistical meta-analysis results and provide additional biological context regarding the potential role of NBN in multiple cancers, we performed an exploratory bioinformatics analysis using multiple online public databases and computational tools. In order to investigate the association types (direct/indirect) of NBN gene with breast, head and neck, bladder and brain cancers detected by meta-analysis, expression analysis was performed. Box-plots analysis (Fig. 5) showed significant mean/median expression differences between some cancers and normal tissues, suggesting that NBN gene might be directly associated with different cancers (BRCA, COAD, DLBC, HNSC, LAML, LIHC, LGG, SKCM), though expression patterns varied across cancer types. These results indicate that NBN gene may be directly/indirectly associated with the breast cancer (BRCA) and head and neck cancer (HNSC), but indirectly associated with the bladder and brain cancers. Thus, expression analysis of NBN gene further clarify the types of association with different cancers detected by the meta-analysis. The disease-gene network analysis (Fig. 6A and Table S5) indicated that the NBN gene is significantly associated with various cancer-related disease including bladder, nasopharyngeal, brain, BRCA1, ADIPOQ, IGF1, ACYP2, TERT, and PALB2 that also supported the meta-analysis results. The gene regulatory network analysis identified 4 transcription factors (TP53, FOXL1, FOXC1, and YY1) as the transcriptional regulators that are involved in DNA damage repair, cell cycle regulation, and tumor suppression (Fig. 6B) [99–102], and four microRNAs (hsa-mir-192-5p, hsa-mir-215-5p, and hsa-mir-132-3p) as the post-transcriptional regulators that might regulate NBN gene for the development and progression of different cancers (Fig. 6C) [103–105]. The functional enrichment analyses with GO-terms and KEGG-pathways revealed some crucial mechanisms of NBN gene that are associated with the development and progression of multiple cancers (Table S6). This analysis confirmed that NBN is significantly involved in vital DNA repair pathways such as homologous recombination, non-homologous end joining (NHEJ), DNA replication, and telomere maintenance, while also interacting with tumor suppressor p53 signaling [106–121]. The enrichment of molecular functions, including protein binding, damaged DNA binding, and protein N-terminus binding, alongside its localization in critical cellular components such as the PML body, telomeric region, nucleoplasm, and Mre11 complex, emphasizes its essential role in genomic stability. KEGG pathway analysis further highlighted homologous recombination and cellular senescence among the pathways associated with NBN, suggesting that NBN-related networks may be relevant to cancer biology. Collectively, these exploratory findings provide biological plausibility for the genetic associations observed in the meta-analysis, while emphasizing that experimental and clinical validation is required to determine causal mechanisms or potential biomarker/therapeutic relevance.
Differential expression of the NBN gene across multiple cancer types compared to control groups. Rectangle boxes denote the median and interquartile ranges of expression levels in cancer and control samples. Data were analyzed and visualized using the GEPIA-2 web server, with a log2 fold change cutoff of 0.5 and a significance level (P-value) of .05. Asterisks () above the boxes signify statistically significant differences from control groups. Figure represents different cancer types, including bladder urothelial carcinoma (BLCA), breast invasive carcinoma (BRCA), colon adenocarcinoma (COAD), diffuse large B-cell lymphoma (DLBC), head and neck squamous cell carcinoma (HNSC), acute myeloid leukemia (LAML), liver hepatocellular carcinoma (LIHC), lower grade glioma (LGG), lung adenocarcinoma (LUAD), lung squamous cell carcinoma (LUSC), ovarian serous cystadenocarcinoma (OV), prostate adenocarcinoma (PRAD), sarcoma (SARC), and skin cutaneous melanoma (SKCM). tumor (T) and normal (N) sample sizes are indicated below each cancer type.*
Comprehensive interaction networks highlighting the role of the NBN gene in cancer. (A) Disease-gene interaction network, mapping the association of NBN with various cancers, demonstrating its broad impact across cancer types. The green circular node represents the NBN gene, while pink circular nodes denote associated diseases or cancer phenotypes. (B) Transcription factor network, identifying TFs like TP53 and FOXL1 that regulate NBN and other cancer-related genes, underscoring their central role in gene regulation, where green diamond-shaped nodes represent cancer-associated genes (NBN, TERT, ACYP2, ADIPOQ, IGF1, BRCA1, PALB2, IL6), and pink rectangular nodes represent transcription factors (TFs) regulating these genes. (C) miRNA interaction network, showing miRNAs such as hsa-mir-192-5p that target NBN and other genes, highlighting their importance in post-transcriptional regulation. Green diamond-shaped nodes indicate target genes, and pink rectangular nodes represent miRNAs involved in post-transcriptional regulation. Edges indicate regulatory or interaction relationships. Collectively, these networks provide a systems-level view of NBN-centered interactions across disease associations, transcriptional control, and post-transcriptional regulation in oncogenesis.
Discussion and conclusion
At first, we tried to make a consensus decision about the association of NBN gene polymorphisms (rs1805794, rs709816) with multiple cancer risks by placing the emphasis on a larger sample size and appropriate statistical modeling and comparing with the previous meta-analysis results. To do it, we collected all available datasets through an online database search and previous meta-analyses, resulting in a larger sample size than existing studies [3–8]. We performed a statistical meta-analysis based on 58 single GWAS findings, which included 23 494 and 5325 cases and 29 592 and 11 149 control samples for rs1805794 (8360 G > C) and rs709816 (1197 T > C) polymorphisms, respectively. This meta-analysis suggested that the C allele of rs1805794 polymorphism is not statistically significantly associated with overall cancer risk under all the genetic models, which is consistent with previous meta-analysis reports [3, 4]. However, the C allele of NBN gene rs709816 polymorphism shows a significant association with overall cancer risk under only one genetic model (CC vs. TT). The observed association for rs709816 under the CC vs. TT model should be interpreted with caution, as it is marginally significant, uncorrected for multiple testing, indicating that the finding is exploratory rather than conclusive. Subgroup analysis based on ethnicity indicates that the C allele of both rs1805794 and rs709816 polymorphisms is not significantly associated with overall cancer for all populations and genetic models, except the mixed population for rs709816 under the allelic model only. These findings are partially supported by previous meta-analyses [3, 4]. In the cancer-specific subgroup analysis, the C allele of rs1805794 is significantly associated with increasing the risk of bladder cancer under three genetic models, which is aligned by the previous report [5]. Additionally, the C allele of rs1805794 is significantly associated with nasopharyngeal cancer risk under four genetic models, findings are supported by a previous study [3], and brain cancer risk for only allelic model (C vs. G). Moreover, the C allele of rs709816 polymorphism shows a significant association with breast cancer risk under the homozygote model (CC vs. TT), while it is insignificantly associated with bone cancer, both association statuses are consistent with the previous meta-analysis report [6]. Another study reported that NBN mRNA expression was significantly upregulated in peripheral blood cells (PBCs) of patients with hereditary breast and ovarian cancer (HBOC) compared with healthy controls [122], and that NBN expression was positively correlated with BRCA1, PALB2, and BARD1. Notably, increased BRCA1 expression was also observed in BRCA-associated breast cancer tissues compared with normal breast cells [122, 123], suggesting that NBN may act as a co-regulatory gene in breast cancer. Subgroup analysis based on the source of the control population shows a significant association with overall cancer for the hospital-based control populations. Though previous studies reported significant associations between rs1805794 and lung or blood cancer [4, 8], our updated analysis did not confirm these associations. This meta-analysis demonstrated the inclusion of additional datasets and improved statistical power that reduced the influence of study-specific effects. This suggests that earlier positive findings may have been driven by limited sample sizes or population-specific factors. Therefore, our results provide a more refined and updated consensus on the role of NBN polymorphisms in cancers, emphasizing cancer-type–specific effects rather than overall associations.
Publication bias analysis is used to evaluate whether the published studies included in this meta-analysis are systematically skewed toward significant results, which could distort the true effect estimate. Although funnel plot symmetry and Begg’s test suggested no publication bias for either polymorphism, Egger’s test indicated potential bias for rs709816 under the allelic (C vs. T) and homozygote (CC vs. TT) models. This discrepancy may be attributable to the limited number of included studies and the higher sensitivity of Egger’s test to small study effects. Therefore, the association results for rs709816 under these models should be interpreted with caution. Therefore, this study incorporated a larger dataset and a refined statistical approach, including FPRP analysis and meta-regression, enabling the investigation of statistical power and a systematic assessment of potential confounders and subgroup-specific effects. While previous meta-analyses [3–8] have reported mixed findings, this study’s results emphasize the importance of considering heterogeneity sources when evaluating genetic associations. By accounting for population-specific effects and study design factors, this study offers a more comprehensive perspective on the role of NBN gene polymorphisms in cancer susceptibility.
To complement the statistical meta-analysis and gain deeper biological insights, we conducted a bioinformatics analysis that provided supportive evidence for an association of NBN with multiple cancer types, including bladder, nasopharyngeal, brain, prostate, and breast cancers. Differentially expressed genes (DEGs) identified between cancer and control groups are often directly/indirectly associated with cancer development or progression [124, 125]. Some non-DEGs between cancer and control groups are indirectly associated with the development or progression of cancer [126, 127]. Interaction network analysis identified key transcriptional regulators (TP53, FOXL1, FOXC1, and YY1) [99–102] and microRNAs (hsa-miR-192-5p, hsa-miR-215-5p, and hsa-miR-132-3p) [103–105]. These TFs and miRNAs are notable because they act as key regulatory hubs by potentially regulating the expression of the NBN gene through transcriptional and post-transcriptional mechanisms, thereby influencing critical cancer-related processes such as DNA damage repair, cell cycle regulation, apoptosis, and tumor progression. Functional enrichment analyses further indicated that NBN is enriched in DNA repair–related pathways, including homologous recombination and non-homologous end joining (NHEJ), as well as cellular senescence, which is consistent with its established role in maintaining genomic stability. However, these bioinformatics findings are exploratory and do not establish causality or clinical relevance.
These findings may contribute to a better understanding of the potential role of NBN polymorphisms in cancer susceptibility and could inform future hypothesis-driven research on genetic risk stratification [122, 123]. In addition, the identification of regulatory factors associated with NBN highlights candidate pathways for further functional investigation, particularly in cancers characterized by impaired DNA repair mechanisms [128]. Future studies integrating NBN genetic variation with experimental and clinical data will be necessary to clarify their biological relevance and to determine whether such associations have any translational significance in precision oncology. While previous studies have demonstrated that genetic variants and differentially expressed genes can serve as diagnostic [129–133] or prognostic [134–136] biomarkers in cancer [133, 136, 137], the findings of the present study should be regarded as associative and exploratory, highlighting potential biological relevance rather than established clinical utility.
Although rs1805794 and rs709816 are not classified as highly deleterious variants, they are located in functionally relevant regions of the NBN gene and may influence gene regulation or protein activity involved in DNA damage repair. Current evidence suggests that these polymorphisms exert modest biological effects, potentially modifying cancer susceptibility through subtle regulatory mechanisms rather than direct loss of function. However, functional validation studies remain limited, and further experimental investigations are needed to clarify their precise molecular roles. This study provides an updated and comprehensive evaluation of NBN polymorphisms across multiple cancer types, the findings should be interpreted with caution. While the meta-analysis has several strengths, certain limitations may impact the final findings. The primary limitations include: (i) a limited number of datasets for certain cancer types, which may reduce the statistical power of the associations, (ii) the absence of some cancer types, potentially influencing the overall assessment of gene polymorphisms and overall cancer risk, (iii) unaccounted heterogeneity factors, such as age, sex, smoking, alcohol consumption, dietary habits, and environmental exposures, which may introduce variability and impact the associations observed, (iv) given the large number of genetic models, subgroup analyses, and cancer types evaluated, multiple statistical comparisons were performed, increasing the potential for false-positive results, and (v) some subgroup associations observed for specific cancer types, may be influenced by multiple testing, and therefore should be interpreted cautiously as exploratory rather than definitive findings. Additionally, (i) the further limitation is that gene–gene and gene–environment interactions were not examined, and therefore the complex multifactorial nature of cancer susceptibility may not be fully captured by single-gene association analyses, and (ii) the bioinformatics analyses, including differential expression and regulatory network predictions, indicate potential associations but do not establish causal or mechanistic relationships, as the identified transcription factor and miRNA interactions are computationally inferred and require experimental validation.
In conclusion, this study integrates meta-analysis and bioinformatics to assess the association between NBN gene polymorphisms and cancer risk. The statistical meta-analysis confirmed significant associations, particularly with bladder, nasopharyngeal, brain, and breast cancers, while subgroup analyses highlighted population-specific effects. Bioinformatics analysis further validated these findings, showing NBN’s enrichment in DNA repair pathways and its regulation by key transcription factors (TP53, FOXL1, FOXC1, YY1) and microRNAs (hsa-miR-192-5p, hsa-miR-215-5p, hsa-miR-132-3p). However, these findings should be interpreted cautiously, as several associations are modest and exploratory, and the bioinformatics results are based on computational inference rather than experimental validation. Overall, this work offers an updated synthesis of existing evidence on NBN polymorphisms in cancer risk, while underscoring the need for further large-scale and functional studies to clarify their biological and clinical relevance.
Supplementary Material
bpag012_Supplementary_Data
The reference list from the paper itself. Each links out to its DOI / PubMed record.
- 1Ferlay J , Ervik M, Lam F et al Global Cancer Observatory: cancer today. Int Agency Res Cancer 2020;68:212–3.
- 2Huret J-L , Ahmad M, Arsaban M et al Atlas of genetics and cytogenetics in oncology and haematology in 2013. Nucleic Acids Res 2013;41:D 920–4. 10.1093/nar/gks 108223161685 PMC 3531131 · doi ↗ · pubmed ↗
- 3He Y-Z , Chi X-S, Zhang Y-C et al NBS 1 Glu 185Gln polymorphism and cancer risk: update on current evidence. Tumour Biol 2014;35:675–87. 10.1007/s 13277-013-1093-423979977 · doi ↗ · pubmed ↗
- 4Gao P , Ma N, Li M et al Functional variants in NBS 1 and cancer risk: evidence from a meta-analysis of 60 publications with 111 individual studies. Mutagenesis 2013;28:683–97. 10.1093/mutage/get 04824113799 · doi ↗ · pubmed ↗
- 5Zhang Y , Huang Y-S, Lin W-Q et al NBS 1 Glu 185Gln polymorphism and susceptibility to urinary system cancer: a meta-analysis. Tumour Biol 2014;35:10723–9. 10.1007/s 13277-014-2346-625073514 · doi ↗ · pubmed ↗
- 6Mehdinejad M , Sobhan MR, Mazaheri M et al Genetic association between ERCC 2, NBN, RAD 51 gene variants and osteosarcoma risk: a systematic review and meta-analysis. Asian Pac J Cancer Prev 2017;18:1315–21. 10.22034/APJCP.2017.18.5.131528610420 PMC 5555541 · doi ↗ · pubmed ↗
- 7Yao F , Fang Y, Chen B et al Association between the NBS 1 Glu 185Gln polymorphism and breast cancer risk: a meta-analysis. Tumour Biol 2013;34:1255–62. 10.1007/s 13277-013-0668-423381647 · doi ↗ · pubmed ↗
- 8Fang W , Qiu F, Zhang L et al The functional polymorphism of NBS 1 p.Glu 185Gln is associated with an increased risk of lung cancer in Chinese populations: case-control and a meta-analysis. Mutat Res 2014;770:61–8. 10.1016/j.mrfmmm.2014.07.00925771871 · doi ↗ · pubmed ↗