A practical and nuanced framework for entity linking evaluation
Fuqi Xu, Goran Nenadic, Robert Stevens

TL;DR
This paper introduces a new framework for evaluating entity linking systems that considers semantic relationships and hierarchical structures, leading to more accurate assessments.
Contribution
A novel entity linking evaluation framework that incorporates hierarchical structures and shifts focus from text-level matching to semantic comparison.
Findings
The framework emphasizes hierarchical vocabulary structures and semantic comparison for better evaluation.
Results show the importance of aligning metrics with application-specific needs.
Structured hierarchical error analysis is provided for entity linking.
Abstract
Entity linking maps textual mentions with entities in vocabularies. While accuracy is the primary metric for entity linking evaluation, it fails to capture the complexity of model behaviour. We propose an entity linking evaluation framework that clarifies the target objects of metrics calculation, incorporates term hierarchy, generates performance profiles, and summarises them as model characteristics. The framework emphasises hierarchical vocabulary structures, shifting the focus from text-level label matching to semantic comparison between concepts. We illustrate the competence and utility of this framework through a case study on disease entity linking. Our results highlight the importance of aligning evaluation metrics with application-specific requirements, and provide structured hierarchical error analysis for entity linking, paving the way for more nuanced and practical…
Genes, proteins, chemicals, diseases, species, mutations and cell lines named across the full text — each resolved to its canonical identifier and authoritative record.
Click any figure to enlarge with its caption.
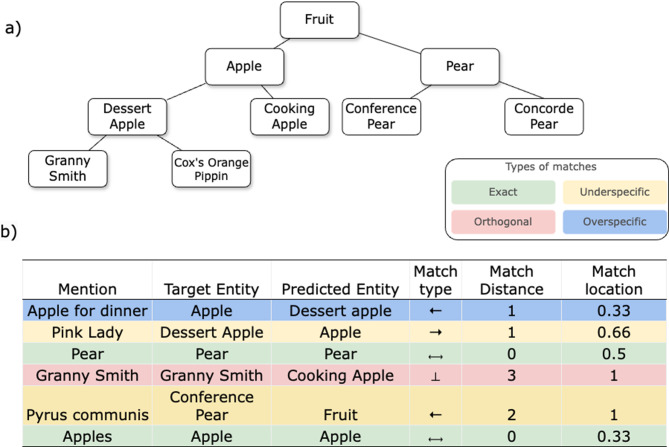 Figure 1
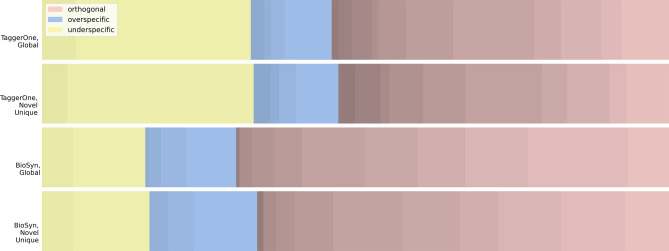 Figure 2
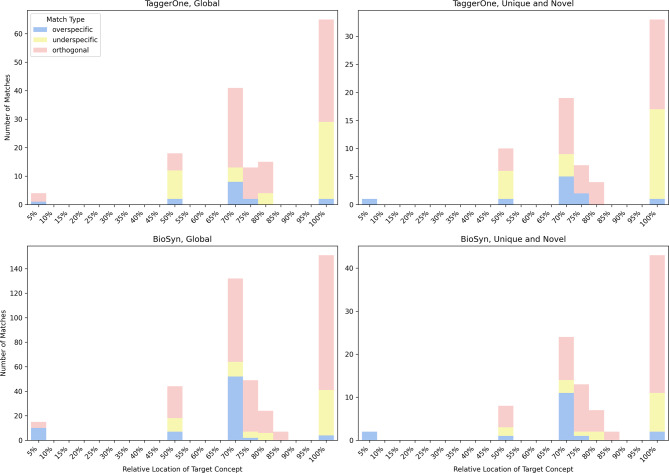 Figure 3
 Figure 4
Peer Reviews
No public reviews on file for this paper yet. If you reviewed it on a platform where reviews are public (OpenReview, ICLR, NeurIPS, ICML), you can paste yours below so the community can read it here.
Videos
No videos yet. Explain this paper in a talk, walkthrough, or lecture? Add one.
Taxonomy
TopicsBiomedical Text Mining and Ontologies · Topic Modeling · Natural Language Processing Techniques
Background
Entity linking (EL), also known as entity normalisation or disambiguation, maps mentions, i.e., specific occurrences of text within documents, to entities in established vocabularies [13]. EL typically follows named entity recognition (NER), where NER models identify relevant spans and EL models link these spans to entities in structured vocabularies [5]. EL systems learn semantic patterns from training datasets and are evaluated on test datasets using metrics such as accuracy, i.e., the percentage of mention-entity pairs that precisely match those in the test data.
Multiple approaches have been used to evaluate entity linking, including standard metrics such as F1, macro- and micro-accuracy, and the least common ancestor F-score, which accounts for partial correctness [15]. Although accuracy remains the primary metric for EL benchmarking, model comparison, and selection [5, 7, 13], a single numeric score cannot fully represent a model’s behaviour [19]. First, models with similar overall scores may exhibit distinct linking patterns. For example, some models may prioritise recall while others emphasise precision [5, 7, 13],1 or a model may achieve strong overall performance while consistently mislinking entities in specific domains. As a result, marginal differences in scores may not reflect meaningful distinctions in model behaviour. Second, performance can vary for the same model on the same dataset depending on the experimental setup.^1^
Effective biomedical entity linking evaluation should account for hierarchical vocabularies, where entities are organised across multiple levels of abstraction. Standard accuracy metrics do not capture whether a model preserves these relationships, which are often crucial for downstream reasoning and task-specific decisions. In practice, the appropriate level of specificity varies by use case. For example, the mention “Granny Smith” may need to be linked to a specific cultivar in an agricultural database, where fine-grained distinctions matter, whereas in a retail system, it may be linked to a broader category such as Fruit for inventory management. These domain-specific preferences reflect differences in how hierarchical structures are interpreted and used. To address this, entity linking should be evaluated from multiple perspectives, with metrics selected to suit the goals of each application. Incorporating these considerations into model evaluation allows systems to better align with real-world needs.
This paper addresses key challenges in entity linking evaluation by introducing a hierarchy-aware assessment framework, refining generalisation analysis through representative evaluation sets, and supporting task-specific metric selection.
Scope
A rigorous evaluation of entity linking should assess every stage of the process. This paper focuses on challenges in test dataset representativeness and performance assessment within hierarchical vocabularies. Key issues are discussed in this section, while proposed solutions are presented in the Results section.
Challenge 1: Representativeness of the test dataset
Many EL models exhibit poor generalisability to real-world scenarios [10, 24] due to data drift and distributional change [8]. The representativeness of test datasets can affect a model’s generalisation and adaptivity [23]. One key issue is repetition, where performance metrics are skewed towards frequently occurring mentions rather than unique ones. For example, in the BC5CDR dataset, only 653 out of 4,363 disease mentions are unique, illustrating the prevalence of repetition. Furthermore, test datasets are often small, covering only 0.03% to 0.60% of the corresponding vocabularies.2 These limitations are further exacerbated by overlaps among training, development, and test sets, where many mentions or entities reappear. For instance, Garda et al. [7] found that novel mentions, those absent from the training and development sets, constitute only 4.06% to 19.79% of test sets in common benchmarking datasets. Our analysis of popular datasets3 similarly shows that model performance correlates with training-set coverage. Such overlaps and duplications can inflate metrics, as models may succeed due to overfitting rather than actual contextual resolution.
Challenge 2: Consistent formats and processing strategies
Another issue refers to EL output formats, in which some entity linking models outputs recognised entities without exact text span mappings [22], making it difficult to separate NER outputs from entity linking results. Structured formats like PubTator [25] facilitate this separation by including start and end indices, selected text, and identified entities for each document. This allows EL evaluation to be performed using spans that exactly match gold-standard annotations, which is especially useful when mentions appear multiple times.
A consistent approach is also needed for edge cases, such as unlinked text spans, spans linked to multiple entities, or entities linked to a single multi-term expression [27].4 Without a standard dataset processing approach, cross-model comparisons are unreliable, compromising both model evaluation and selection.
Challenge 3: Hierarchically arranged entities
In specialised domains such as biomedicine, entity linking typically maps to structured vocabularies, such as MeSH [18], or the Open Biological and Biomedical Ontologies (OBO) [21], where hierarchical relationships (e.g., is-a), organise concepts at varying levels of granularity. Current accuracy-based metrics classify a match solely based on whether it exactly matches the entity in the test dataset, ignoring the vocabulary’s hierarchical structure and variations in specificity among entities. A more informative evaluation should consider parent-child relationships and the broader semantic context of a mention [1, 3]; for example, in a hierarchical vocabulary, mapping text “Granny Smith” to entity Fruit (instead of Apple) may be contextually acceptable despite lacking specificity.
Challenge 4: Hits and misses
In addition to evaluating performance on a specific dataset, a comprehensive assessment should test how well an EL model generalises to other datasets and real-world applications. Capturing both the strengths and weaknesses of a model across diverse evaluation settings offers a clearer picture of its robustness and applicability beyond the dataset it was trained on. This perspective also helps researchers and practitioners diagnose model failures and prioritise metrics that align with their specific objectives.
Methods
We define entity linking as a function \documentclass[12pt]{minimal} \usepackage{amsmath} \usepackage{wasysym} \usepackage{amsfonts} \usepackage{amssymb} \usepackage{amsbsy} \usepackage{mathrsfs} \usepackage{upgreek} \setlength{\oddsidemargin}{-69pt} \begin{document}$$ f: \mathcal{M} \rightarrow \mathcal{O} $$\end{document} , which maps a set of textual mentions \documentclass[12pt]{minimal} \usepackage{amsmath} \usepackage{wasysym} \usepackage{amsfonts} \usepackage{amssymb} \usepackage{amsbsy} \usepackage{mathrsfs} \usepackage{upgreek} \setlength{\oddsidemargin}{-69pt} \begin{document}$$ \mathcal{M} = \{m_1, m_2, \dots, m_n\} $$\end{document} to a set of entities within a vocabulary \documentclass[12pt]{minimal} \usepackage{amsmath} \usepackage{wasysym} \usepackage{amsfonts} \usepackage{amssymb} \usepackage{amsbsy} \usepackage{mathrsfs} \usepackage{upgreek} \setlength{\oddsidemargin}{-69pt} \begin{document}$$ \mathcal{O} = \{E_0, E_1, \dots, E_k\} $$\end{document} . For each mention mi, the function \documentclass[12pt]{minimal} \usepackage{amsmath} \usepackage{wasysym} \usepackage{amsfonts} \usepackage{amssymb} \usepackage{amsbsy} \usepackage{mathrsfs} \usepackage{upgreek} \setlength{\oddsidemargin}{-69pt} \begin{document}$$ f(m_i) = E_j $$\end{document} assigns the corresponding entity Ej from \documentclass[12pt]{minimal} \usepackage{amsmath} \usepackage{wasysym} \usepackage{amsfonts} \usepackage{amssymb} \usepackage{amsbsy} \usepackage{mathrsfs} \usepackage{upgreek} \setlength{\oddsidemargin}{-69pt} \begin{document}$$ \mathcal{O} $$\end{document} . The evaluation of entity linking checks the relationship between target entities \documentclass[12pt]{minimal} \usepackage{amsmath} \usepackage{wasysym} \usepackage{amsfonts} \usepackage{amssymb} \usepackage{amsbsy} \usepackage{mathrsfs} \usepackage{upgreek} \setlength{\oddsidemargin}{-69pt} \begin{document}$${E_t}$$\end{document} and the predicted entities Ep.
We adopt terminology from the Web Ontology Language (OWL) recommendations [2] to develop the evaluation metrics. The distance between a target entity Et and a predicted entity Ep is the shortest path connected by the subclassOf relationship. The ancestor entities of Et are those with Et as a direct or indirect subclass. Its parent entity has a distance of 1. Similarly, descendant entities are subentities of Et, with child entities being the immediate subentities. For orthogonal entities, their lowest common ancestor is the most granular entity containing both Et and Ep as subsets. The depth of an entity is defined as the shortest distance to the root and represents its granularity [26].5
The proposed metrics were tested on two entity linking models, TaggerOne [16] and BioSyn [14] on the BC5CDR disease dataset [17]. TaggerOne is an early model that employs semi-Markov classifiers and learns from lexical information, while BioSyn is a transformer-based model designed for synonym resolution. These models were selected for their distinct mechanisms in entity linking, potentially yielding different performance behaviours.6 In this evaluation, we focused on the performance of the entity linking set, isolating it from the impact of NER. To ensure fair comparison, we selected only mentions with exact spans matching the test set where possible.7 Terms with multiple labels introduce additional complexity. When a single text span is linked to multiple entities in the gold standard, these are treated as separate pairs in the overall calculations.
Results
The target of an evaluation
We propose four target assessment sets to emphasise two key evaluation aspects: novel mentions, entities absent from training and development data, and the impact of repeated mention-entity pairs.
- Global Set: The entire test set.
- Global Unique Set: The mention-entity pairs in the test set with repetitions removed.
- Novel Set: A set of mention-entity pairs that only appear in the test dataset, and are not present in the training or development sets.
- Novel Unique Set: A set of novel mention-entity pairs with repetitions removed.
Each evaluation set supports an independent assessment of performance metrics. Take accuracy as an example: Global Accuracy measures the percentage of all mention-entity pairs that exactly match those in the gold standard dataset; Global Unique Accuracy considers only distinct mention-entity pairs by removing duplicates; Novel Accuracy evaluates the percentage of correctly linked mention-entity pairs that are absent from the training or development sets but present in the gold standard; and Novel Unique Accuracy measures the accuracy of distinct mention-entity pairs that meet the same criteria.
The selection of an appropriate evaluation set depends on the application scenario. Current EL experiments mainly use the Global set for overall evaluation, whereas the Novel Unique set is particularly useful for evaluating a model’s ability to generalise to unseen data. When a training dataset is unavailable, results on the Novel set are identical to those on the Global set.
The choice between the Global Set and Global Unique Set depends on how well the test corpus reflects the characteristics of datasets in the target application domain. Both the Novel Set and Novel Unique Set are especially valuable when working with extensive vocabularies or small test datasets.
Performance profile for hierarchical entity linking
The "parent-child" relationship in hierarchical vocabularies can lead to mismatches in entity linking, which may vary in severity and correctness. To address this, we analyse the features of each match by considering the location, relationship, and hierarchical distance between the predicted entity and the target entity. These features are then summarised to construct a detailed performance profile for each model across different datasets.
Match types
Four types of matches are defined based on the logical relationship between the target class Et and the predicted entity Ep. A match is correct if the logical relationship between Et and Ep holds. The correctness doesn’t imply the match is optimal or useful.
- Exact match, \documentclass[12pt]{minimal} \usepackage{amsmath} \usepackage{wasysym} \usepackage{amsfonts} \usepackage{amssymb} \usepackage{amsbsy} \usepackage{mathrsfs} \usepackage{upgreek} \setlength{\oddsidemargin}{-69pt} \begin{document}$$\mathcal{E}$$\end{document} : The predicted entity is identical to the target entity, \documentclass[12pt]{minimal} \usepackage{amsmath} \usepackage{wasysym} \usepackage{amsfonts} \usepackage{amssymb} \usepackage{amsbsy} \usepackage{mathrsfs} \usepackage{upgreek} \setlength{\oddsidemargin}{-69pt} \begin{document}$$E_t = E_p$$\end{document} , denoted as \documentclass[12pt]{minimal} \usepackage{amsmath} \usepackage{wasysym} \usepackage{amsfonts} \usepackage{amssymb} \usepackage{amsbsy} \usepackage{mathrsfs} \usepackage{upgreek} \setlength{\oddsidemargin}{-69pt} \begin{document}$$ \leftrightarrow $$\end{document} .
- Overspecific match, \documentclass[12pt]{minimal} \usepackage{amsmath} \usepackage{wasysym} \usepackage{amsfonts} \usepackage{amssymb} \usepackage{amsbsy} \usepackage{mathrsfs} \usepackage{upgreek} \setlength{\oddsidemargin}{-69pt} \begin{document}$$\mathcal{O}$$\end{document} : The predicted entity is a subset of the target entity, \documentclass[12pt]{minimal} \usepackage{amsmath} \usepackage{wasysym} \usepackage{amsfonts} \usepackage{amssymb} \usepackage{amsbsy} \usepackage{mathrsfs} \usepackage{upgreek} \setlength{\oddsidemargin}{-69pt} \begin{document}$$E_t \subset E_p$$\end{document} , denoted as \documentclass[12pt]{minimal} \usepackage{amsmath} \usepackage{wasysym} \usepackage{amsfonts} \usepackage{amssymb} \usepackage{amsbsy} \usepackage{mathrsfs} \usepackage{upgreek} \setlength{\oddsidemargin}{-69pt} \begin{document}$$ \rightarrow $$\end{document} . An overspecific match may still be correct if it is consistent with the actual concept.
- Underspecific match, \documentclass[12pt]{minimal} \usepackage{amsmath} \usepackage{wasysym} \usepackage{amsfonts} \usepackage{amssymb} \usepackage{amsbsy} \usepackage{mathrsfs} \usepackage{upgreek} \setlength{\oddsidemargin}{-69pt} \begin{document}$$\mathcal{U}$$\end{document} : The predicted entity is a superset of the target entity, \documentclass[12pt]{minimal} \usepackage{amsmath} \usepackage{wasysym} \usepackage{amsfonts} \usepackage{amssymb} \usepackage{amsbsy} \usepackage{mathrsfs} \usepackage{upgreek} \setlength{\oddsidemargin}{-69pt} \begin{document}$$E_p \subset E_t$$\end{document} , denoted as \documentclass[12pt]{minimal} \usepackage{amsmath} \usepackage{wasysym} \usepackage{amsfonts} \usepackage{amssymb} \usepackage{amsbsy} \usepackage{mathrsfs} \usepackage{upgreek} \setlength{\oddsidemargin}{-69pt} \begin{document}$$ \leftarrow $$\end{document} . Underspecific matches, although lacking specificity, are always correct since they are mapped to a more general parent entity.
- Orthogonal match, \documentclass[12pt]{minimal} \usepackage{amsmath} \usepackage{wasysym} \usepackage{amsfonts} \usepackage{amssymb} \usepackage{amsbsy} \usepackage{mathrsfs} \usepackage{upgreek} \setlength{\oddsidemargin}{-69pt} \begin{document}$$\mathcal{T}$$\end{document} : The predicted entity is neither a subset nor a superset of the target entity. \documentclass[12pt]{minimal} \usepackage{amsmath} \usepackage{wasysym} \usepackage{amsfonts} \usepackage{amssymb} \usepackage{amsbsy} \usepackage{mathrsfs} \usepackage{upgreek} \setlength{\oddsidemargin}{-69pt} \begin{document}$$ \neg (E_t \subseteq E_p) \land \neg (E_p \subseteq E_t) $$\end{document} , such as sibling entities, denoted as \documentclass[12pt]{minimal} \usepackage{amsmath} \usepackage{wasysym} \usepackage{amsfonts} \usepackage{amssymb} \usepackage{amsbsy} \usepackage{mathrsfs} \usepackage{upgreek} \setlength{\oddsidemargin}{-69pt} \begin{document}$$ \perp$$\end{document} .
Match distance
Match Distance quantifies the degree of mismatch by measuring how far the predicted entity is from the target entity. For orthogonal matches, the distance equals the sum of distances from each entity to their lowest common ancestor. Within the same match type, greater distances indicate increased divergence. A correct match has a distance of 0, while a mapping to a direct parent or child has a distance of 1.
\documentclass[12pt]{minimal} \usepackage{amsmath} \usepackage{wasysym} \usepackage{amsfonts} \usepackage{amssymb} \usepackage{amsbsy} \usepackage{mathrsfs} \usepackage{upgreek} \setlength{\oddsidemargin}{-69pt} \begin{document}$$ \mathrm{Distance}(E_t, E_p) = \begin{cases} \mathrm{Dis}(E_t, E_p), & \text{if } E_t \cap E_p \neq \emptyset, \\ \begin{aligned}&|\mathrm{Dis}(E_t, E_x)| \cr&\quad+ |\mathrm{Dis}(E_p, E_x)|,\end{aligned} & \text{if } E_t \cap E_p = \emptyset. \end{cases} $$\end{document}where \documentclass[12pt]{minimal} \usepackage{amsmath} \usepackage{wasysym} \usepackage{amsfonts} \usepackage{amssymb} \usepackage{amsbsy} \usepackage{mathrsfs} \usepackage{upgreek} \setlength{\oddsidemargin}{-69pt} \begin{document}$$\mathrm{Dis}(E_t, E_p)$$\end{document} is the distance via the shortest path using the SubClassOf relationship within the vocabulary, and Ex is the lowest common ancestor of Et and Ep.
Location of match
The position of a match captures both its position within the hierarchical structure, specifying the branch it belongs to, and its depth. Errors at closer to the root of the vocabulary, which correspond to making mistakes at broader categories, have a greater impact than those at lower levels. To account for this, we include Location, the relative depth of the target entity within its branch, for each entity-mention pair. This metric captures the severity of mismatches by reflecting variations in informativeness and semantic granularity across hierarchical levels.
\documentclass[12pt]{minimal} \usepackage{amsmath} \usepackage{wasysym} \usepackage{amsfonts} \usepackage{amssymb} \usepackage{amsbsy} \usepackage{mathrsfs} \usepackage{upgreek} \setlength{\oddsidemargin}{-69pt} \begin{document}$$ \mathrm{Loc}(E_t) = \frac{\min \mathrm{Dis}(E_t, \mathrm{root})}{\min \mathrm{Dis}(\mathrm{root}, \mathrm{leaf})} $$\end{document}where \documentclass[12pt]{minimal} \usepackage{amsmath} \usepackage{wasysym} \usepackage{amsfonts} \usepackage{amssymb} \usepackage{amsbsy} \usepackage{mathrsfs} \usepackage{upgreek} \setlength{\oddsidemargin}{-69pt} \begin{document}$$\mathrm{Dis}(E_t, \mathrm{root})$$\end{document} is the distance between Et and the root, and \documentclass[12pt]{minimal} \usepackage{amsmath} \usepackage{wasysym} \usepackage{amsfonts} \usepackage{amssymb} \usepackage{amsbsy} \usepackage{mathrsfs} \usepackage{upgreek} \setlength{\oddsidemargin}{-69pt} \begin{document}$$\min \mathrm{Dis}(\mathrm{root}, \mathrm{leave})$$\end{document} is the distance from the root to the nearest leaf.
Performance profile
We construct a performance profile to evaluate model performance on specific datasets, where each row Pi in Profile P corresponds to a mention-entity pair with the following properties:
\documentclass[12pt]{minimal} \usepackage{amsmath} \usepackage{wasysym} \usepackage{amsfonts} \usepackage{amssymb} \usepackage{amsbsy} \usepackage{mathrsfs} \usepackage{upgreek} \setlength{\oddsidemargin}{-69pt} \begin{document}$$ P = \begin{pmatrix} \mathrm{Type}_1 & \mathrm{Distance}_1 & \mathrm{Loc}_1 \\ \mathrm{Type}_2 & \mathrm{Distance}_2 & \mathrm{Loc}_2 \\ \vdots & \vdots & \vdots \\ \mathrm{Type}_n & \mathrm{Distance}_n & \mathrm{Loc}_n \\ \end{pmatrix} $$\end{document}where:
- \documentclass[12pt]{minimal} \usepackage{amsmath} \usepackage{wasysym} \usepackage{amsfonts} \usepackage{amssymb} \usepackage{amsbsy} \usepackage{mathrsfs} \usepackage{upgreek} \setlength{\oddsidemargin}{-69pt} \begin{document}$$ \mathrm{Type}_i $$\end{document} is the match type of the i-th pair.
- \documentclass[12pt]{minimal} \usepackage{amsmath} \usepackage{wasysym} \usepackage{amsfonts} \usepackage{amssymb} \usepackage{amsbsy} \usepackage{mathrsfs} \usepackage{upgreek} \setlength{\oddsidemargin}{-69pt} \begin{document}$$ \mathrm{Distance}_i $$\end{document} is the matching distance of the i-th pair, defined as the distance between the target entity and the predicted entity.
- \documentclass[12pt]{minimal} \usepackage{amsmath} \usepackage{wasysym} \usepackage{amsfonts} \usepackage{amssymb} \usepackage{amsbsy} \usepackage{mathrsfs} \usepackage{upgreek} \setlength{\oddsidemargin}{-69pt} \begin{document}$$ \mathrm{Loc}_i $$\end{document} is the match location of the i-th pair, defined as the relative depth of the target entity in the vocabulary hierarchy.
Figure 1 illustrates the performance profile. Traditional entity linking assessment considers only Exact matches. In contrast, we further categorise matches into various mismatch types and represent these using a heatmap (Fig. 1b), capturing both types and degrees of mismatches. In this example, mapping “apple for dinner” to dessert apple is overspecific. While this may be valid, since a dessert apple is a type of apple, further context from the article could clarify whether this finer classification is appropriate. Conversely, linking “Pyrus communis” to Fruit instead of Conference pear is correct, though some specificity is lost.Fig. 1. Entity linking performance profile for the example fruit vocabulary and sample dataset. a. Hierarchical structure of an example fruit vocabulary. b. Sample dataset and its entity linking performance profile, coloured by match types
Model characteristics of hierarchical entity linking
The performance profile provides a comprehensive mapping of every mention-entity pair in the dataset, enabling detailed analysis. To describe a model’s features and support high-level comparisons, we summarise this profile into model characteristics that reflect the model’s tendencies in linking entities.
For the entire dataset, we introduce Coverage and Specificity, alongside accuracy, as key metrics to characterise model performance. Coverage measures the proportion of entities accurately annotated, allowing broader, superclass matches (e.g., mapping “Apple” to Fruit) to increase coverage at the expense of specificity. In contrast, Specificity reflects the granularity of a predicted entity within the vocabulary. Overspecified matches (e.g., predicting Pink Lady instead of the target Apple) may be deemed correct or incorrect depending on the context and use case.
Let \documentclass[12pt]{minimal} \usepackage{amsmath} \usepackage{wasysym} \usepackage{amsfonts} \usepackage{amssymb} \usepackage{amsbsy} \usepackage{mathrsfs} \usepackage{upgreek} \setlength{\oddsidemargin}{-69pt} \begin{document}$$ \mathcal{D} $$\end{document} be the set of all instances in the entity linking dataset and \documentclass[12pt]{minimal} \usepackage{amsmath} \usepackage{wasysym} \usepackage{amsfonts} \usepackage{amssymb} \usepackage{amsbsy} \usepackage{mathrsfs} \usepackage{upgreek} \setlength{\oddsidemargin}{-69pt} \begin{document}$$ \mathcal{X} $$\end{document} be a specific type of match where \documentclass[12pt]{minimal} \usepackage{amsmath} \usepackage{wasysym} \usepackage{amsfonts} \usepackage{amssymb} \usepackage{amsbsy} \usepackage{mathrsfs} \usepackage{upgreek} \setlength{\oddsidemargin}{-69pt} \begin{document}$$ \mathcal{X} \in \{\mathcal{E}, \mathcal{O}, \mathcal{U}, \mathcal{T}\} $$\end{document} , and \documentclass[12pt]{minimal} \usepackage{amsmath} \usepackage{wasysym} \usepackage{amsfonts} \usepackage{amssymb} \usepackage{amsbsy} \usepackage{mathrsfs} \usepackage{upgreek} \setlength{\oddsidemargin}{-69pt} \begin{document}$$N_{\mathcal{X}} = \left| \{x \in \mathcal{D} \mid x \text{is of type } \mathcal{X} \} \right|$$\end{document} then:
\documentclass[12pt]{minimal} \usepackage{amsmath} \usepackage{wasysym} \usepackage{amsfonts} \usepackage{amssymb} \usepackage{amsbsy} \usepackage{mathrsfs} \usepackage{upgreek} \setlength{\oddsidemargin}{-69pt} \begin{document}$$\mathrm{Accuracy} = \frac{N_E}{N_E + N_\mathcal{O} + N_\mathcal{U} + N_P}$$\end{document} \documentclass[12pt]{minimal} \usepackage{amsmath} \usepackage{wasysym} \usepackage{amsfonts} \usepackage{amssymb} \usepackage{amsbsy} \usepackage{mathrsfs} \usepackage{upgreek} \setlength{\oddsidemargin}{-69pt} \begin{document}$$\mathrm{Specificity} = \frac{N_E+N_\mathcal{O}}{N_E + N_\mathcal{O} + N_\mathcal{U} + N_P}$$\end{document} \documentclass[12pt]{minimal} \usepackage{amsmath} \usepackage{wasysym} \usepackage{amsfonts} \usepackage{amssymb} \usepackage{amsbsy} \usepackage{mathrsfs} \usepackage{upgreek} \setlength{\oddsidemargin}{-69pt} \begin{document}$$\mathrm{Coverage} = \frac{N_E+N_\mathcal{U}}{N_E + N_\mathcal{O} + N_\mathcal{U} + N_P}$$\end{document}We also use Braveness, Cautiousness and Orthogonality to measure cases where the model fails to predict the target entity.
\documentclass[12pt]{minimal} \usepackage{amsmath} \usepackage{wasysym} \usepackage{amsfonts} \usepackage{amssymb} \usepackage{amsbsy} \usepackage{mathrsfs} \usepackage{upgreek} \setlength{\oddsidemargin}{-69pt} \begin{document}$$\mathrm{Braveness} = \frac{N_\mathcal{O}}{N_\mathcal{O}+N_P+N_\mathcal{U}}$$\end{document} \documentclass[12pt]{minimal} \usepackage{amsmath} \usepackage{wasysym} \usepackage{amsfonts} \usepackage{amssymb} \usepackage{amsbsy} \usepackage{mathrsfs} \usepackage{upgreek} \setlength{\oddsidemargin}{-69pt} \begin{document}$$\mathrm{Cautiousness} = \frac{N_\mathcal{U}}{N_\mathcal{O}+N_P+N_\mathcal{U}}$$\end{document} \documentclass[12pt]{minimal} \usepackage{amsmath} \usepackage{wasysym} \usepackage{amsfonts} \usepackage{amssymb} \usepackage{amsbsy} \usepackage{mathrsfs} \usepackage{upgreek} \setlength{\oddsidemargin}{-69pt} \begin{document}$$\mathrm{Orthogonality} = \frac{N_\mathcal{P}}{N_\mathcal{O}+N_P+N_\mathcal{U}}$$\end{document}Braveness reflects a model’s tendency to predict more specific entities, while Cautiousness captures its inclination to generalise predictions to higher-level categories, trading specificity for coverage. Orthogonality reflects the degree of orthogonal matches in predictions, representing mismatches that are always incorrect. While a brave or cautious mismatch can be accepted depending on the application, orthogonal mismatches should be minimised.
Case studies: Performance comparison of two models in disease entity linking
Accuracy assessment
We calculated the accuracy for TaggerOne and BioSyn across different BC5CDR disease subsets (See Table 1). Both models experienced a substantial performance drop (10.39%-14.24%) on the novel unique set compared to their global counterparts. The performance difference between the two models on the novel unique dataset is minimal (0.09%). For both models, the removal of repetition negatively impacts accuracy, with the global set being more affected than the novel dataset. TaggerOne has a larger drop (4.51%) in the global set.Table 1. Accuracy of BioSyn and TaggerOne on the BC5CDR disease datasetMetricBioSynTaggerOneGlobal accuracy90.43%95.27%Global unique accuracy86.82%90.76%Novel accuracy80.53%81.13%Novel unique accuracy80.04%81.03%
Performance profiles
Although both models achieve similar overall accuracy, they display distinct performance patterns. Fig. 2 visualises the performance profiles of TaggerOne and BioSyn on the BC5CDR disease dataset, showing results for both the global set and the novel unique set. Over 50% of mismatches in both models are classified as orthogonal matches, suggesting that the models frequently fail to identify the correct entity branch.Fig. 2. Performance profiles of TaggerOne and BioSyn (mismatches only). Error analysis highlights mismatched predictions. Darker shades indicate larger match distances
TaggerOne produces approximately three times as many underspecific matches as overspecific ones, and shows 12.47–16.61% more underspecific matches than BioSyn within the mismatch set. A higher proportion of underspecific matches implies that TaggerOne is better at identifying correct ancestor entities, making its errors comparatively more acceptable.
BioSyn demonstrates a consistent error profile across both the global dataset and the novel unique set. In contrast, TaggerOne’s performance profiles vary between sets, with the novel unique set containing 8.39% fewer orthogonal matches. This indicates that, while both models achieve similar accuracy on the novel unique set, TaggerOne is more effective at avoiding mismatches with entities that are further apart. However, when TaggerOne does make orthogonal errors, the average distance of such mismatches is greater, indicating a higher degree of divergence from the target entity.
Mismatch location analysis provides further insights into the models’ performance (Fig. 3). Nearly half of all mismatches occur at the leaf level. BioSyn shows a higher prevalence of overspecific matches at the mid-level (relative location 70%), while orthogonal mismatches dominate at the leaf level. Notably, BioSyn’s mismatch patterns remain consistent between the global set and the novel unique set.Fig. 3 Model Performance by locations (mismatches only). The relative location refers to the position of the target entity within the shortest path of its corresponding branch in the vocabulary. A relative location of 1 indicates that the target entity is the most specific (i.e., leaf-level) node in its branch
In contrast, TaggerOne exhibits different behaviour in the novel unique set compared to the global set. In the novel unique set, underspecific matches are concentrated at the mid-level (relative location 50–70%), reflecting an overcautious approach that avoids linking to generic entities. At the leaf level, underspecific matches occur at a comparable rate to orthogonal matches, indicating that this cautious strategy effectively mitigates errors at finer levels of granularity.
Characteristics of both models
Table 2 compares the characteristics of TaggerOne and BioSyn. TaggerOne achieves broader coverage across both global and unique novel sets, demonstrating its effectiveness in capturing a wider range of mentions. In contrast, BioSyn exhibits greater predictive braveness, particularly in the global set. TaggerOne, by comparison, demonstrates a more cautious prediction strategy, especially in the novel unique set. Despite similar levels of orthogonality, BioSyn generates a greater proportion of orthogonal errors in the unique novel set, with most errors occurring at leaf nodes. These findings highlight a model characteristics contrast: TaggerOne prioritises coverage and caution, while BioSyn makes brave overspecific predictions, with a higher risk of errors. These complementary characteristics support informed model selection based on specific application requirements, for example, prioritising coverage in low-recall scenarios or favouring risk-tolerant models when high precision is essential.Table 2. Characteristics of the BioSyn and TaggerOne model based on their performance on the BC5CDR disease datasetOverall analysisError analysisAccuracyCoverageSpecificityBravenessCautiousnessOrthogonalityBioSyn Global90.43%92.04%92.13%17.60%16.82%65.58%BioSyn Unique Novel80.04%83.48%83.48%17.17%17.17%65.66%TaggerOne Global95.27%96.67%95.73%9.61%29.29%61.10%TaggerOne Unique Novel81.02%87.44%83.59%13.51%33.78%52.71%
The competency of an entity linking model
We recommend evaluating models by aligning their competencies with specific use case requirements. Users can customise their selection of evaluation metrics. Below, we outline three example scenarios, summarised in Table 3.Table 3. Metrics of interest based on entity linking scenarios. Metrics of interest are marked with “x”ScenarioMatch TypeMatch DistanceMatch LocAccuracyCoverageSpecificityBravenessCautiousnessOrthogonalityCancer branchE, U, O, SxxInsurance reimbursementE, UxxxxxAnnotation recommendationE, U, O, Sxxx
Scenario 1: Focusing on the position
When multiple vocabularies are integrated, evaluation performance can be biased if mappings outside the target subdomain of a particular vocabulary are included. For example, although the NCI Thesaurus (NCIt) [4] is widely used for cancer modelling, it also contains extensive non-cancer branches such as food and drug materials. In this scenario, while filtering could in principle be applied to retain only cancer concepts, a proper evaluation should emphasise where the mismatch occurs and annotation accuracy.
Scenario 2: Prioritising coverage
When mapping insurance claims to SNOMED CT [20], links where a term is mapped to underspecific concepts are tolerated considering the annotation difficulty and the size of the vocabulary [12]. In this context, unmapped diseases risk under-reimbursement, while incorrect mappings risk misclassification of reimbursement categories. Moreover, fine-grained disease subtypes have limited relevance for insurance purposes. Therefore, together with accuracy, cautiousness, and orthogonality should be prioritised.
Scenario 3: Finding the neighbourhood
When data curators use an entity linking model [11] to facilitate their manual annotation by pre-selecting several candidate entities. The EL models is supposed to provide candidates in the right area of the vocabulary for human experts to further select the most suitable. In this case, for models with comparable accuracy, those with shorter average distance to the target entity are better suited.
Discussion
Our findings reflect a broader need for evaluation frameworks that go beyond surface-level accuracy to capture nuanced model behaviour. The proposed metrics and analysis techniques represent a practical step toward more meaningful and actionable model assessment in biomedical entity linking. By incorporating hierarchical information, our evaluation better aligns with the structured nature of biomedical vocabularies, offering deeper insight into the semantic appropriateness of model outputs. This is particularly valuable in ontology-driven domains, where distinctions between entity types often reflect complex biological relationships.
The correlation between a model’s performance and the percentage of novel entities in the test set partially explains why many models fail to perform well on real-world datasets. This highlights the importance of conducting evaluations not only on the global set but also on novel subsets.
Our proposed evaluation metrics enhance accuracy-based calculations by capturing nuances in model behaviour and considering entity relationships within hierarchical vocabularies. These metrics are versatile and can be applied to various hierarchical structures, including taxonomies, thesauri, and ontologies. They are compatible in entity-level macro accuracy based assessments and mention-level micro accuracy based assessments.
TaggerOne originally used F1 for document-level entity linking evaluation. Although the research community has shifted towards accuracy-based evaluations in recent years, F1 measures remain relevant, particularly for multi-word expressions. Our evaluation approaches, including target set selection, hierarchical relationships, can be seamlessly integrated with F1 measurements and document-level evaluations by focusing one representative subsets or taking the hierarchy into account, offering a more comprehensive assessment framework.
While it is conceivable that future work may propose composite scores to summarise multiple aspects of performance, our focus here is on clarifying the underlying dimensions so that such aggregations, if pursued, can be better informed. A simple metric can obscure a model’s specific strengths and weaknesses. Instead, aggregating multiple metrics and designing custom measures tailored to specific use cases is more effective. For instance, error-tolerant systems might prioritise the accuracy of middle-level terms, ignore overspecific terms, and penalise underspecific ones in an aggregated score. Conversely, high-stakes systems requiring minimal errors should emphasise reducing orthogonal and overspecific mismatches. Users are expected to fully analyse their usage requirements and clearly define the competency questions before selecting their evaluation sets. This tailored approach ensures that evaluation metrics align with the diverse requirements of various applications.
While we have identified key challenges in entity linking assessment, the problem remains complex. Factors such as the similarity between the test dataset and the application dataset, the breadth and coverage of the vocabulary, and its size all influence assessment outcomes.
Conclusions
Our framework allows users to make informed model choices tailored to their objectives and provides deeper insights into model errors. These insights enable targeted improvements, enabling entity linking systems be optimised for practical applications. We advocate transitioning from accuracy-based evaluation to use-case-driven assessment in entity linking. Metrics should align with competency questions that reflect user-specific needs, enabling users to select models and construct customized metric combinations based on these criteria.
The reference list from the paper itself. Each links out to its DOI / PubMed record.
- 1French E, Mc Innes BT. An overview of biomedical entity linking throughout the years. J Biomed Inf. 2023;137(104252).10.1016/j.jbi.2022.104252 PMC 984518436464228 · doi ↗ · pubmed ↗
- 2Garda S, Leser U. BELHD: improving biomedical entity linking with homonym disambiguation. Bioinformatics, page btae, 2024;474.10.1093/bioinformatics/btae 474PMC 1131045439067036 · doi ↗ · pubmed ↗
- 3Garda S, Weber-Genzel L, Martin R, Leser U. BELB: a biomedical entity linking benchmark. Bioinformatics. 2023;39(11):btad 698.10.1093/bioinformatics/btad 698PMC 1068186537975879 · doi ↗ · pubmed ↗
- 4Hoehndorf R. Version of Me SH - RH-MESH ontology. http://phenomebrowser.net/ontologies/mesh/https://bioportal.bioontology.org/ontologies/RH-MESH. Accessed 11 Nov 2024.
- 5Kartchner D, Deng J, Lohiya S, Kopparthi T, Bathala P, Domingo-Fernández D, Mitchell CS. A comprehensive evaluation of biomedical entity linking models. In Proceedings of the Conference on Empirical Methods in Natural Language Processing. NIH Public Access; 2023, p. 14462.10.18653/v 1/2023.emnlp-main.893PMC 1109797838756862 · doi ↗ · pubmed ↗
- 6DMIS Lab. Bio Syn: biomedical entity representations with synonym marginalization. Git Hub repository. 2020. https://github.com/dmis-lab/Bio Syn.
- 7Leaman R, Islamaj R, Adams V, Alliheedi MA, Rafael Almeida J, Antunes R, Bevan R, Chang Y-C, Erdengasileng A, Hodgskiss M, et al. Chemical identification and indexing in full-text articles: an overview of the nlm-chem track at biocreative vii. Database. 2023, 2023:baad 005.10.1093/database/baad 005PMC 999149236882099 · doi ↗ · pubmed ↗
- 8Leaman R, Zhiyong L. Tagger One: joint named entity recognition and normalization with semi-markov models. Bioinformatics. 2016;32(18):2839–46.10.1093/bioinformatics/btw 343PMC 501837627283952 · doi ↗ · pubmed ↗