Genetic Testing for APOL1 in Adults With Hypertension: The GUARDD-US Randomized Clinical Trial
Michael T. Eadon, Kerri L. Cavanaugh, Lilin She, Kady-Ann Steen-Burrell, Dinushika Mohottige, Girish N. Nadkarni, Heather Kitzman, Hrishikesh Chakraborty, Philip E. Empey, Nita A. Limdi, Rajbir Singh, Cherry Maynor Beasley, Alexander S. Parker, Emily J. Cicali, Michelle A. Ramos

TL;DR
A clinical trial found that immediate APOL1 genetic test results did not lower blood pressure overall but improved kidney disease screening and diagnosis.
Contribution
The study is the first to evaluate the impact of APOL1 genotype disclosure on blood pressure and CKD outcomes in a large, diverse population.
Findings
Immediate APOL1 genotype results did not reduce systolic blood pressure overall at 3 months.
Among patients with uncontrolled blood pressure, immediate results led to a significant SBP reduction.
APOL1 genotype disclosure increased urine microalbumin screening and CKD diagnoses at 6 months.
Abstract
Among participants with hypertension with an apolipoprotein L1 locus (APOL1) high-risk genotype, would immediate genetic return of results vs no genetic testing until trial conclusion result in a greater improvement in systolic blood pressure (SBP) at 3 months? This randomized clinical trial including 6754 participants found that, at 3 months, there was no difference in SBP between those with immediate and delayed results; however, among participants with uncontrolled blood pressure, those who received immediate results saw a greater reduction in SBP than those with a delay. Provision of APOL1 genotype also led to increased urine microalbumin screening and chronic kidney disease diagnoses at 6 months. This study suggests that immediate provision of APOL1 results to participants and clinicians was not associated with SBP reduction, but genotyping increased the rate of CKD screening and…
Genes, proteins, chemicals, diseases, species, mutations and cell lines named across the full text — each resolved to its canonical identifier and authoritative record.
Click any figure to enlarge with its caption.
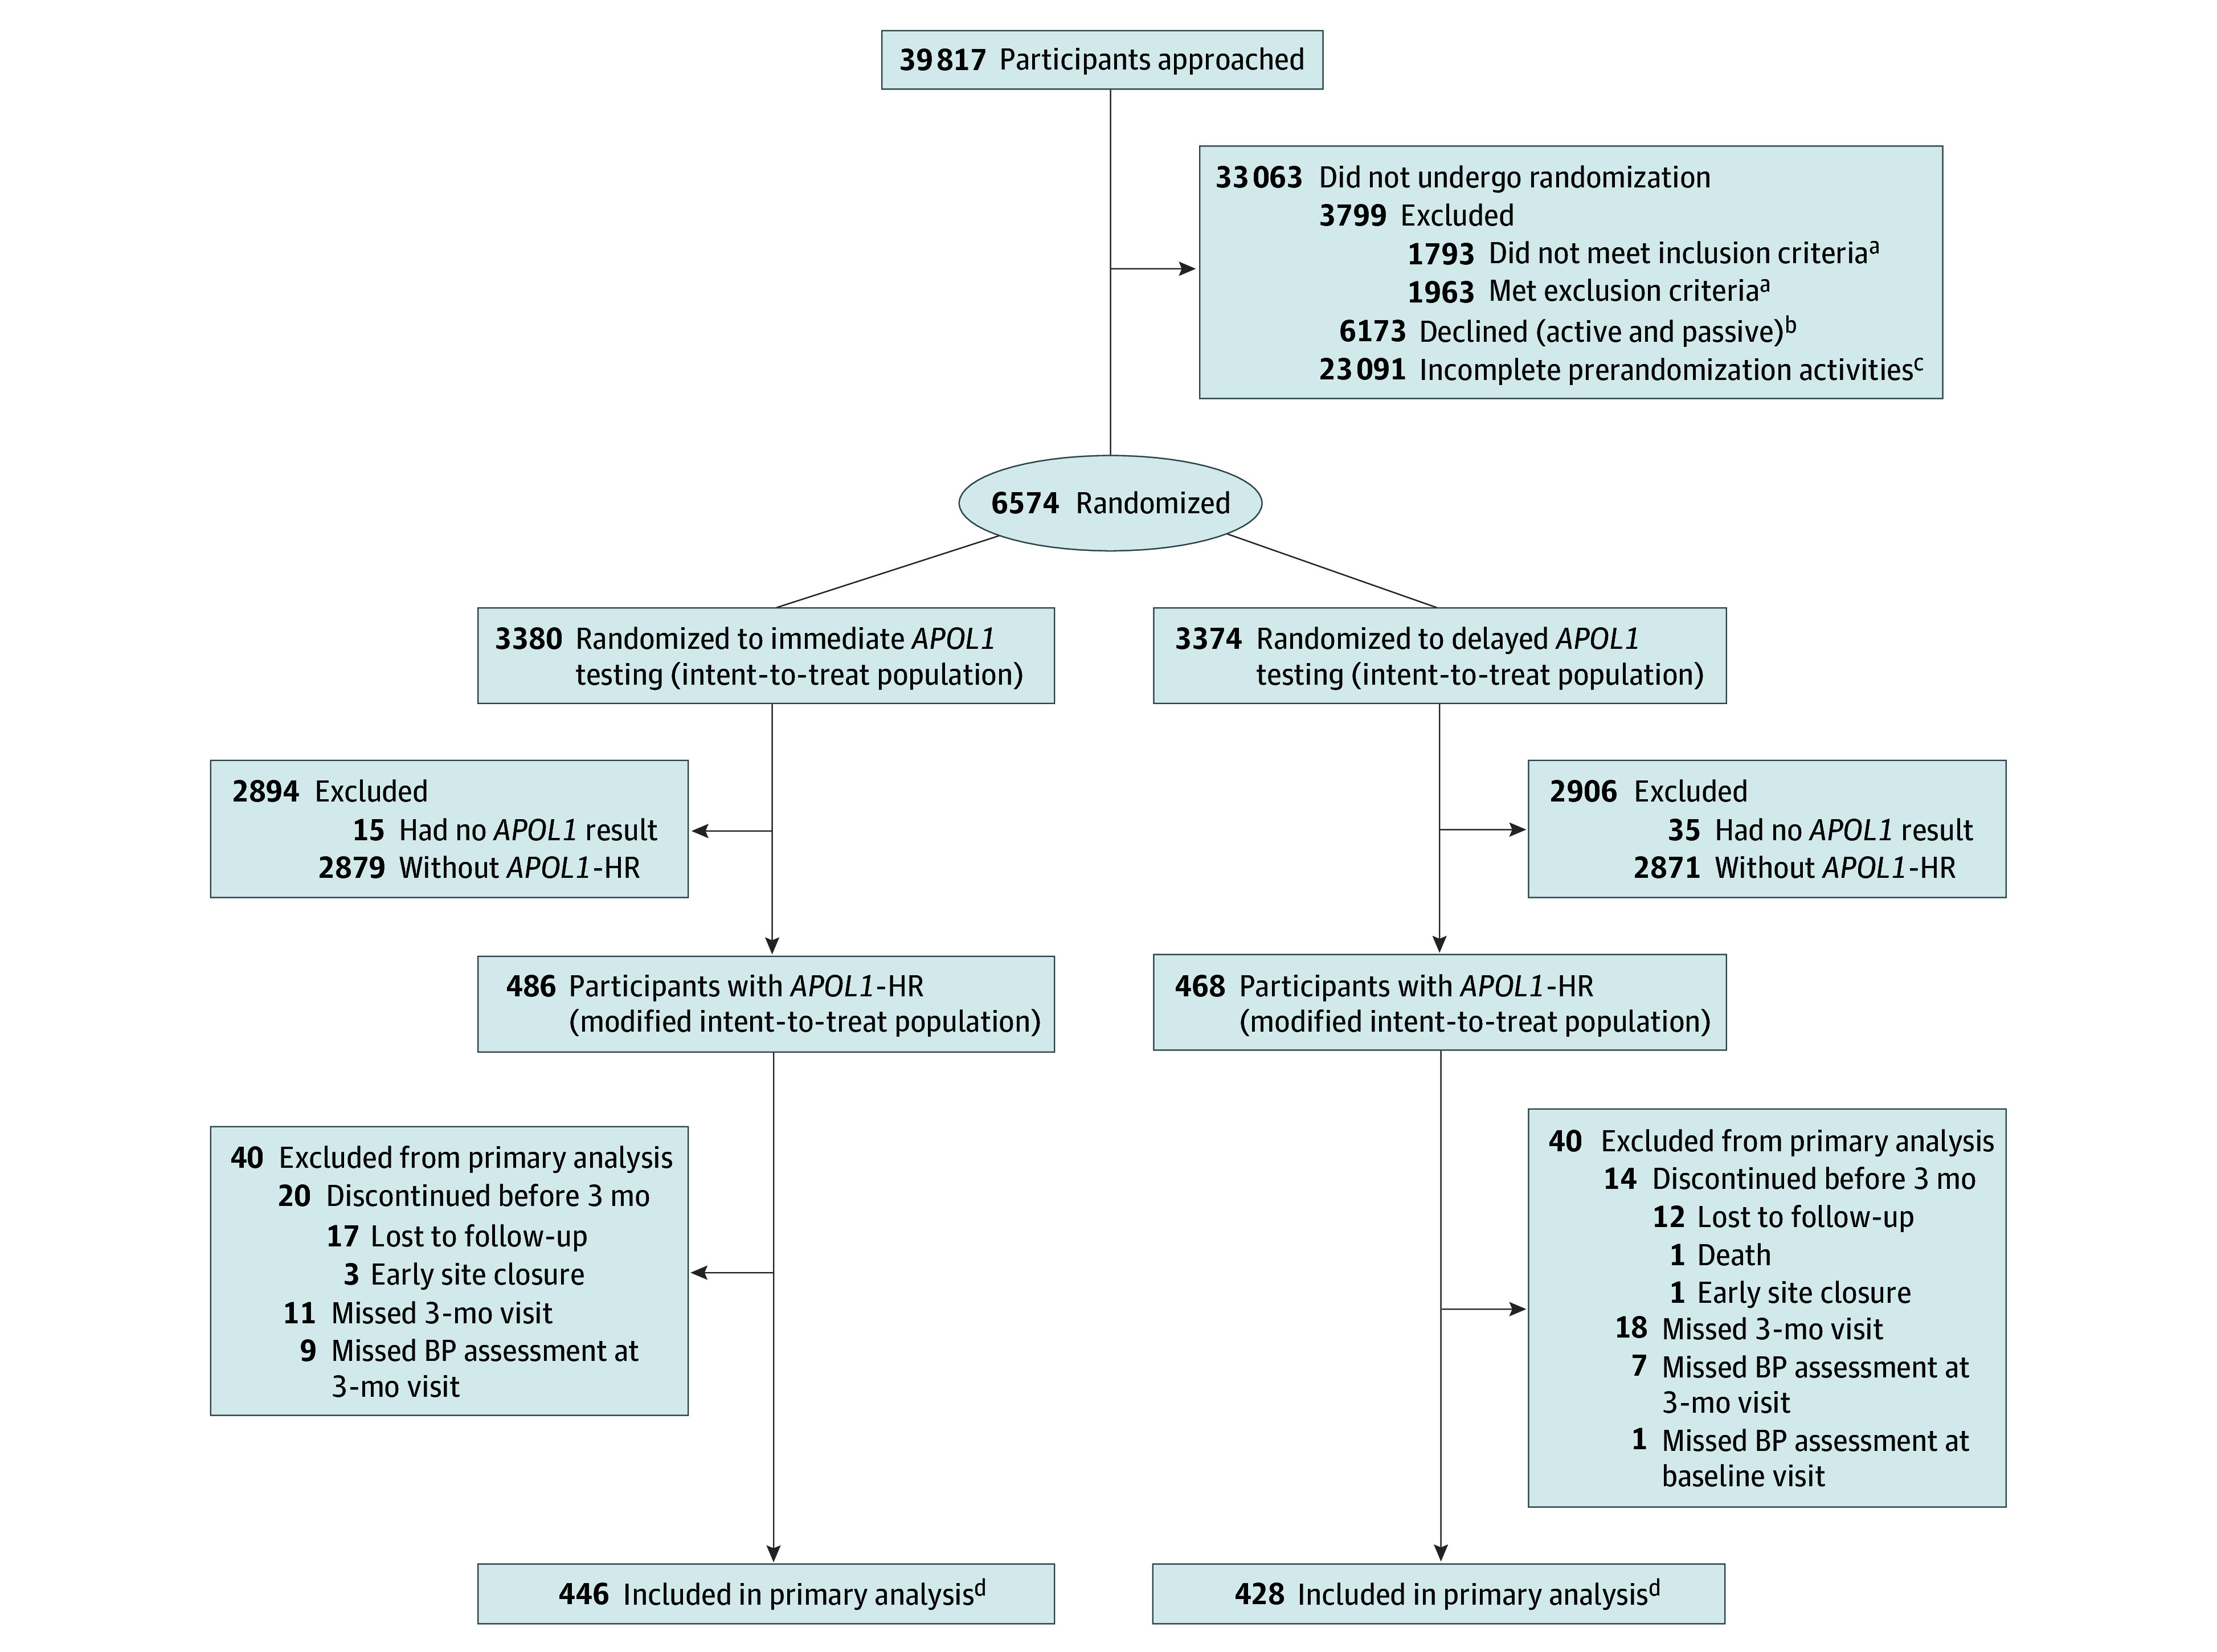 Figure 1
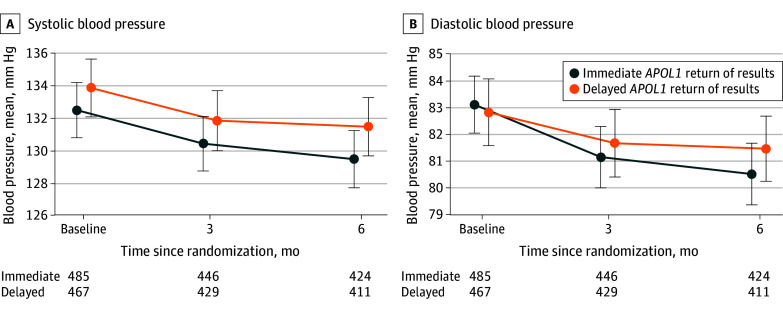 Figure 2
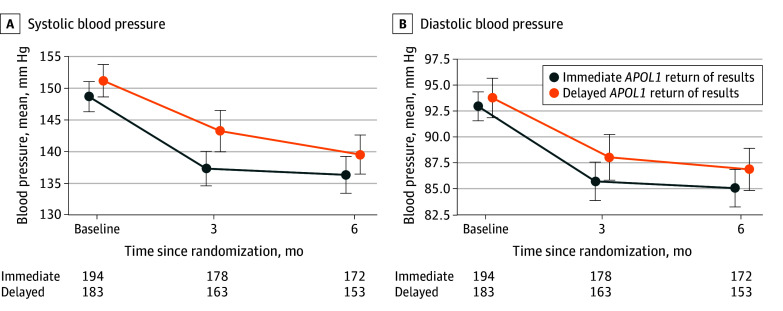 Figure 3
| Characteristic | Uncontrolled BP at baseline (n = 377) | |||
|---|---|---|---|---|
| Immediate (n = 486) | Delayed (n = 468) | Immediate (n = 194) | Delayed (n = 183) | |
| Age at randomization, mean (SD), y | 54.7 (9.9) | 55.1 (10.1) | 53.4 (10.2) | 53.7 (10.1) |
| Sex at birth, No. (%) | ||||
| Female | 326 (67.1) | 274 (58.5) | 130 (67.0) | 103 (56.3) |
| Male | 160 (32.9) | 194 (41.5) | 64 (33.0) | 80 (43.7) |
| Self-identified race and ethnicity, No. (%) | ||||
| American Indian, Native American, or Alaska Native | 0 | 2 (0.4) | 0 | 1 (0.5) |
| Asian | 0 | 0 | 0 | 0 |
| Black or African American | 457 (94.0) | 422 (90.2) | 183 (94.3) | 163 (89.1) |
| Hispanic or Latino or Latina | 1 (0.2) | 1 (0.2) | 0 | 0 |
| Middle Eastern or North African or Mediterranean | 1 (0.2) | 0 | 0 | 0 |
| Native Hawaiian or Other Pacific Islander | 1 (0.2) | 1 (0.2) | 0 | 1 (0.5) |
| White or European American | 0 | 0 | 0 | 0 |
| Multiple | 17 (3.5) | 34 (7.3) | 7 (3.6) | 14 (7.7) |
| Other, unknown, prefer not to answer | 9 (1.9) | 8 (1.7) | 4 (2.1) | 4 (2.2) |
| Education: more than high school, No./total No. (%) | 273/482 (56.6) | 274/467 (58.7) | 106/192 (55.2) | 104/182 (57.1) |
| Household income <$40 000/y, No./total No. (%) | 213/363 (58.7) | 198/374 (52.9) | 88/155 (56.8) | 82/143 (57.3) |
| Insurance, No./total No. (%) | ||||
| No insurance | 35/482 (7.3) | 42/467 (9.0) | 23/193 (11.9) | 26/182 (14.3) |
| Medicaid | 116/482 (24.1) | 83/467 (17.8) | 39/193 (20.2) | 38/182 (20.9) |
| Medicare | 70/482 (14.5) | 69/467 (14.8) | 23/193 (11.9) | 20/182 (11.0) |
| Medicare and Medicaid | 48/482 (10.0) | 52/467 (17.8) | 13/193 (6.7) | 12/182 (6.6) |
| Private health insurance only | 163/482 (33.8) | 173/467 (37.0) | 73/193 (37.8) | 66/182 (36.3) |
| Other insurance (including military health care or VA) | 50/482 (10.4) | 48/467 (10.3) | 22/193 (11.4) | 20/182 (11.0) |
| Below federal poverty level, No./total No. (%) | 126/362 (34.8) | 124/372 (33.3) | 51/155 (32.9) | 54/143 (37.8) |
| Current tobacco use, No./total No. (%) | 109/485 (22.5) | 104/467 (22.3) | 37/193 (19.2) | 47/183 (25.7) |
| BP medication use at enrollment, No. (%) | 463 (95.3) | 437 (93.4) | 182 (93.8) | 169 (92.3) |
| Baseline SBP, mean (SD), mm Hg | 132.5 (18.9) | 133.8 (19.5) | 148.6 (16.7) | 151.1 (17.4) |
| No. | 485 | 467 | 194 | 183 |
| Baseline DBP, mean (SD), mm Hg | 83.1 (11.9) | 82.8 (13.6) | 92.9 (9.9) | 93.7 (13.1) |
| No. | 485 | 467 | 194 | 183 |
| SBP ≥140 mm Hg, No./total No. (%) | 142/485 (29.3) | 143/467 (30.6) | 142/194 (73.2) | 143/183 (78.1) |
| DBP ≥90 mm Hg, No./total No. (%) | 133/485 (27.4) | 121/467 (25.9) | 133/194 (68.6) | 121/183 (66.1) |
| SBP <140 and DBP <90 mm Hg, No./total No. (%) | 291/485 (60.0) | 284/467 (60.8) | NA | NA |
| Diabetes diagnosis, No./total No. (%) | 97/454 (21.4) | 106/433 (24.5) | 35/184 (19.0) | 44/169 (26.0) |
| CKD diagnosis, No./total No. (%) | 146/454 (32.2) | 166/433 (38.3) | 53/182 (29.1) | 72/170 (42.4) |
| Outcome | Return of | Difference between groups (95% CI) | |
|---|---|---|---|
| Immediate (n = 486) | Delayed (n = 468) | ||
| Primary analysis, change in SBP, baseline to 3 mo | |||
| SBP at 3 mo, all participants, mean (SD), mm Hg | 130.4 (18.0) | 131.8 (19.4) | NA |
| No. | 446 | 429 | NA |
| Change in SBP at 3 mo, all participants, mean (SD), mm Hg | −1.8 (18.8) | −1.5 (17.3) | −0.3 (−2.7 to 2.1) |
| No. | 446 | 428 | NA |
| Covariate-adjusted linear regression model of primary outcome, 3 mo | |||
| Change in SBP at 3 mo, all participants, least-square mean (SE) | −1.3 (0.8) | −0.8 (0.8) | −0.5 (−2.6 to 1.6) |
| No. | 446 | 428 | NA |
| Urine microalbuminuria or proteinuria orders, No./total No. (%) | |||
| Urine microalbuminuria or proteinuria test orders documented at baseline | 207/473 (43.8) | 221/454 (48.7) | −4.9 (−11.3 to 1.5) |
| Documented order of microalbuminuria or proteinuria tests by 6 mo | 302/473 (63.8) | 264/454 (58.1) | 5.7 (−0.6 to 12.0) |
| Change in urine microalbuminuria or proteinuria test orders from baseline to 6 mo | 95/473 (20.1) | 43/454 (9.5) | 10.6 (6.1 to 15.1) |
| Change in urine microalbuminuria or proteinuria test orders from baseline to 6 mo, among participants with no orders at baseline | 95/266 (35.7) | 43/233 (18.5) | 17.3 (9.6 to 24.9) |
| Documented diagnosis of CKD (any stage), No./total No. (%) | |||
| Documented diagnosis of CKD (any stage) at baseline | 109/456 (23.9) | 128/441 (29.0) | −5.1 (−10.9 to 0.6) |
| Documented diagnosis of CKD (any stage) by 6 mo | 140/456 (30.7) | 138/441 (31.3) | −0.6 (−6.6 to 5.5) |
| Change in documented diagnosis for CKD (any stage) from baseline to 6 mo | 31/456 (6.8) | 10/441 (2.3) | 4.5 (1.8 to 7.2) |
| Change in documented diagnosis for CKD (any stage) from baseline to 6 mo, among participants with no diagnosis at baseline | 31/347 (8.9) | 10/313 (3.2) | 5.7 (2.2 to 9.3) |
Peer Reviews
No public reviews on file for this paper yet. If you reviewed it on a platform where reviews are public (OpenReview, ICLR, NeurIPS, ICML), you can paste yours below so the community can read it here.
Videos
No videos yet. Explain this paper in a talk, walkthrough, or lecture? Add one.
Taxonomy
TopicsRenal Diseases and Glomerulopathies · Coagulation, Bradykinin, Polyphosphates, and Angioedema · Ion Transport and Channel Regulation
Introduction
Hypertension and chronic kidney disease (CKD) potentiate the risk for atherosclerotic cardiovascular disease (ASCVD) morbidity and mortality.^1,2,3^ International guidelines recommend blood pressure (BP) control to reduce ASCVD risk in individuals with or without CKD.^4,5^ However, only half of individuals with hypertension achieve recommended BP goals.^6^
Race and ethnicity are sociopolitical constructs, and racial and ethnic disparities in BP control and CKD prevalence are magnified by social determinants of health, which disproportionately affect members of racial and ethnic minority populations, and particularly Black populations.^3,7,8,9^ Ancestry has some genetic underpinnings.^10,11,12^ One in 7 individuals with self-reported African ancestry are homozygous for high-risk alleles (G1 and G2) of the apolipoprotein L1 locus (APOL1-HR) associated with protection against sleeping sickness endemic in West and Central Africa.^13,14^ APOL1-HR confers increased risk for incident CKD and progression to end-stage kidney disease,^15,16,17,18^ both of which increase ASCVD risk.^19^ APOL1-HR is also associated with elevated BP.^20^ BP control is associated with improved cardiovascular mortality among people with self-reported or genetically determined African ancestry and APOL1-HR.^21^ CKD remains underdiagnosed,^22^ and international guidelines emphasize enhanced BP control for individuals with CKD to reduce ASCVD risk.^2,23^ Few studies have examined the effect of genetic return of results (gROR) on BP management and control.
A single-center pilot study, conducted in New York City,^20^ demonstrated that APOL1 gROR to participants and clinicians is feasible and resulted in improved systolic BP (SBP) at 3 months for individuals with APOL1-HR compared with those without APOL1-HR. Genetic Testing to Understand and Address Renal Disease Disparities Across the United States (GUARDD-US) expands on this pilot to examine the effect of participant and clinician knowledge of APOL1 genotype on BP among individuals with APOL1-HR across 14 institutions and 54 clinical sites.^24^ Using community-engaged approaches, GUARDD-US implemented clinical decision support (CDS) that conveyed patient-specific genotype and phenotype information in the form of best practice alerts or consultation notes and recommended actions such as reaching BP targets, screening for CKD with urine microalbumin testing, or prescribing an angiotensin-converting enzyme inhibitor (ACEI) or angiotensin receptor blocker (ARB) for individuals with proteinuria.^24^ We hypothesized that, among participants with APOL1-HR, immediate gROR would result in a greater improvement in SBP at 3 months compared with APOL1 gROR delayed until after trial conclusion.
Methods
Study Design
GUARDD-US was a pragmatic (ie, conducted as part of routine clinical practice), randomized clinical trial that evaluated the effect of APOL1 genetic testing on BP reduction, with an enrollment period from July 1, 2020, to September 30, 2023.^25,26^ It was approved by a single institutional review board of record, hosted by Duke University. All participants provided voluntary, written informed consent. This study followed the Consolidated Standards of Reporting Trials (CONSORT) reporting guideline. The full trial protocol and statistical analysis plan are included in Supplement 1.
Participants
We collected self-identified ancestry and race and ethnicity, the latter using the following categories: American Indian, Native American, or Alaska Native; Asian; Black or African American; Hispanic or Latino or Latina; Middle Eastern or North African or Mediterranean; Native Hawaiian or Other Pacific Islander; White or European American, multiple races or ethnicities; and other race or ethnicity, unknown race or ethnicity, or preferred not to answer. Eligible participants were aged 18 to 70 years with documented hypertension and self-reported African ancestry who either (1) lacked diagnoses of diabetes and CKD or (2) had a diagnosis of CKD stage 1 to 4, with or without diabetes. Exclusion criteria included prior APOL1 genotyping; terminal illness; kidney failure (estimated glomerular filtration rate [eGFR] <15 mL/min/1.73 m^2^); use of a left ventricular assist device; patient-reported pregnancy; a liver, kidney, or allogeneic bone marrow transplant. Participants were recruited from 54 clinical sites in 14 affiliated institutions, including academic, community, and safety-net practices in urban and rural settings.
Study Procedures and Interventions
Participants were randomized to receive immediate gROR (intervention group) or delayed gROR after study participation concluded (control group). At baseline, all participants underwent standardized BP measurements, completed a survey, provided a DNA sample for genotyping, and received an educational booklet about hypertension, CKD, and APOL1 testing. At the 3- and 6-month study visits, all participants had repeated BP measurements and surveys including demographic characteristics, medication reconciliation, attitudes about genetics, kidney disease, hypertension, and social determinants. We collected BP measurements during an 8-week study window, either in person (95.6% [6457 of 6754]) or, if not possible, using BPs recorded in the electronic health record (EHR; 4.4% [297 of 6754]). Clinicians received APOL1 results regardless of genotype, via CDS recommendations (as best practice alerts or EHR consultation notes) that included BP targets, recommendations for urine microalbumin testing, and prescription of an ACEI or ARB to individuals with proteinuria, as previously described.^24^ CDS included recommendations to reach a target BP of less than 140/90 mm Hg and consider ASCVD risk criteria to implement more stringent BP targets when indicated. Results were also integrated into EHRs. Trained research coordinators verbally provided genotype results to all participants; used teach-back to enhance comprehension; and provided a written lay summary of results, a personalized low-literacy educational document, and the opportunity to receive free genetic counseling. The intervention group received gROR by telephone call after the baseline study visit and as soon as results were available. The control group received gROR after the study conclusion. We rerandomized only participants at low risk (without 2 APOL1-HR alleles) after study visit 1 at certain sites into a separate pharmacogenomics substudy described elsewhere.^26^
All genotyping was performed in College of American Pathologists–accredited and Clinical Laboratory Improvement Amendments–certified laboratories. A custom polymerase chain reaction–based assay (TaqMan; ThermoFisher) for 3 single-nucleotide variants (rs73885319, rs60910145, and rs71785313) detected the G1 and G2 risk alleles. Study data were collected and managed using REDCap electronic data capture tools.^27^
Outcomes
The primary outcome was SBP change from baseline to 3 months between groups, assessed in a modified intention-to-treat (mITT) analysis among individuals with APOL1-HR (n = 954), who represent a subset of the 6754 individuals randomized to the intervention. Secondary outcomes included appropriate EHR documentation of CKD as a diagnosis and urine microalbumin screening from baseline to 6 months. Another secondary outcome was temporal trend in SBP change over 6 months. Per-protocol subgroup analyses included SBP change from baseline to 3 months among those with uncontrolled BP at enrollment (SBP ≥140 mm Hg or diastolic BP [DBP] ≥90 mm Hg), uncontrolled BP while receiving antihypertensive therapy at enrollment, and CKD. Exploratory outcomes were diastolic BP change, SBP and DBP change 6 months after enrollment, cost-effectiveness (described elsewhere^26^), additional subgroup analyses (age, sex, eGFR, health literacy, educational level, insurance status, socioeconomic status, health care access, prior genetic testing, and medication adherence), and patient-reported measures of genetic testing understanding, satisfaction, and related behaviors.
Sample Size
Based on an SBP SD of 18.1 mm Hg from a pilot study,^20^ 938 individuals with APOL1-HR (469 in each group) were required to detect a difference of 3.5 mm Hg in SBP change from baseline to 3 months between groups with 80% power, a difference similar to that of lifestyle and pharmacologic interventions in CKD^28,29^ that are known to reduce major adverse cardiovascular events.^30^
Interim Analyses
The data safety and monitoring board reviewed 2 blinded interim analyses in a closed session and found that the study did not fulfill criteria for either efficacy or futility. They determined that to maintain 80% power, enrollment needed to be expanded from 5435 to 6750 due to a lower-than-expected APOL1-HR frequency (14.1% [954 of 6754]).
Randomization and Blinding
We randomized participants 1:1 to intervention or control, stratified by clinical site with block randomization (random block sizes of 4 and 8) within each site. Participants, clinicians, and study personnel were not blinded to randomized treatment assignment because genotype results were available in the EHR for the intervention arm. Investigators were blinded to interim analyses and outcomes during the study.
Statistical Analysis
We compared the intervention and control groups among participants with APOL1-HR (G1/G1, G1/G2, or G2/G2), who comprised the mITT population. We assessed SBP change from baseline to 3 months between groups by the t test, using a 2-sided α of .049 to maintain an overall α of .05 accounting for 2 interim analyses. We adjusted the raw P value threshold from .05 to .049 using the Lan-Demets spending function approximating O’Brein-Fleming boundaries for the primary outcome. We conducted a covariate-adjusted linear regression analysis to account for differences in baseline characteristics between intervention and control groups, which included randomized treatment as an explanatory factor and baseline SBP as a covariate. Prespecified baseline covariates included CKD, age, and sex. Secondary, subgroup, and exploratory analyses are reported with difference in proportions, least-square mean estimates, and 95% CIs. The widths of the 95% CIs were not adjusted for multiplicity and should not be used to make definitive conclusions of treatment effects. We planned but did not implement missing data analyses because the percentage of missing data was below the prespecified 10% threshold.
We assessed 2 secondary outcomes (urine microalbumin screening and new CKD diagnosis) categorically (yes or no) by the Wald test for equality of proportions and a third outcome (temporal trend in SBP over 6 months) by a covariate-adjusted repeated-measures mixed model. We assessed the 3 per-protocol analytic subgroups for SBP change from baseline to 3 months (those with baseline CKD [eGFR ≤60 mL/min/1.73 m^2^], uncontrolled BP, and uncontrolled BP with active antihypertensive treatment at baseline) by a covariate-adjusted linear regression. We conducted additional exploratory analyses based on age, sex, eGFR, health literacy, educational level, insurance status, poverty level, health care access, prior non-APOL1 genetic testing, and medication adherence. To control for multiplicity, we applied the Bonferroni method to the secondary analyses and subgroup analyses. The adjusted significance threshold for these analyses was α = .008 (.049/6). Raw P values for these analyses are reported against the Bonferroni-adjusted threshold. We did not adjust 95% CIs or additional exploratory subgroup analyses for multiplicity. All statistical tests were 2-sided. The full statistical analysis plan is included in Supplement 1. All analyses were performed using SAS software, version 9.4 (SAS Institute Inc).
Results
Participants
We enrolled and randomized 6754 participants: 3380 intervention and 3374 control (Figure 1). The mean (SD) age was 55.3 (10.3) years, 4310 participants (63.8%) were female and 2443 (36.2%) were male, the mean (SD) SBP was 133.1 (19.2) mm Hg, 1721 (33.4%) lived below the federal poverty level, and 2585 (38.3%) had a high school education or less (eTable 1 in Supplement 2). All participants self-reported African ancestry: 19 (0.3%) identified as American Indian, Native American, or Alaska Native; 1 (0.01%) as Asian; 6113 (90.5%) as Black or African American; 58 (0.9%) as Hispanic or Latino or Latina; 2 (0.03%) as Middle Eastern or North African or Mediterranean; 4 (0.1%) as Native Hawaiian or Other Pacific Islander; 1 (0.01%) as White or European American, 453 (6.7%) as multiple races or ethnicities; and 102 (1.5%) as other race or ethnicity, unknown race or ethnicity, or preferred not to answer. A total of 96 of 930 participants (10.3%) reported previous genetic testing. Baseline characteristics were balanced between randomization groups. The primary outcome was assessed in an mITT analysis of 954 participants with *APOL1-*HR (14.2%), not all 6754 randomized participants. The 954 participants with *APOL1-*HR were similar to the full cohort and by randomized group, except for having more female participants in the intervention group (326 of 486 [67.1%] vs 274 of 468 [58.5%]) (Table 1). Characteristics overall and by intervention group are presented in eTable 2 in Supplement 2. A total of 192 of 377 participants (50.9%) with uncontrolled BP were prescribed ACEI or ARB therapy at baseline. At baseline, 31.8% of participants (303 of 954) were prescribed 1 antihypertensive medication, 34.1% (325 of 954) were prescribed 2 antihypertensives, and 28.5% (272 of 954) were prescribed 3 or more antihypertensives (eTable 3 in Supplement 2).
Participant Flow DiagramAPOL1 indicates apolipoprotein L1 locus; APOL1-HR indicates APOL1 high-risk genotype.aData from 1 site not included due to missing data.bA total of 4991 participants actively declined: 4866 without reading the informed consent form and 125 after reading it. A total of 1182 participants passively declined after reaching the maximum number of contact attempts.cParticipants did not attend the baseline visit or could not be reached for scheduling.dThe primary analysis focused on the change in systolic blood pressure (BP) from baseline to 3 months between treatment groups. Follow-up continued until 6 months after randomization. In the immediate APOL1 testing group, 414 participants completed the 6-month visit, while 72 discontinued (65 lost to follow-up, 1 withdrawn by investigators, and 6 due to early site closure). In the delayed APOL1 testing group, 397 participants completed the 6-month visit, and 71 discontinued (69 lost to follow-up, 1 death, and 1 due to early site closure). Participants missing the 3-month or 6-month visits were included in analyses if an appropriate BP reading was available in the electronic health record.
Primary BP Outcome
APOL1 gROR occurred at a median of 16 days (IQR, 13-22 days), with 99.0% of results (944 of 954) received by 3 months after randomization. In each group, treatment crossover was below 1%, and study completion was similar (intervention, 414 of 486 [85.2%]; control, 397 of 468 [84.8%]). The mean (SD) baseline SBP of the intervention group (132.5 [18.9] mm Hg) and the mean (SD) baseline SBP of the control group (133.8 [19.5] mm Hg) were similar (Figure 2; Table 2). At 3 months, the mean (SD) SBP decreased by 1.8 (18.8) mm Hg in the intervention group and 1.5 (17.3) mm Hg in the control group, a between-group mean difference of −0.3 mm Hg (95% CI, −2.7 to 2.1 mm Hg) (P = .78). The mean (SD) covariate-adjusted SBP change from baseline to 3 months did not differ between groups (difference, −0.5 [1.1] mm Hg [95% CI, −2.6 to 1.6 mm Hg]) (Table 2; eTable 4 in Supplement 2). Similar patterns were observed in the DBP change from baseline to 3 months (difference, −0.9 mm Hg [95% CI, −2.2 to 0.5 mm Hg]) and DBP change from baseline to 6 months (difference, −1.3 mm Hg [95% CI, −2.7 to 0.1 mm Hg]). A mixed-model analysis for the trend in change in SBP from baseline to 6 months did not demonstrate a difference between groups (difference, −1.1 mm Hg [95% CI, −2.8 to 0.7 mm Hg]). At baseline, 60.0% of participants in the intervention group (291 of 485) and 60.8% in the control group (284 of 467) had controlled BP (<140/90 mm Hg). At 3 months, 64.6% of participants in the intervention group (288 of 446) and 63.6% of participants in the control group (273 of 429) had a BP less than 140/90 mm Hg. At 6 months, 65.1% of participants in the intervention group (276 of 424) and 62.0% of participants in the control group (255 of 411) had controlled BP. A sensitivity analysis excluded the EHR-derived BPs obtained in 4.4% (42 of 954) of 3-month visits and did not alter the findings (eTable 5 in Supplement 2).
Line Graph of Change in Systolic Blood Pressure and Diastolic Blood PressureAPOL1 indicates apolipoprotein L1 locus. Error bars indicate 95% CIs.
Per-Protocol Subgroup Analyses
Per-protocol subgroup analyses were conducted among those with uncontrolled BP or CKD at baseline. The mean (SD) baseline SBP in the subgroup with uncontrolled BP was similar between treatment arms (intervention, 148.6 [16.7] mm Hg; control, 151.1 [17.4] mm Hg). There was a significant interaction between the uncontrolled BP subgroup factor and randomized treatment (P = .004 for interaction, below the Bonferroni multiple testing threshold of P < .008): the intervention group had a significantly greater mean (SD) SBP change from baseline to 3 months than the control group (−11.4 [18.7] mm Hg vs −7.1 [20.3 mm Hg]) (Figure 3; eTable 4 in Supplement 2). A covariate-adjusted regression analysis yielded a least-square mean difference of SBP change from baseline to 3 months of −4.1 mm Hg (95% CI −7.7 to −0.5 mm Hg) favoring immediate gROR (eFigure 1 and eTable 4 in Supplement 2). The magnitude of SBP reduction was maintained at 6 months (not statistically significant). Individuals with uncontrolled BP receiving antihypertensive therapy at baseline had a similar interaction (difference in SBP change from baseline to 3 months, −4.3 mm Hg [95% CI −8.0 to −0.5 mm Hg]; P = .004 for interaction). Baseline CKD diagnosis did not modify the effect of the intervention on SBP change from baseline to 3 months (0.8 mm Hg [95% CI, −3.0 to 4.5 mm Hg]) (eFigure 1 and eTable 4 in Supplement 2). In contrast with the direction of effect in the subgroup with uncontrolled BP, we identified a trend of increasing BP among the intervention subgroup with controlled baseline BP (intervention, 121.7-125.8 mm Hg; control, 122.7-124.8 mm Hg; difference in SBP change from baseline to 3 months, 2.7 mm Hg [95% CI, −0.2 to 5.6 mm Hg]) (eTable 6 in Supplement 2).
Line Graph of Change in Systolic Blood Pressure and Diastolic Blood Pressure in the Subgroup With Uncontrolled Blood Pressure at BaselineAPOL1 indicates apolipoprotein L1 locus. Error bars indicate 95% CIs.
To provide context, we examined the interaction between age, sex, baseline eGFR, educational level, self-reported medication adherence, health literacy, health insurance, poverty level, and prior non-APOL1 genetic testing with the treatment effect of gROR as exploratory analyses. The intervention only held a greater effect on SBP change from baseline to 3 months among individuals with incomes exceeding 125% of the federal poverty level (difference in SBP change from baseline to 3 months, 2.9 mm Hg [95% CI, –1.1 to 6.9 mm Hg]; P = .03 for interaction without Bonferroni correction) (eFigure 2 in Supplement 2.
Secondary Outcomes of CKD Screening
At baseline, the prevalence of urine microalbumin testing within 1 year of study entry was similar in the intervention (207 of 473 [43.8%]) and control (221 of 454 [48.7%]) groups (Table 2). At 6 months, among those without baseline urine microalbumin testing, there were more microalbumin testing orders in the intervention group (95 of 266 [35.7%]) than in the control group (43 of 233 [18.5%]), with a 17.3% between-group difference (95% CI, 9.6%-24.9%; P < .001). CKD diagnosis documentation from baseline to 6 months increased more in the intervention group (31 of 347 [8.9%]) than in the control group (10 of 313 [3.2%]), with a difference of 5.7% (95% CI, 2.2%-9.3%; P = .002). Among those without CKD at baseline, documentation of CKD diagnoses increased more in the intervention group (24 of 308 [7.8%]) than in the control group (1 of 267 [0.4%]) (eTable 7 in Supplement 2).
Treatment Fidelity
In the 954 participants with APOL1-HR, no change in the number of antihypertensive medications prescribed was observed between groups (eTable 3 in Supplement 2). In the uncontrolled BP subgroup (n = 377) intervention arm, the net proportion of participants with antihypertensive medication added were 3.3% (6 of 181) at 3 months and 10.0% (17 of 170) at 6 months. In the control arm, the net proportion of participants with antihypertensive medication added were 0.6% (1 of 167) at 3 months and 2.0% (3 of 148) at 6 months (eTable 3 in Supplement 2). Antihypertensive additions were distributed across multiple medication classes.
Among the 954 participants with APOL1-HR, we observed no difference in self-reported nonadherence between intervention (195 of 467 [41.8%]) and control (181 of 444 [40.8%]) arms. There were few differences between groups related to physical activity or dietary changes (eTable 8 in Supplement 2). In the intervention arm, 229 of 412 participants (55.6%) reported greater physical activity and 255 of 411 participants (62.0%) reported a healthier diet. In the control arm, 208 of 395 participants (52.7%) reported greater physical activity and 229 of 396 participants (57.8%) reported healthy diet changes.
Patient-Reported Outcomes
Participants found the APOL1 information provided by research coordinators sufficient (821 of 856 [95.9%]) and easy to understand (789 of 857 [92.1%]), and most would get tested again (414 of 440 [94.1%]) (eTable 8 in Supplement 2). Only 7 of 954 participants with APOL1-HR (0.7%) expressed distress related to the gROR. All participants were offered to meet in person or virtually with a genetic counselor at no cost to them, and only 5 of 954 (0.5%) chose this option.
Discussion
The GUARDD-US study results supported the null hypothesis, demonstrating that immediate provision of *APOL1-*HR genotype results to participants and clinicians did not improve SBP. Among a prespecified subgroup of participants with elevated BP at baseline, immediate *APOL1-*HR gROR resulted in a −4.1 mm Hg (95% CI, −7.7 to −0.5 mm Hg) greater SBP change from baseline to 3 months compared with those with delayed gROR, a finding that may prove important and should be explored in future studies. A similar improvement in SBP change from baseline to 3 months was observed among those with uncontrolled baseline BP receiving antihypertensive therapy, but not among a CKD subgroup that included a mix of participants with controlled and uncontrolled BP. Only 39.5% (n = 377) of participants with APOL1-HR had a SBP higher than 140 mm Hg or a DBP higher than 90 mm Hg. The lower mean baseline SBP of the GUARDD-US population (133.1 mm Hg) may, in part, explain the negative results compared with other studies of uncontrolled BP among populations with African ancestry.^31^ For individuals with controlled SBP, clinicians and patients may not have deemed further BP reduction necessary, given the lack of guideline uniformity about reaching a target SBP of 120 or 130 mm Hg in general, and among individuals with APOL1-HR.^32,33^
SBP increased at 3 months in both study arms for those with controlled BP (intervention, 121.7-125.8 mm Hg; control, 122.7-124.8 mm Hg), yielding a nonsignificantly greater SBP change from baseline to 3 months in the intervention arm (covariate-adjusted increase, 2.7 mm Hg [95% CI, −0.2 to 5.6 mm Hg; P = .07). Still, their BPs remained well controlled (<130 mm Hg for most participants). Although only 0.7% reported distress from their APOL1-HR gROR, we cannot exclude an effect from APOL1-HR gROR contributing to increased anxiety and SBP, or a labeling effect on white-coat hypertension, which some (but not all)^34^ studies have demonstrated.^35,36^
Immediate APOL1 gROR led to significant improvements in urine microalbumin screening for CKD and in CKD EHR diagnosis documentation. CKD is an ASCVD risk criteria for which the American Heart Association recommends more stringent BP targets.^5^ Increased CKD recognition may contribute to the positive effect of gROR observed in the subgroup with uncontrolled BP. Pragmatic trial structures are suboptimal for mechanistic inference; however, we did collect medication data and participant-reported outcomes by survey and medication review of pill bottles with participants. GUARDD-US provided gROR to both clinicians (who prescribe) and participants (who control diet and exercise). CDS alerts prioritized recommendations for ACEI or ARB therapy; however, 50.9% of patients with uncontrolled BP (192 of 377) were already prescribed these medications at baseline. In the subgroup with uncontrolled BP, we observed intensification of antihypertensive therapy, which was distributed across medication classes. Survey data suggested increased attention to diet and physical activity in the APOL1-HR intervention arm, but we used very brief measures, and future studies should assess the effects of diet and physical activity in more detail to draw conclusions about any effect of gROR.
The methods for testing and gROR were well received by participants. We created GUARDD-US educational and gROR materials in collaboration with our expert community partners, which we adapted based on formative research and results of the GUARDD pilot. This may explain why more than 95% of GUARDD-US participants reported satisfaction with gROR and few participants elected to meet with a genetic counselor. Survey data from the GUARDD pilot study also suggested that knowledge of APOL1 status countered harmful stereotypes that hypertension control among Black individuals primarily relates to medication nonadherence or low health literacy.^37^
Strengths and Limitations
GUARDD-US has some strengths, including the potential for generalizability, low refusal rates (15.5%), high retention (92%) and satisfaction rates, participant sociodemographic and geographic diversity, and implementation across safety-net, academic, and community clinics; health systems; and EHRs. GUARDD-US also has some limitations. Knowledge of genetic risk is only 1 factor affecting BP; effects of harmful social determinants, which disproportionately affect Black communities, contribute to suboptimal BP control.^38,39,40^ Although this is the largest intervention trial among those with APOL1-HR, the mITT analysis is not fully protected by randomization, and there may be unrepresented factors that contribute to residual confounding despite our rigorous statistical methods. The mITT analysis was designed to include participants with 2 APOL1-HR alleles. We did not study monoallelic carriers who we now know possess an intermediate phenotype for CKD risk.^41^ Patients with uncontrolled BP were not randomized but rather were selected as a per-protocol population. APOL1-HR gROR was delivered with CDS, and we could not separate the effects of gROR and CDS. Finally, we reported data on the effect of gROR on urine albumin-creatinine ratio orders, not completion of UACR testing.
Conclusions
Our large multicenter randomized clinical trial enrolled 6754 individuals of African ancestry, demonstrating significant engagement with high satisfaction from gROR. APOL1-HR gROR to clinicians and participants led to improved SBP among individuals with uncontrolled BP, which merits further investigation for future trials. It also led to increased testing for and diagnosis of CKD, which is important given that that CKD is significantly undertested for and underdiagnosed in primary care. Although consensus indications for clinical APOL1 genetic testing have not been formalized,^42^ GUARDD-US results corroborate findings that individuals with self-identified African ancestry and elevated BP, as well as their clinicians, may use knowledge of the APOL1 genotype to improve BP control.^20,37^
The reference list from the paper itself. Each links out to its DOI / PubMed record.
- 1Tedla FM, Brar A, Browne R, Brown C. Hypertension in chronic kidney disease: navigating the evidence. Int J Hypertens. 2011;2011:132405. doi:10.4061/2011/132405 21747971 PMC 3124254 · doi ↗ · pubmed ↗
- 2Arnett DK, Blumenthal RS, Albert MA, . 2019 ACC/AHA guideline on the primary prevention of cardiovascular disease: executive summary: a report of the American College of Cardiology/American Heart Association Task Force on Clinical Practice Guidelines. J Am Coll Cardiol. 2019;74(10):1376-1414. doi:10.1016/j.jacc.2019.03.009 30894319 PMC 8344373 · doi ↗ · pubmed ↗
- 3Cheung AK, Chang TI, Cushman WC, . Executive summary of the KDIGO 2021 Clinical Practice Guideline for the Management of Blood Pressure in Chronic Kidney Disease. Kidney Int. 2021;99(3):559-569. doi:10.1016/j.kint.2020.10.026 33637203 · doi ↗ · pubmed ↗
- 4Theodorakopoulou M, Ortiz A, Fernandez-Fernandez B, Kanbay M, Minutolo R, Sarafidis PA. Guidelines for the management of hypertension in CKD patients: where do we stand in 2024? Clin Kidney J. 2024;17(suppl 2):36-50. doi:10.1093/ckj/sfae 278 39583143 PMC 11581767 · doi ↗ · pubmed ↗
- 5Jones DW, Ferdinand KC, Taler SJ, . AHA/ACC/AANP/AAPA/ABC/ACCP/ACPM/AGS/AMA/ASPC/NMA/PCNA/SGIM guideline for the prevention, detection, evaluation and management of high blood pressure in adults: a report of the American College of Cardiology/American Heart Association Joint Committee on Clinical Practice Guidelines. Circulation. 2025;152(11):e 114-e 218. doi:10.1161/CIR.0000000000001396 40811497 · doi ↗ · pubmed ↗
- 6Ostchega Y, Fryar CD, Nwankwo T, Nguyen DT. Hypertension prevalence among adults aged 18 and over: United States, 2017–2018. NCHS Data Brief. 2020;(364):1-8. 32487290 · pubmed ↗
- 7Ayanian JZ, Landon BE, Newhouse JP, Zaslavsky AM. Racial and ethnic disparities among enrollees in Medicare Advantage plans. N Engl J Med. 2014;371(24):2288-2297. doi:10.1056/NEJ Msa 1407273 25494268 PMC 4381536 · doi ↗ · pubmed ↗
- 8Ndumele CE, Rangaswami J, Chow SL, ; American Heart Association. Cardiovascular-kidney-metabolic health: a presidential advisory from the American Heart Association. Circulation. 2023;148(20):1606-1635. doi:10.1161/CIR.0000000000001184 37807924 · doi ↗ · pubmed ↗