Geographic Variation in Primary Care Spending Among the Commercially Insured Population
Kun Li, M. Kate Bundorf, Sara Debab, Rachel Upton, Robert Saunders, Frank McStay

TL;DR
This study explores how much money is spent on primary care for people with commercial insurance in different regions of the US.
Contribution
The study provides new insights into geographic disparities in primary care spending among commercially insured individuals.
Findings
Primary care spending varies significantly across core-based statistical areas in the US.
The study quantifies the level of spending and identifies regions with higher or lower expenditures.
Abstract
This cross-sectional study examined the level and variation of primary care spending among the commercially insured population across all core-based statistical area in the US.
Genes, proteins, chemicals, diseases, species, mutations and cell lines named across the full text — each resolved to its canonical identifier and authoritative record.
Click any figure to enlarge with its caption.
 Figure
| Characteristic | No. (%) |
|---|---|
| Total, No. | 25 905 428 |
| Sex | |
| Female | 12 979 555 (50.1) |
| Male | 12 925 873 (49.9) |
| Age group, y | |
| 0-17 | 5 699 083 (22.0) |
| 18-24 | 3 010 940 (11.6) |
| 25-34 | 3 873 647 (15.0) |
| 35-44 | 4 474 354 (17.3) |
| 45-54 | 4 523 976 (17.5) |
| 55-64 | 4 323 428 (17.0) |
Peer Reviews
No public reviews on file for this paper yet. If you reviewed it on a platform where reviews are public (OpenReview, ICLR, NeurIPS, ICML), you can paste yours below so the community can read it here.
Videos
No videos yet. Explain this paper in a talk, walkthrough, or lecture? Add one.
Taxonomy
TopicsHealthcare Policy and Management · Primary Care and Health Outcomes · Healthcare Systems and Reforms
Introduction
Primary care has been the focus of numerous delivery and payment reforms, given its important role in prevention, care coordination, and chronic disease management.^1^ While accurate primary care spending estimates are critical in benchmarking and rate setting, existing data were primarily at the national or state level, offering limited insights into local population profiles and market conditions.^2,3^ We assessed the level and variation of primary care spending among the commercially insured population across all core-based statistical areas (CBSAs) in the US and examined how enrollee demographics and service prices are associated with differences in spending.
Methods
This cross-sectional study followed the STROBE reporting guideline and was approved by Duke University with a waiver of informed consent. Using the Health Care Cost Institute claims data, we analyzed one-third of US employer-sponsored insurance enrollees aged 64 years or younger with 12-month medical coverage in 2022. Following the literature,^2,4^ we used the narrow definition of primary care spending by measuring enrollees’ annual spending on primary care services rendered by primary care clinicians. Spending included the total amount paid by the insurer and enrollee. Primary care clinicians included those with a code of family practice, internal medicine, pediatric medicine, geriatric medicine, gynecology, physician assistants, or nurse practitioners on more than 50% of professional claims. Primary care services were defined by Current Procedural Terminology (CPT) codes, including evaluation and management visits, preventive visits, care transition or coordination services, and in-office preventive services, screening, and counseling (eMethods in Supplement 1).^5^
We compared 3 CBSA-level mean spending measures—unadjusted, demographic-adjusted (age group and sex), and demographic and price-adjusted (eMethods in Supplement 1). Examining spending at the CBSA level allowed us to capture potential commuting patterns of enrollees for seeking care in urban areas and adjacent communities. To measure cross-CBSA variation in spending, we reported the SD and IQRs of CBSA-level spending. Data were analyzed from October 1, 2024, to March 15, 2025, using Stata SE version 18 (StataCorp).
Results
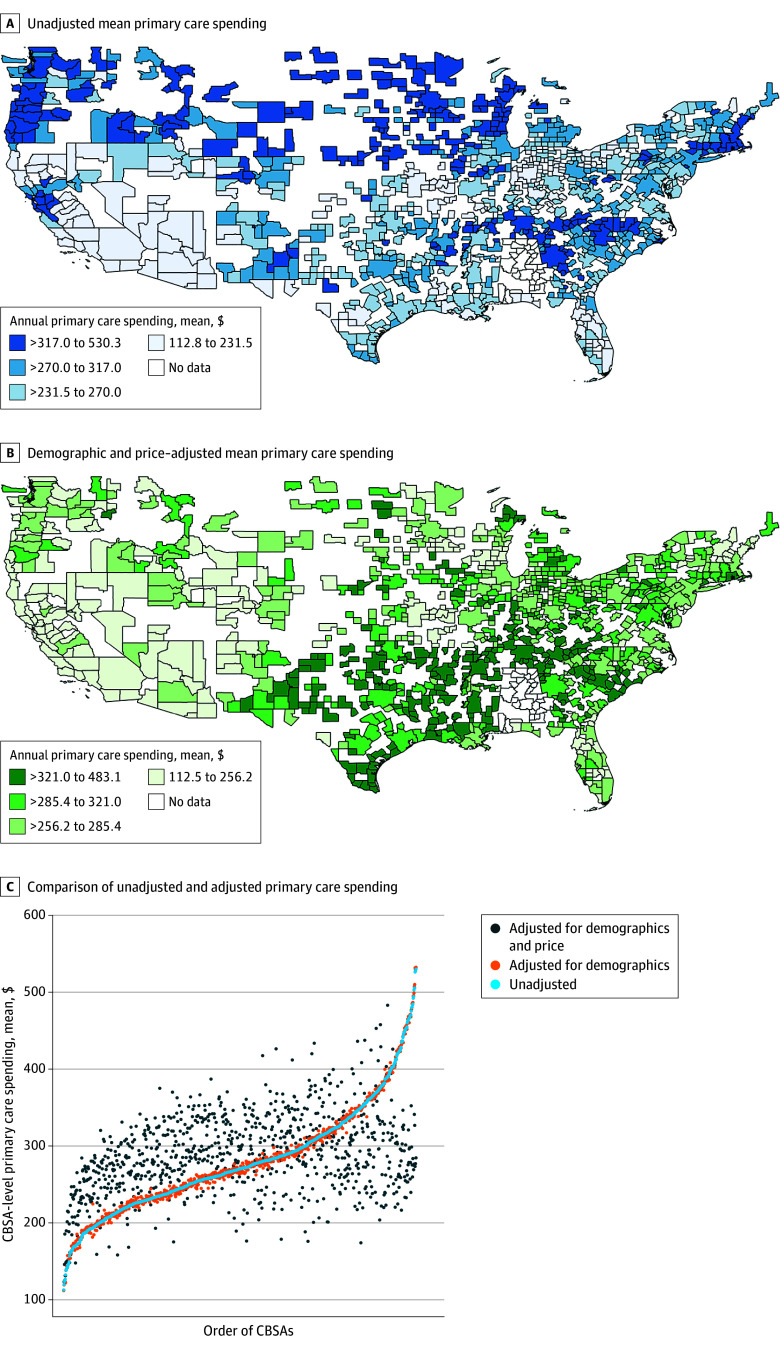
Among 25 905 428 enrollees (12 979 555 female [50.1%]) (Table) in 926 CBSAs, mean (SD) annual primary care spending was 383.60) nationally and varied by CBSA, from 530.30 in Mankato-North Mankato, Minnesota, for unadjusted spending (Figure A). After adjusting for enrollee demographics and service prices, differences in adjusted and unadjusted spending were greater than 10% in 73.0% of CBSAs (Figure B).
Mean Primary Care Spending by Core-Based Statistical Areas (CBSAs) and Adjusted and Unadjusted ComparisonsMean primary care spending by core-based statistical areas that was (panel A) unadjusted and (panel B) adjusted for enrollee age group, sex, and price. Data for Alabama were suppressed per data contributors. Panel C shows the comparison of mean primary care spending by unadjusted and adjusted CBSAs. Each dot represents a CBSA. The x-axis represents the order of CBSAs by the magnitude of unadjusted mean primary care spending. Data for Alabama and Hawaii were suppressed per data contributors.
Figure C shows unadjusted and adjusted CBSA-level primary care spending, ordered by the magnitude of the unadjusted spending. Demographic-adjusted spending did not largely deviate from unadjusted spending. Cross-CBSA variations were similar for unadjusted spending (median, 70.76; IQR, 317.00) and demographic-adjusted spending (median, 70.80; IQR, 316.20). Demographic and price-adjusted spending, in contrast, differed in magnitude and the ordering of CBSAs based on spending levels relative to the unadjusted spending, resulting in lower cross-CBSA variations primarily driven by variations in use (median, 54.50; IQR, 324.70).
Discussion
The level of primary care spending varied substantially across CBSAs, regardless of whether adjustments were made for enrollee demographics and service prices. This is consistent with existing evidence on variations in health care spending.^6^ The observed geographic variation in primary care spending was largely due to differences in negotiated price levels rather than variation in enrollees’ age group and sex. Variations in primary care use also contributed to differences in spending.
This study has limitations. Our definition of primary care services may have excluded some primary care clinicians or services. Additionally, the data are not nationally representative.
Our findings are relevant to the design of primary care-focused policies and payment models. By distinguishing the contributions of demographic composition, price, and use, policymakers and payers can identify whether spending differences stem from underlying population needs or market dynamics when setting capitation rates or performance benchmarks for primary care services.
The reference list from the paper itself. Each links out to its DOI / PubMed record.
- 1Move to value-based payment in primary care: advancing primary care innovation in Medicaid managed care. Center for Health Care Strategies. Accessed January 28, 2026. https://www.chcs.org/media/PCI-Toolkit-VBP-Tool_111720.pdf
- 2Reiff J, Brennan N, Fuglesten Biniek J. Primary care spending in the commercially insured population. JAMA. 2019;322(22):2244-2245. doi:10.1001/jama.2019.1605831821423 PMC 7081755 · doi ↗ · pubmed ↗
- 3Cohen DJ, Totten AM, Phillips RL Jr, Jabbarpour Y, De Voe J. Measuring primary care spending in the US by state. JAMA Health Forum. 2024;5(5):e 240913. doi:10.1001/jamahealthforum.2024.091338758567 PMC 11102012 · doi ↗ · pubmed ↗
- 4Reid R, Damberg C, Friedberg MW. Primary care spending in the fee-for-service Medicare population. JAMA Intern Med. 2019;179(7):977-980. doi:10.1001/jamainternmed.2018.874730985864 PMC 6583869 · doi ↗ · pubmed ↗
- 5Bailit MH, Friedberg MW, Houy ML. Standardizing the measurement of commercial health plan primary care spending. Milbank Memorial Fund. Accessed September 1, 2024. https://www.milbank.org/publications/standardizing-measurement-commercial-health-plan-primary-care-spending/
- 6Cooper Z, Stiegman O, Ndumele C, Staiger B, Skinner J. Geographical variation in health spending across the US among privately insured individuals and enrollees in Medicaid and Medicare. JAMA Netw Open. 2022;5(7):e 2222138. doi:10.1001/jamanetworkopen.2022.2213835857326 PMC 9301520 · doi ↗ · pubmed ↗