The role of microflow patterns combined with greyscale ultrasound in enhancing diagnostic validity and reducing unnecessary biopsy rate of thyroid nodules
Wanying Li, Luying Gao, Yahong Wang, Min Zhang, Yiyan Du, Hongyan Wang, Jianchu Li

TL;DR
Combining microflow imaging with ultrasound improves thyroid nodule diagnosis and reduces unnecessary biopsies.
Contribution
Microflow patterns on superb microvascular imaging enhance diagnostic accuracy and reduce biopsy rates when combined with greyscale ultrasound.
Findings
Microflow patterns improved diagnostic performance of ultrasound risk stratification systems for thyroid nodules.
Combining SMI with ultrasound reduced unnecessary biopsy rates by 1.27–20.30%.
C-TIRADS had the lowest biopsy rate reduction after SMI adjustment (from 38.04% to 17.74%).
Abstract
To explore the value of microflow patterns based on superb microvascular imaging (SMI) combined with greyscale ultrasound in thyroid nodule diagnosis and biopsy recommendation. Adult patients with thyroid nodules were recruited from May 2023 to February 2024. The greyscale features of nodules were evaluated according to the five ultrasound risk stratification systems (RSSs). The microflow patterns on SMI were used to adjust the category of nodules. The crab claw-like and the root hair-like patterns were malignant signs for upgrading, with the wheel-like and the arborescent patterns for downgrading. The diagnostic performance and biopsy recommendation of microflow patterns combined with greyscale ultrasound were analyzed. A total of 253 nodules (136 malignant, 117 benign) in 203 patients were included. Chinese Thyroid Imaging Reporting and Data System (C-TIRADS) owned the best…
Genes, proteins, chemicals, diseases, species, mutations and cell lines named across the full text — each resolved to its canonical identifier and authoritative record.
Click any figure to enlarge with its caption.
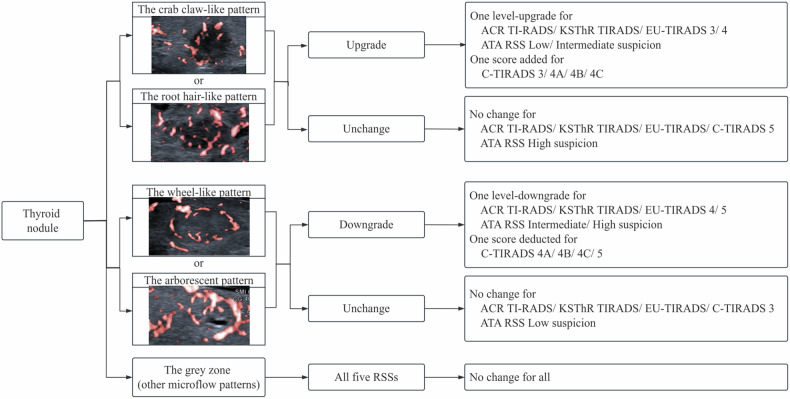 Figure 1
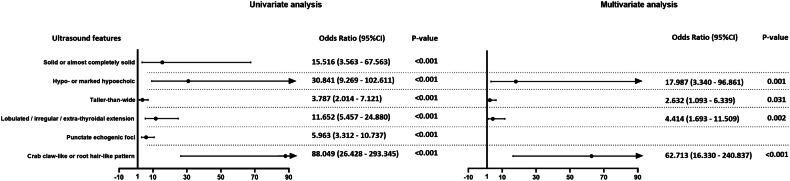 Figure 2
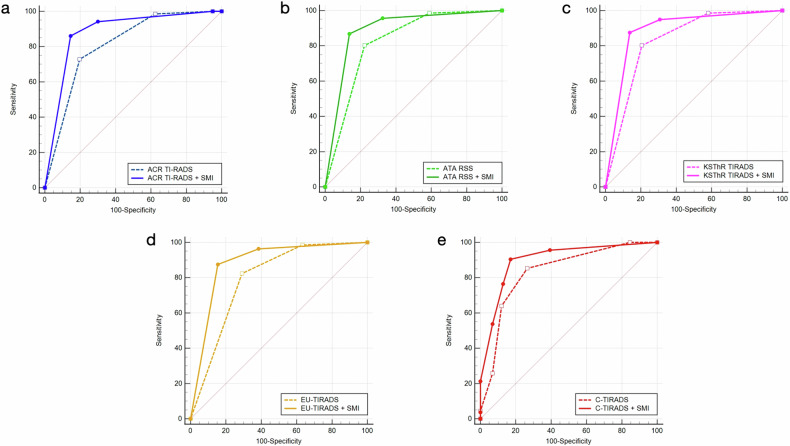 Figure 3
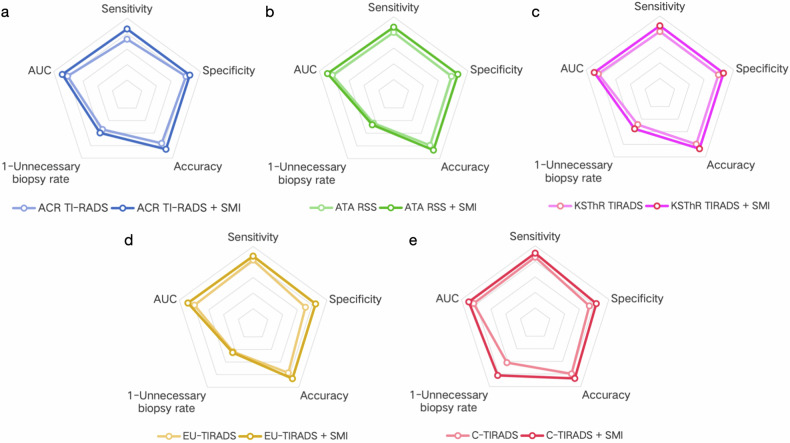 Figure 4
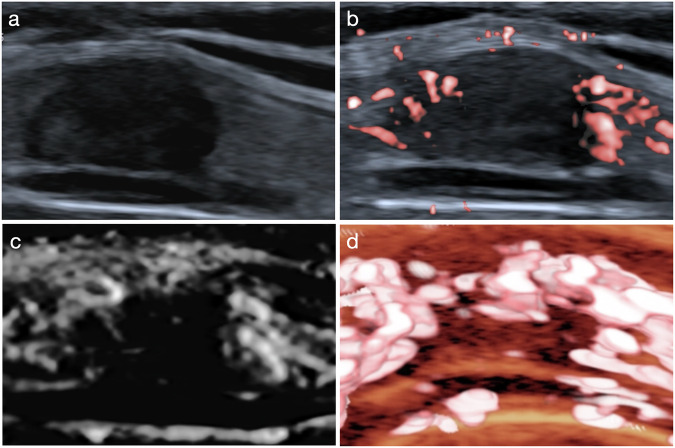 Figure 5
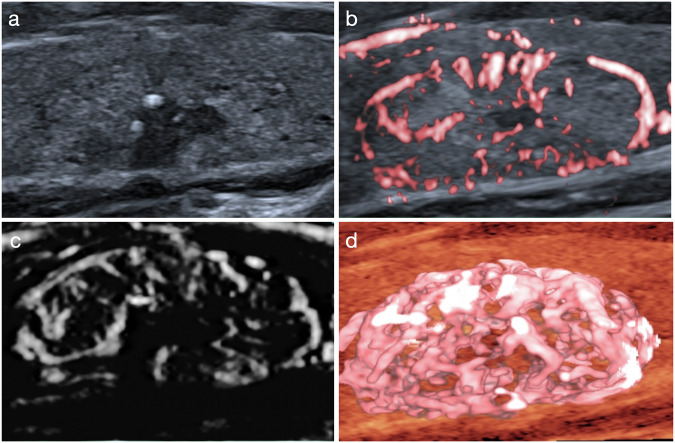 Figure 6
 Figure 7
- —National High Level Hospital Clinical Research Funding
- —http://dx.doi.org/10.13039/501100012226Fundamental Research Funds for the Central Universities
Peer Reviews
No public reviews on file for this paper yet. If you reviewed it on a platform where reviews are public (OpenReview, ICLR, NeurIPS, ICML), you can paste yours below so the community can read it here.
Videos
No videos yet. Explain this paper in a talk, walkthrough, or lecture? Add one.
Taxonomy
TopicsThyroid Cancer Diagnosis and Treatment · Venous Thromboembolism Diagnosis and Management · Ovarian cancer diagnosis and treatment
Introduction
Recent years have witnessed a rise in the incidence of thyroid cancer, ranking as the seventh most prevalent cancer worldwide [1]. Though the overall prognosis of thyroid cancer is great, accurate preoperative diagnosis is crucial to the surgery decision and follow-up plan. With the growing understanding of the indolent nature of thyroid cancers [2], enhancing diagnostic accuracy but reducing the risk of overdiagnosis and overtreatment is of great clinical value.
Ultrasound is the preferred method for examining thyroid cancer. To solve the aforementioned problem, ultrasound risk stratification systems (RSSs) like Thyroid Imaging Reporting and Data System (TI-RADS) were developed to help evaluate the malignancy risk of thyroid nodules and establish criteria for biopsy by ultrasound. But these RSSs are based on greyscale ultrasound, and the specificity for recommending biopsy is low [3, 4].
Angiogenesis plays a vital role in tumor development, invasion, and metastasis [5]. However, the sensitivity of color Doppler flow imaging (CDFI) is far from satisfactory for depicting neovessels of thyroid cancer, and power Doppler flow imaging (PDFI) is limited by clutter and overflow when displaying minute vessels [6]. Superb microvascular imaging (SMI), as the new ultrasonic Doppler technology, owns superiority in tiny vessels and microflows with low velocity. Besides, it is convenient and noninvasive, which makes it possible for the vascular index to be widely used clinically. We first came up with the “microflow pattern” index on SMI to describe the architecture formed by the internal and peripheral microflow of thyroid nodules and confirmed that microflow patterns benefit the differentiation between benign and malignant thyroid nodules in our previous study [7]. However, the effect of microflow patterns combined with greyscale ultrasound, which is more suitable for clinical use, remains unknown.
Therefore, our study aimed to figure out the added value of SMI to greyscale ultrasound by comparing the diagnostic validity and unnecessary biopsy rate of commonly used RSSs before and after the combination with microflow patterns for thyroid nodules.
Materials and methods
This study was approved by the Institutional Review Board of Peking Union Medical College Hospital (protocol number K3557). Written informed consent of all patients was obtained.
Study participants
From May 2023 to February 2024, 300 consecutive patients with thyroid nodules in our center were prospectively recruited. The inclusion criteria were (1) aged 18 years or older, (2) preoperative conventional ultrasound and SMI examination were approved, (3) fine needle aspiration biopsy (FNAB) or surgical procedure was planned for pathological results, and (4) no history of thyroid surgery or preoperative treatment like thermal ablation therapy. The indications for FNAB were referred to the Chinese TI-RADS (C-TIRADS) [8] or the patients’ insistence. 97 cases were excluded for (1) loss to follow-up or canceled operation for personal reasons (n = 21), (2) the vascularity detection of the nodules near the cervical arteries was influenced by the arterial pulsation (n = 8), (3) entirely calcified nodules with posterior acoustic shadowing (n = 3), (4) failure of one-to-one correspondence between the ultrasound results and pathological results when multiple nodules existed (n = 9), (5) follicular lesions of undetermined significance or nodules of Bethesda grades I, III and IV (n = 56). Nodules of malignant pathological results after surgery or Bethesda V/VI after FNAB were included in the malignant group, and those with benign histopathological results or Bethesda II were included in the benign group.
Image acquisition
One radiologist with 5 years of experience in thyroid ultrasound scanning performed the ultrasound examination for all the patients using Aplio 500 (Canon Medical Systems Corp.) equipped with a 5–14 MHz linear transducer or Aplio 800 (Canon Medical Systems Corp.) with a 5–18 MHz linear transducer. Patients were instructed to lie supine, tilt their head back to fully expose the examination area and breathe smoothly, avoiding swallowing as much as possible. Greyscale ultrasound was performed comprehensively to identify the thyroid nodules in transverse and longitudinal planes. Then SMI was used for vascular features with minimum pressure applied to the transducer to avoid vessel collapse. The region of interest was set to include the entire nodule with 3–5 mm of the surrounding parenchyma. The color gain was adjusted as high as possible to keep the microflows but suppress the background noise. Besides, the scale was set at 1.0–2.5 cm/s, frame rate 25–60 f/s, dynamic range 60 dB. Monochrome SMI (mSMI) predominated in demonstrating microflow patterns owing to the high sensitivity, while color SMI (cSMI) served for the position relation of microflows and nodules and distinguishing microflows from calcifications. Smart-3D was also constructed for the three-dimensional view of microflow patterns based on cSMI. Cine clips on greyscale ultrasound, mSMI and cSMI were saved.
Data interpretation
Two radiologists with over 5 years of experience in thyroid ultrasound independently analyzed the videos and classified the nodules according to greyscale features. Disagreement was solved by consulting an expert radiologist with over 20 years of experience in thyroid ultrasound. The largest diameter was recorded as the size of the nodules. The location of nodules was classified as left lobe, right lobe and isthmus. We referred to the American College of Radiology (ACR) TI-RADS [9] for identifying greyscale features of nodules since it gave a comprehensive interpretation. Though RSSs varied, the suspicious features were similar, and we regarded solid composition, hypo- or marked hypoechogenicity, taller-than-wide shape, lobulated or irregular margin or extra-thyroidal extension and punctate echogenic foci as malignant greyscale features for thyroid nodules. Each nodule was graded according to the ACR TI-RADS [9], the American Thyroid Association (ATA) RSS [10], Korean Society of Thyroid Radiology (KSThR) TIRADS [11], European TI-RADS (EU-TIRADS) [12] and C-TIRADS [8], respectively. For nodules that were not classifiable by the ATA RSS, the intermediate suspicion category was given [13]. Biopsy recommendation of each nodule according to different RSSs was also recorded.
Three radiologists with 10 years, 6 years, and 3 years of experience in thyroid ultrasound observed the microflow pattern based on SMI of nodules. The interpreted results were recorded separately, and the radiologists reviewed again for the microflow pattern 6 months later, blinded to the previous ultrasound and pathological results. According to the results of our previous research, the crab claw-like pattern and the root hair-like pattern were microflow characteristics of malignant thyroid nodules with the wheel-like pattern and the arborescent pattern of benign nodules [7]. Owing to this, we divided the microflow patterns into three types: the crab claw-like or the root hair-like pattern, the wheel-like or the arborescent pattern, and the gray zone (for which none of the aforementioned patterns could be assigned). The crab claw-like pattern was an aggregation of multiple penetrating vessels; the root hair-like pattern was a large penetrating vessel giving out small branches inside the nodule; the wheel-like pattern represented peripheral circumferential vessels with some branches inside the nodule; the arborescent pattern was a large branch from the circumferential vessel to the inside of the nodule with small branches [7]. Then we used the microflow pattern to adjust the grade of each nodule. For nodules with the crab claw-like pattern or the root hair-like pattern, a one-level upgrade was made for ACR TI-RADS, ATA RSS, KSThR TIRADS, EU-TIRADS, and one score was added for C-TIRADS. For nodules with the wheel-like pattern or the arborescent pattern, a one-level downgrade was made for ACR TI-RADS, ATA RSS, KSThR TIRADS, EU-TIRADS, and one score was deducted for C-TIRADS. The original grade remained still for nodules with a microflow pattern of gray zone. No upgrade was made for nodules of TR5 and high suspicion, with no downgrade for nodules of TR3 and low suspicion. The flowchart of classification regulation is shown in Fig. 1. Biopsy recommendation of each nodule with the adjusted grade according to different RSSs was also recorded.Fig. 1. The flowchart of classification regulation by microflow patterns on SMI combined with greyscale ultrasound for thyroid nodules
Statistical analysis
The Kolmogorov-Smirnov test was used for the normality of continuous variables. The age of patients and the size of nodules were continuous variables that did not form a normal distribution, and a median with interquartile range (IQR) was calculated. Categorical variables were expressed as frequencies. The location, greyscale features and microflow pattern of nodules in malignant and benign groups were compared by the \documentclass[12pt]{minimal} \usepackage{amsmath} \usepackage{wasysym} \usepackage{amsfonts} \usepackage{amssymb} \usepackage{amsbsy} \usepackage{mathrsfs} \usepackage{upgreek} \setlength{\oddsidemargin}{-69pt} \begin{document}$$\chi$$\end{document} ^2^ test, with the Mann-Whitney U test for the size of nodules. Univariate and multivariate analyses were used to test the value of microflow patterns. Collinearity existed if the Spearman correlation coefficient was 0.70 or larger, and the features would be carefully screened for multivariate logistic regression analysis. Cohen’s Kappa was used for intraobserver agreement of microflow patterns, and Fleiss’ Kappa was used for interobserver agreement, with values 0.01–0.20 slight agreement, 0.21–0.40 fair agreement, 0.41–0.60 moderate agreement, 0.61–0.80 substantial agreement and 0.81–0.99 almost perfect agreement [14]. Taking the pathological results for the gold standard, receiver operator characteristic (ROC) curves of greyscale ultrasound and greyscale ultrasound combined with SMI according to different RSSs in diagnosing thyroid nodules were drawn for the best cutoff value, and the diagnostic sensitivity, specificity, positive predictive value (PPV), negative predictive value (NPV) and accuracy were also calculated. The area under the ROC curve (AUC) of each RSS was compared with that of the RSS combined with SMI. The number of nodules recommended for biopsy according to five RSSs and the RSSs combined with SMI in the benign and malignant groups was counted. The proportion of the benign nodules recommended for biopsy in all the recommended nodules was the unnecessary biopsy rate [15]. All statistical tests were bilateral, and a p-value < 0.05 was considered statistically significant. The analyses were conducted by using SPSS software version 26.0 (SPSS Software Inc.), MedCalc software version 20.0 (MedCalc Software Ltd.) and GraphPad Prism Software version 8.0 (GraphPad Inc.).
Results
Demographic and pathology data
In this study, 203 patients with 253 thyroid nodules were included. The median age of patients was 45 years (IQR: 35–58 years), and the male-to-female ratio was 1:3.61. 165 patients underwent thyroid surgery, and 38 patients had FNAB only. Among the nodules with surgical pathology, 131 were papillary thyroid carcinoma, 63 were nodular goiter, 15 were thyroid adenoma, 6 were focal lymphocytic thyroiditis. Among the nodules with FNAB pathology only, 5 were of Bethesda VI and 33 were of Bethesda II. All the nodules of Bethesda V were malignant with surgical confirmation. In all, 136 nodules were included in the malignant group and 117 in the benign group.
Ultrasound characteristics
The ultrasound features of thyroid nodules in the malignant and benign groups are compared in Table 1. All the features of nodules in the malignant and benign groups differed significantly (p < 0.05). Based on clinical experience, we included solid or almost completely solid composition, hypo- or marked hypoechogenicity, taller-than-wide shape, lobulated or irregular margin or extra-thyroidal extension, punctate echogenic foci, and the crab claw-like or the root hair-like pattern into the univariate and multivariate analysis (Fig. 2). Results showed that the crab claw-like or the root hair-like pattern was one independent risk factor for malignant thyroid nodules (odds ratio 62.713, 95% CI 16.330–240.837).Fig. 2. Forest plot of odds ratios of the ultrasound features in the univariate and multivariate analysisTable 1Greyscale and SMI features of thyroid nodules in the malignant and benign groupsFeatureMalignant group (n = 136)Benign group (n = 117)p-valueSize (cm, IQR)0.9 (0.7–1.2)1.7 (0.9–3.05)< 0.001Location0.027 Left lobe5559 Right lobe6956 Isthmus122Composition< 0.001 Solid or almost completely solid13495 Mixed cystic and solid222Echogenicity< 0.001 Hypoechoic12367 Marked hypoechoic102 Isoechoic344 Hyperechoic04Shape< 0.001 Taller-than-wide5116 Wider-than-tall85101Margin< 0.001 Lobulated or irregular659 Extra-thyroidal extension20 Ill-defined349 Smooth3599Echogenic foci< 0.001 Punctate echogenic foci7220 Peripheral calcifications25 Macrocalcifications911 Punctate echogenic foci + macrocalcifications30 None5081Microflow pattern< 0.001 Crab claw-like pattern703< 0.001 Root hair-like pattern250< 0.001 Wheel-like pattern460< 0.001 Arborescent pattern7220.001 Gray zone3032SMI superb microvascular imaging, IQR interquartile range
Table 2 shows substantial or almost perfect intra- and interobserver agreements for microflow patterns based on SMI of thyroid nodules.Table 2. The intra- and interobserver agreements among the microflow pattern of thyroid nodulesMicroflow patternIntraobserver agreement (Cohen’s Kappa)Interobserver agreement (Fleiss’ Kappa)Reviewer 1Reviewer 2Reviewer 3Crab claw-like pattern0.8090.8960.7810.735Root hair-like pattern0.9300.9200.6940.724Wheel-like pattern0.9470.9780.8080.893Arborescent pattern0.8390.9790.7430.768Phenotype0.8610.9270.7740.782
The diagnostic performance of greyscale ultrasound before and after the combination with SMI
The classification adjustments of thyroid nodules made by microflow patterns combined with greyscale ultrasound according to each RSS are summarized in Table 3. The diagnostic performances of greyscale ultrasound and greyscale ultrasound combined with microflow patterns on SMI according to different RSSs are shown in Table 4 and Fig. 3. After the combination with SMI, the diagnostic specificity of ACR TI-RADS (0.803 vs 0.855, p = 0.041), ATA RSS (0.778 vs 0.863, p = 0.004), KSThR TIRADS (0.795 vs 0.863, p = 0.013), EU-TIRADS (0.709 vs 0.846, p < 0.001) and C-TIRADS (0.735 vs 0.829, p = 0.006) in differentiating benign and malignant thyroid nodules improved significantly with the sensitivity of ACR TI-RADS (0.728 vs 0.860, p = 0.001) and KSThR TIRADS (0.801 vs 0.875, p = 0.034) increased significantly. The AUCs of greyscale ultrasound combined with SMI according to all five RSSs were higher than those of the greyscale ultrasound alone (p < 0.05).Fig. 3. The ROC curves comparison of greyscale ultrasound and greyscale ultrasound combined with microflow patterns on SMI according to different RSSs. a ACR TI-RADS, b ATA RSS, c KSThR TIRADS, d EU-TIRADS, e C-TIRADSTable 3Grade adjustment of thyroid nodules by microflow patterns on SMIRSSAdjustmentNumber of adjusted nodulesOriginal gradeAdjusted gradeMalignant nodulesBenign nodulesACR TI-RADSUpgrade23TR3TR402TR4TR5210Downgrade55TR4TR3640TR5TR436ATA RSSUpgrade16Low suspicionIntermediate suspicion02Intermediate suspicionHigh suspicion140Downgrade52Intermediate suspicionLow suspicion433High suspicionIntermediate suspicion510KSThR TI-RADSUpgrade16TR3TR402TR4TR5140Downgrade51TR4TR3534TR5TR448EU-TIRADSUpgrade15TR3TR402TR4TR5130Downgrade56TR4TR3331TR5TR4616C-TIRADSUpgrade54TR4ATR4B101TR4BTR4C182TR4CTR5230Downgrade76TR4ATR3653TR4BTR4A312TR4CTR4B11SMI superb microvascular imaging, RSS risk stratification system, ACR TI-RADS American College of Radiology Thyroid Imaging Reporting and Data System, ATA American Thyroid Association, KSThR TIRADS Korean Society of Thyroid Radiology Thyroid Imaging Reporting and Data System, EU-TIRADS European Thyroid Imaging Reporting and Data System, C-TIRADS Chinese Thyroid Imaging Reporting and Data SystemTable 4Diagnostic performances of greyscale ultrasound according to different RSSs and RSSs combined with SMIDiagnostic methodCutoff valueSensitivityp-valueSpecificityp-valuePPVNPVAccuracyAUC (95% CI)p-valueACR TI-RADSTR50.7280.0010.8030.0410.8110.7180.7630.811 (0.758–0.858)< 0.001ACR TI-RADS + SMITR50.8600.8550.8730.8400.8580.883 (0.837–0.920)ATA RSSHigh Suspicion0.8010.0660.7780.0040.8070.7710.7910.825 (0.772–0.869)< 0.001ATA RSS + SMIHigh Suspicion0.8680.8630.8810.8490.8660.891 (0.846–0.927)KSThR TIRADSTR50.8010.0340.7950.0130.8200.7750.7980.834 (0.782–0.878)< 0.001KSThR TIRADS + SMITR50.8750.8630.8810.8560.8700.890 (0.845–0.926)EU-TIRADSTR50.8240.1690.709< 0.0010.7670.7760.7710.794 (0.739–0.842)< 0.001EU-TIRADS + SMITR50.8750.8460.8690.8530.8620.883 (0.837–0.920)C-TIRADSTR4B0.8530.0960.7350.0060.7890.8110.7980.834 (0.782–0.878)< 0.001C-TIRADS + SMITR4B0.9040.8290.8600.8820.8700.900 (0.857–0.934)RSS risk stratification system, SMI superb microvascular imaging, PPV positive predictive value, NPV negative predictive value, AUC area under the receiver operator characteristic curve, CI confidence interval, ACR TI-RADS American College of Radiology Thyroid Imaging Reporting and Data System, ATA American Thyroid Association, KSThR TIRADS Korean Society of Thyroid Radiology Thyroid Imaging Reporting and Data System, EU-TIRADS European Thyroid Imaging Reporting and Data System, C-TIRADS Chinese Thyroid Imaging Reporting and Data System
The biopsy recommendation of greyscale ultrasound before and after the combination with SMI
Biopsy recommendations of greyscale ultrasound and greyscale ultrasound combined with microflow patterns on SMI according to different RSSs are summarized in Table 5. Compared with using RSSs alone, the microflow patterns combined with the ACR TI-RADS, ATA RSS, KSThR TIRADS, EU-TIRADS and C-TIRADS reduced the unnecessary biopsy rate by 5.48%, 2.61%, 6.75%, 1.27% and 20.30% respectively. The diagnostic and biopsy recommending performances of greyscale ultrasound before and after combining with microflow patterns on SMI according to different RSSs are summarized in Fig. 4 and illustrated by examples in Figs. 5, 6 and Supplementary Appendix Figs. 1, 2.Fig. 4. Radar graphs of the diagnostic and biopsy recommending performances of greyscale ultrasound and greyscale ultrasound combined with microflow patterns on SMI according to different RSSs. a ACR TI-RADS, b ATA RSS, c KSThR TIRADS, d EU-TIRADS, e C-TIRADSFig. 5Ultrasound images of a solid hypoechoic nodule of 1.1 cm in the thyroid isthmus of a 41-year-old female patient. After adjustment by the crab claw-like microflow pattern on SMI, one-level upgrade was made for ACR TI-RADS, ATA RSS, KSThR TIRADS, EU-TIRADS and C-TIRADS, and the biopsy recommendations of ACR TI-RADS and EU-TIRADS were added. Postoperative pathology confirmed it was a papillary thyroid carcinoma. a Greyscale ultrasound, b CSMI, c MSMI, d Smart-3DFig. 6Ultrasound images of a solid isoechoic nodule of 2.0 cm with punctate echogenic foci in the right thyroid lobe of a 60-year-old female patient. After adjustment by the wheel-like microflow pattern on SMI, one-level downgrade was made for ACR TI-RADS, ATA RSS, KSThR TIRADS, EU-TIRADS and C-TIRADS, and the biopsy recommendations of ACR TI-RADS and KSThR TIRADS were exempted. Cytopathological result showed a benign nodule of Bethesda II. a Greyscale ultrasound, b CSMI, c MSMI, d Smart-3DTable 5Biopsy recommendation of different RSSs and RSSs combined with SMIRecommendation methodRecommended nodules in the malignant groupRecommended nodules in the benign groupUnnecessary biopsy rateACR TI-RADS716045.80%ACR TI-RADS + SMI745040.32%ATA RSS638055.94%ATA RSS + SMI637253.33%KSThR TIRADS717551.37%KSThR TIRADS + SMI725844.62%EU-TIRADS516656.41%EU-TIRADS + SMI485955.14%C-TIRADS1016238.04%C-TIRADS + SMI1022217.74%RSS risk stratification system, SMI superb microvascular imaging, ACR TI-RADS American College of Radiology Thyroid Imaging Reporting and Data System, ATA American Thyroid Association, KSThR TIRADS Korean Society of Thyroid Radiology Thyroid Imaging Reporting and Data System, EU-TIRADS European Thyroid Imaging Reporting and Data System, C-TIRADS Chinese Thyroid Imaging Reporting and Data System
Discussion
The study explored the value of microflow patterns on SMI combined with greyscale ultrasound in thyroid nodule diagnosis and biopsy recommendations according to five ultrasound RSSs for thyroid nodules. After classification adjustment by SMI, the diagnostic performance of ACR TI-RADS, ATA RSS, KSThR TIRADS, EU-TIRADS, and C-TIRADS improved in differentiation between benign and malignant thyroid nodules compared to the use of RSSs only. The unnecessary biopsy rate recommended by each RSS also decreased after the combination with microflow patterns.
Our results showed that microflow patterns assisted in the differentiation between benign and malignant thyroid nodules. Recent years have witnessed a heated debate on the role of vascularity in diagnosing thyroid nodules by ultrasound. Some scholars found vascularity exerted a positive influence [16, 17], others believed no added value was applied to the conventional ultrasound [18–20]. Owing to this, vascular indices have not been included in any RSSs of ultrasound for the assessment of thyroid nodules. The advent of SMI brought the argument to a climax. Compared to the CDFI and PDFI, SMI is more sensitive to the tiny vessels and microflows with low velocity, thus better depicts the vascularity of thyroid nodules. Previous research mainly focused on the vascular richness, morphology and distribution on SMI, and the conclusions varied [6, 21–24]. We attributed this controversy to the interobserver agreement and different definitions, and brought out the microflow patterns to distinguish the benign and malignant thyroid nodules with substantial intra- and interobserver agreement [7]. Our results showed that the crab claw-like or the root hair-like pattern had similar diagnostic value as the widely-acknowledged malignant ultrasound features like taller-than-wide shape and lobulated or irregular margin, which served as the foundation for the SMI combined with greyscale ultrasound in the differentiation between benign and malignant thyroid nodules.
In our study, the addition of SMI enhanced the diagnostic validity of greyscale ultrasound. One meta-analysis included 39 studies demonstrated that the most accurate risk category thresholds for malignant thyroid nodules were TR5 for ACR TI-RADS, KSThR TIRADS, EU-TIRADS and high suspicion for ATA RSS [25], which were similar to our results. After adjustment by SMI, the AUCs increased significantly regardless of RSSs, showing a promising added value of SMI to the greyscale ultrasound. In comparison between the RSSs, ACR TI-RADS had a higher specificity but was less sensitive than ATA RSS and KSThR TIRADS [15, 26, 27]. Our results showed a significant improvement was made in the diagnostic sensitivity for ACR TI-RADS and the diagnostic specificity for all five RSSs by SMI, which offset the weaknesses. There were studies combining SMI with greyscale ultrasound in thyroid nodules, but the conclusions differed. No statistical difference was found after the use of SMI to greyscale ultrasound in the study of Ahn et al [28] and Yoon et al [29]. However, Zhao et al [30] and Zhu et al [31] believed the diagnostic performance improved by SMI combined with greyscale ultrasound. Chen et al [32] thought the added value of SMI existed in ACR TI-RADS 4 nodules. As far as we are concerned, the diagnostic criteria of SMI for malignant thyroid nodules and the methods that SMI combined with greyscale ultrasound counted a lot. The benign and malignant SMI features varied among these studies, some of which even went the opposite [28, 29]. In our study, we used microflow patterns for the first time to divide the SMI features into three categories: the crab claw-like or the root hair-like pattern, the wheel-like or the arborescent pattern, and the gray zone for the convenience of clinical application. And we kept the original classification rules of RSSs for the same reason. Meta-analysis research of SMI combined with greyscale ultrasound showed that the summary sensitivity, specificity and AUC in diagnosing thyroid nodules were 0.80–0.88, 0.79–0.89 and 0.89–0.94 [33, 34]. However, no subgroup analysis was performed according to the diagnostic criteria of SMI. More studies are needed for the standardization of SMI diagnostic criteria to examine the added value of SMI.
We found that SMI combined with greyscale ultrasound helped in reducing unnecessary biopsy rate. With the growing concerns regarding the overdiagnosis and overtreatment of thyroid nodules, active surveillance has been gradually recognized as the primary management strategy for low-risk nodules [35, 36]. Under such a background, refining biopsy decision-making has emerged as another critical research focus alongside improving diagnostic performance, while the unnecessary biopsy rate is receiving increasing attention. Ha et al [37] found the unnecessary biopsy rate of ACR TI-RADS was 25.3%, much lower than the ATA RSS (51.7%) and KSThR TIRADS (56.9%). As for C-TIRADS, we found the unnecessary biopsy rate was the lowest, followed by ACR TI-RADS, which was similar to the results of Jin et al [38]. And the unnecessary biopsy rate of C-TIRADS could be further reduced by more than half after combining with SMI in our study, with varying degrees of decrease of other RSSs. The decision of biopsy was based on the size as well as the classification of the nodules. In this study, we maintained the size criteria but regulated the biopsy recommendation according to the adjusted classification by microflow patterns on SMI. A few studies have made similar attempts with SMI to improve the biopsy recommendation. Ahn et al [28] found that the combined method of KSThR TIRADS, SMI and strain elastography had better performance in the management decision of biopsy. But the added value of SMI alone was unclear in this study. Ren et al [39] constructed a radiomics model of greyscale ultrasound combined with SMI for thyroid nodules and discovered a significant decrease in unnecessary biopsy rate of ACR TI-RADS. Our study discovered a general decline in the unnecessary biopsy rates among different RSSs. Besides, the results showed no reduction in the number of malignant nodules recommended for biopsy by microflow patterns combined with RSSs, except for EU-TIRADS. Considering the indications for biopsy of thyroid nodules are required to detect the highest possible percentage of thyroid malignancy while minimizing unnecessary biopsies [37], we thought the microflow patterns combined with greyscale ultrasound could mitigate the risk of overtreatment to a certain extent.
Our study had several limitations. First of all, selection bias existed. The study was conducted in a tertiary hospital, and we only included patients with FNAB or surgery, so a large portion of benign nodules could not be observed, which led to a relatively high prevalence of malignant nodules in our study. This also induced the differences in nodule size between the benign and malignant groups since the biopsy size criteria increased with the decrease of the grade. And we did not include thyroid nodules of Bethesda categories I, III, and IV without repeated FNAB for no definite pathology results. So the diagnostic value of SMI for these nodules remains unknown. Second, the diagnosis of some benign nodules was based on cytopathology, which might lead to the false-negative result. Third, subgroup analysis according to nodule size was not made, but unnecessary biopsy rates of RSSs were influenced by nodule size cutoff [15]. Finally, the outcome of this study was based on a single center with single examination operator and fixed ultrasound settings to keep the consistency. But this also influenced the universality of our results. Therefore, external validation of a larger sample size is necessary.
In conclusion, this study preliminarily demonstrated that microflow patterns on SMI could improve the diagnostic performance of greyscale ultrasound in the differentiation between benign and malignant thyroid nodules. What’s more, the added application of microflow patterns could reduce the unnecessary biopsy rates of ultrasound RSSs.
Supplementary information
ELECTRONIC SUPPLEMENTARY MATERIAL
The reference list from the paper itself. Each links out to its DOI / PubMed record.
- 1Ferlay J, Ervik M, Lam F et al (2024) Global cancer observatory: cancer today. International Agency for Research on Cancer, Lyon. Available via https://gco.iarc.who.int/today