Epidemiological characteristics and risk factors for severity of product-related injuries in children during COVID-19: a non-pharmaceutical intervention study
Jie Chen, Yanqi Lan, Zhuoping Zhang, Qionghua Zhang, Youlan Chen, Zhinan Guo, Jinhua Zhang

TL;DR
This study shows how pandemic lockdowns changed where and how children get injured, with more severe injuries at home from toys and appliances.
Contribution
The study reveals how non-pharmaceutical interventions during the pandemic altered injury patterns and severity in children.
Findings
During NPIs, 56.38% of injuries occurred at home, with more foreign body and burn injuries.
Injuries from toys and household appliances were significantly more severe during the NPI period.
Post-NPI, injuries at schools and public places were less severe compared to pre-pandemic.
Abstract
This study utilized the “natural experiment” created by the COVID-19 pandemic to assess the impact of non-pharmaceutical interventions (NPIs) on the epidemiological characteristics and determinants of the severity of product-related injuries among children. We analyzed data on product-related injuries in children aged 1 to 17 years from the Xiamen Injury Surveillance System between 2016 and 2024. The study period was categorized into three phases: pre-pandemic, during NPIs, and post-NPIs. Multivariable logistic regression models were constructed, adjusting for demographic and injury-related confounders. Interaction terms (period × injury location, period × product category) were included to analyze the independent effect of the NPIs period on the risk of severe injury (requiring hospital admission) and its effect modification. A total of 39,245 cases were included. During the NPIs…
Genes, proteins, chemicals, diseases, species, mutations and cell lines named across the full text — each resolved to its canonical identifier and authoritative record.
Click any figure to enlarge with its caption.
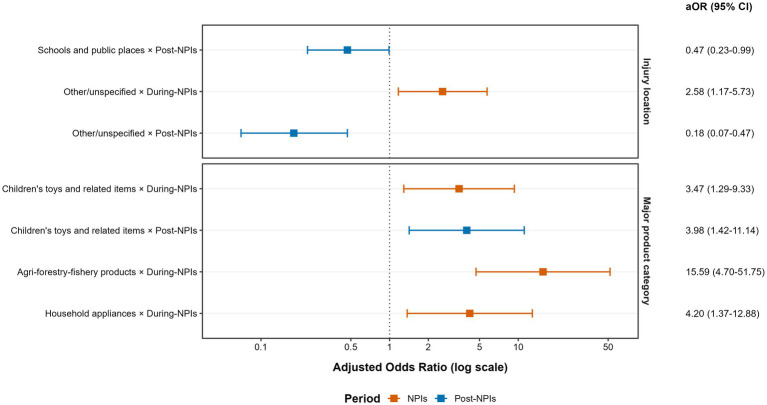 Figure 1
| Variable | Pre-NPIs ( | During-NPIs ( | Post-NPIs ( | Total ( |
|
|
|---|---|---|---|---|---|---|
| Sex | ||||||
| Male | 13,398 (64.00) | 5,639 (63.96) | 6,120 (64.45) | 25,157 (64.10) | 0.68 | 0.711 |
| Female | 7,535 (36.00) | 3,178 (36.04) | 3,375 (35.55) | 14,088 (35.90) | ||
| Age | ||||||
| 1–3 years | 8,479 (40.51) | 3,183 (36.10) | 2,267 (23.88) | 13,929 (35.49) |
| <0.001 |
| 4–6 years | 5,371 (25.66) | 2,283 (25.89) | 2,174 (22.90) | 9,828 (25.04) | ||
| 7–12 years | 4,857 (23.20) | 2,276 (25.81) | 3,240 (34.12) | 10,373 (26.43) | ||
| 13–17 years | 2,226 (10.63) | 1,075 (12.19) | 1,814 (19.10) | 5,115 (13.03) | ||
| Injury causes | ||||||
| Motor vehicle crash | 1,280 (6.11) | 368 (4.17) | 562 (5.92) | 2,210 (5.63) |
| <0.001 |
| Non-motor vehicle crash | 977 (4.67) | 389 (4.41) | 731 (7.70) | 2,097 (5.34) | ||
| Fall | 7,496 (35.81) | 3,021 (34.26) | 3,030 (31.91) | 13,547 (34.52) | ||
| Blunt injury | 7,732 (36.94) | 2,985 (33.86) | 3,253 (34.26) | 13,970 (35.60) | ||
| Cut/Sharp object injury | 1,945 (9.29) | 1,025 (11.63) | 1,236 (13.02) | 4,206 (10.72) | ||
| Firearm injury | 18 (0.09) | 9 (0.10) | 6 (0.06) | 33 (0.08) | ||
| Burn/scald | 314 (1.50) | 175 (1.98) | 123 (1.30) | 612 (1.56) | ||
| Foreign body injury | 821 (3.92) | 690 (7.83) | 310 (3.26) | 1,821 (4.64) | ||
| Poisoning | 171 (0.82) | 74 (0.84) | 37 (0.39) | 282 (0.72) | ||
| Other | 97 (1.34) | 45 (1.37) | 122 (1.67) | 264 (1.43) | ||
| Unspecified | 82 (0.39) | 36 (0.41) | 85 (0.90) | 203 (0.52) | ||
| Injury locations | ||||||
| Home | 11,396 (54.44) | 4,971 (56.38) | 4,159 (43.80) | 20,526 (52.30) |
| <0.001 |
| Road/Street | 3,063 (14.63) | 999 (11.33) | 1,538 (16.20) | 5,600 (14.27) | ||
| Public residence | 2,935 (14.02) | 1,429 (16.21) | 1,035 (10.90) | 5,399 (13.76) | ||
| School and public places | 1,989 (9.50) | 707 (8.02) | 1,716 (18.07) | 4,412 (11.24) | ||
| Sports and athletic facility | 977 (4.67) | 396 (4.49) | 554 (5.83) | 1,927 (4.91) | ||
| Commercial and service premises | 222 (1.06) | 70 (0.79) | 161 (1.70) | 453 (1.15) | ||
| Industrial and construction sites | 159 (0.76) | 44 (0.50) | 28 (0.29) | 231 (0.59) | ||
| Other | 3 (0.01) | 7 (0.08) | 15 (0.16) | 25 (0.06) | ||
| Unspecified | 189 (0.90) | 194 (2.20) | 289 (3.04) | 672 (1.71) | ||
| Injury outcomes | ||||||
| Treated and discharged | 20,441 (97.65) | 8,601 (97.55) | 9,278 (97.71) | 38,320 (97.64) |
| <0.001 |
| Observation | 244 (1.17) | 40 (0.45) | 70 (0.74) | 354 (0.90) | ||
| Hospitalization | 208 (0.99) | 150 (1.70) | 124 (1.31) | 482 (1.23) | ||
| Transfer or death | 40 (0.19) | 26 (0.29) | 23 (0.24) | 89 (0.23) | ||
| Product categories | ||||||
| Furniture | 8,094 (38.67) | 3,007 (34.10) | 3,026 (31.87) | 14,127 (36.00) |
| <0.001 |
| Stationery, educational and sports supplies | 2,760 (13.18) | 1,249 (14.17) | 1,834 (19.32) | 5,843 (14.89) | ||
| Transport equipment (excl. automobiles) | 2,385 (11.39) | 890 (10.09) | 1,351 (14.23) | 4,626 (11.79) | ||
| Children’s toys and related items | 1,616 (7.72) | 1,038 (11.77) | 663 (6.98) | 3,317 (8.45) | ||
| Hardware and building materials | 1,275 (6.09) | 674 (7.64) | 751 (7.91) | 2,700 (6.88) | ||
| Household daily necessities | 1,317 (6.29) | 714 (8.10) | 636 (6.70) | 2,667 (6.80) | ||
| Automobiles | 1,018 (4.86) | 328 (3.72) | 414 (4.36) | 1,760 (4.48) | ||
| Agro-forestry-fishery products | 962 (4.60) | 247 (2.80) | 216 (2.27) | 1,425 (3.63) | ||
| Food, drugs and related products | 436 (2.08) | 197 (2.23) | 165 (1.74) | 798 (2.03) | ||
| General/special equipment | 330 (1.58) | 116 (1.32) | 117 (1.23) | 563 (1.43) | ||
| Textiles, garments and accessories | 229 (1.09) | 152 (1.72) | 149 (1.57) | 530 (1.35) | ||
| Household appliances | 197 (0.94) | 98 (1.11) | 74 (0.78) | 369 (0.94) | ||
| Other products | 314 (1.50) | 107 (1.21) | 99 (1.04) | 520 (1.33) | ||
| Variable | Classification | Univariate analysis | Multivariate analysis | ||||
|---|---|---|---|---|---|---|---|
| cOR | 95% CI |
| aOR | 95% CI |
| ||
| Sex | Male | 1.00 | 1.00 | ||||
| Female | 0.98 | 0.86–1.12 | 0.779 |
| 0.71–0.96 | 0.011 | |
| Age groups | 1–3 years old | 1.00 | 1.00 | ||||
| 4–6 years old | 0.86 | 0.72–1.01 | 0.065 | 1.03 | 0.86–1.24 | 0.743 | |
| 7–12 years old | 0.62 | 0.52–0.75 | <0.001 |
| 0.58–0.88 | 0.002 | |
| 13–17 years old | 1.02 | 0.84–1.24 | 0.872 | 0.89 | 0.71–1.12 | 0.320 | |
| Cause of injury | Motor vehicle accident | 1.00 | 1.00 | ||||
| Fall | 0.30 | 0.24–0.37 | <0.001 |
| 0.37–0.87 | 0.010 | |
| Cut/sharp object injury | 0.09 | 0.06–0.14 | <0.001 |
| 0.07–0.26 | <0.001 | |
| Non-motor vehicle crash | 0.41 | 0.29–0.56 | <0.001 |
| 0.32–0.66 | <0.001 | |
| Blunt injury | 0.09 | 0.07–0.12 | <0.001 |
| 0.11–0.29 | <0.001 | |
| Burn/scald | 0.22 | 0.11–0.44 | <0.001 |
| 0.09–0.50 | <0.001 | |
| Poisoning | 21.96 | 16.33–29.52 | <0.001 |
| 18.99–62.97 | <0.001 | |
| Foreign body injury | 1.91 | 1.51–2.41 | <0.001 |
| 2.80–7.75 | <0.001 | |
| Other/unspecified | 1.49 | 1.04–2.14 | 0.031 |
| 1.32–3.89 | 0.003 | |
| Location of the injury | Home | 1.00 | 1.00 | ||||
| Road/street | 1.59 | 1.347–1.88 | <0.001 | 1.07 | 0.69–1.68 | 0.757 | |
| Public residence | 0.43 | 0.32–0.56 | <0.001 | 0.74 | 0.54–1.02 | 0.062 | |
| Schools and public places | 0.49 | 0.37–0.66 | <0.001 | 0.97 | 0.70–1.35 | 0.868 | |
| Sports and athletic facility | 0.99 | 0.73–1.35 | 0.950 |
| 1.28–2.90 | 0.002 | |
| Commercial and service premises | 1.62 | 0.99–2.64 | 0.057 |
| 1.30–3.84 | 0.004 | |
| Other/unspecified | 3.12 | 2.39–4.08 | <0.001 | 1.13 | 0.81–1.56 | 0.482 | |
| Period | Pre-NPIs | 1.00 | 1.00 | ||||
| During-NPIs | 1.04 | 0.89–1.23 | 0.607 | 0.96 | 0.80–1.15 | 0.630 | |
| Post-NPIs | 0.97 | 0.83–1.14 | 0.728 | 1.13 | 0.95–1.35 | 0.180 | |
| Product category | Furniture | 1.00 | 1.00 | ||||
| Stationery, educational and sports supplies | 1.57 | 1.20–2.05 | 0.001 | 1.31 | 0.94–1.82 | 0.112 | |
| Transport equipment (excl. automobiles) | 3.05 | 2.41–3.87 | <0.001 |
| 1.46–3.13 | <0.001 | |
| Children’s toys and related items | 1.27 | 0.90–1.80 | 0.174 |
| 0.23–0.55 | <0.001 | |
| Hardware and building materials | 0.89 | 0.58–1.37 | 0.598 | 1.65 | 1.001–2.72 | 0.05 | |
| Household daily necessities | 5.29 | 4.16–6.72 | <0.001 |
| 1.44–2.84 | <0.001 | |
| Automobiles | 5.35 | 4.08–7.00 | <0.001 |
| 1.76–4.28 | <0.001 | |
| Agro-forestry-fishery products | 1.48 | 0.94–2.35 | 0.094 |
| 0.33–0.97 | 0.037 | |
| Food, drugs and related products | 14.86 | 11.41–19.37 | <0.001 | 1.31 | 0.82–2.09 | 0.260 | |
| General/special equipment | 3.84 | 2.41–6.13 | <0.001 |
| 2.39–6.62 | <0.001 | |
| Textiles, garments and accessories | 3.89 | 2.42–6.27 | <0.001 |
| 1.46–4.21 | 0.001 | |
| Household appliances | 9.74 | 6.57–14.45 | <0.001 |
| 3.92–10.19 | <0.001 | |
| Other products | 14.17 | 10.41–19.29 | <0.001 |
| 1.95–5.35 | <0.001 | |
| Analysis | Risk combination | OR (95% CI) |
| Corresponding aOR from model 2 (95% CI) |
|---|---|---|---|---|
| Sensitivity analysis 1 | During-NPIs × Children’s toys and related items | 3.04 (1.22–7.57) | 0.017 | 3.47 (1.29–9.33) |
| Post-NPIs × Children’s toys and related items | 3.32 (1.28–8.61) | 0.014 | 3.98 (1.42–11.14) | |
| Post-NPIs × School and public places | 0.47 (0.22–0.98) | 0.045 | 0.47 (0.23–0.99) | |
| Sensitivity analysis 2 | During-NPIs × Children’s toys and related items | 12.63 (2.90–55.06) | <0.001 | 3.47 (1.29–9.33) |
| Post-NPIs × Children’s toys and related items | 11.11 (2.39–51.54) | <0.001 | 3.98 (1.42–11.14) | |
| Post-NPIs × School and public places | 1.60 (0.64–3.98) | 0.310 | 0.47 (0.23–1.00) |
Peer Reviews
No public reviews on file for this paper yet. If you reviewed it on a platform where reviews are public (OpenReview, ICLR, NeurIPS, ICML), you can paste yours below so the community can read it here.
Videos
No videos yet. Explain this paper in a talk, walkthrough, or lecture? Add one.
Taxonomy
TopicsInjury Epidemiology and Prevention · Agriculture and Farm Safety · Burn Injury Management and Outcomes
Introduction
1
Childhood injury is one of the leading causes of death and disability among children globally, constituting a major public health concern (1). Product-related injuries represent a significant component of childhood injury and are closely associated with children’s developmental stages, behavioral characteristics, and environmental exposures (2). The widespread implementation of non-pharmaceutical interventions (NPIs) such as school closures, stay-at-home orders, and restrictions on gatherings during the COVID-19 pandemic altered children’s activity spaces and patterns of product contact in a short period, which created a unique natural experiment to investigate the impact of macro-level social policies on the risk of childhood injury. Multiple studies have reported an overall decline in trauma admissions during the NPIs period (3, 4), along with a noticeable shift in the injury spectrum: road traffic injuries and sports-related trauma decreased substantially (5), while unintentional home injuries and violence-related injuries—particularly firearm injuries—increased (6, 7). However, existing research has largely been confined to describing changes in injury rates or proportional distributions, with limited in-depth assessment of changes in injury severity. More importantly, few studies have employed multivariable models to control for demographic and other confounding factors to examine whether the NPIs period independently influenced the risk of injury associated with specific products or locations, and whether effect modification exists. Therefore, utilizing long-term systematic injury surveillance data from Xiamen City, China, this study aims to investigate: (1) the structural changes in the epidemiology of product-related injuries among children—including but not limited to shifts in product types, injury locations, and population distributions—before, during, and after the implementation of NPIs; and (2) whether the NPIs period independently increased the risk of severe injury and modified the associations between product type, injury characteristics, and severe outcomes, after adjusting for demographic and injury-related confounders.
Materials and methods
2
Study design and population
2.1
This study was a retrospective observational study using data from the Xiamen Injury Surveillance System. Xiamen is a national sentinel site for product injury surveillance in China; its local system covers seven sentinel hospitals, including both general and specialized institutions. We extracted all product-related injury cases involving children aged 1–17 years that occurred between January 1, 2016, and December 31, 2024.
Inclusion criteria were specifically limited to injuries where the causative factor was identified as a “product” according to the classification standards of the China National Product Injury Information Monitoring System. For the purposes of this study, a “product” is defined as any manufactured item produced to fulfill specific consumer needs. To ensure data independence, duplicate entries or follow-up visits for the same injury event were excluded.
The Institutional Review Board of the Xiamen Center for Disease Control and Prevention exempted this retrospective analysis of de-identified surveillance data from formal ethics approval and individual informed consent.
Variable definitions and classification
2.2
Exposure Variable (Period Definition): Based on the timeline of China’s COVID-19 prevention and control policies, the study period was divided into three phases: Pre-NPIs period (2016–2019); During-NPIs period (2020–2022, when NPIs were in effect); Post-NPIs period (2023–2024, after the lifting of restrictive measures).
Outcome Variable: Injury Severity. The primary outcome was a binary measure of injury severity. In alignment with national public health surveillance guidelines in China (8) and international indicators for serious injury (9), we defined a “severe injury” as any case that required inpatient-level healthcare resources. Specifically, this included cases with a final disposition of hospitalization, extended observation in the emergency department, transfer to a higher-level facility, or death. Cases that were treated and discharged directly were classified as “non-severe.”
Covariates: Based on Erikson’s psychosocial development theory and the epidemiological characteristics of childhood injuries, participants were categorized into four developmental stages: toddlerhood (1–3 years), preschool age (4–6 years), school age (7–12 years), and adolescence (13–17 years). Other Covariates included sex, cause of injury, location of injury, and major product category involved (coded according to the classification standards of the General Administration of Quality Supervision, Inspection and Quarantine) (10).
Quality control
2.3
All sentinel hospitals use the standardized National Injury Surveillance Report Card embedded in the medical information system for electronic reporting. To ensure data quality, multi-level quality control measures have been implemented, including annual physician training and assessment, real-time system logic verification, quarterly special checks for missed/incorrect reports, and a semi-annual on-site supervision and feedback mechanism.
Statistical analysis
2.4
Categorical variables are presented as frequencies (n) and percentages (%), group comparisons were conducted using Pearson’s chi-square (χ^2^) tests. Variable selection for the multivariable model was based on a combination of statistical and conceptual considerations. First, univariable logistic regression was performed for each candidate variable (sex, age group, injury cause, location, product category, and pandemic period). Although a p-value threshold of < 0.2 is sometimes used for preliminary screening, we adopted a full-model approach that included all pre-specified variables of primary interest. This ensured that the estimates for key variables (particularly sex and the NPIs period, which are central to our research questions) were adjusted for all other covariates, regardless of their univariable statistical significance. Subsequently, to evaluate independent associations while controlling for potential confounders, we constructed a multivariable logistic regression model including all the above variables (Multivariable Main Effects Model, hereafter referred to as Model 1). Multicollinearity among independent variables was assessed using Variance Inflation Factors (VIF) before conducting the multivariable logistic regression. A VIF value < 10 was generally considered acceptable, while higher values associated with high-prevalence dummy variables were further evaluated by examining the stability of their standard errors and confidence intervals. To test our primary hypothesis regarding effect modification, we then built upon Model 1 by incorporating three pre-specified interaction terms: (1) age group × period, (2) injury location × period, and (3) major product category × period. This formed the Multivariable Interaction Model (hereafter Model 2), which aimed to examine whether the NPIs period modified the associations of age, injury location, and product category with injury severity.
Model goodness-of-fit was assessed using the Likelihood Ratio Test (LRT) and the Hosmer–Lemeshow test. To mitigate bias in parameter estimation due to sparse data, injury causes and locations with extremely low sample sizes were logically merged prior to analysis (“firearm injury, other, unspecified” were combined into “other/unspecified”; “industrial/construction sites, other, unspecified” were combined into “other/unspecified”).
To evaluate the robustness of our findings regarding the impact of NPIs on injury severity, we conducted two sensitivity analyses: (1) Considering the unique injury patterns in infants, we expanded the age range to include children under 1 year old and refitted the interaction model to examine whether the observed risk patterns were consistent across the entire pediatric age spectrum. (2) To minimize potential clinical heterogeneity in the definition of “severe injury,” we adopted a stricter clinical outcome definition, limiting “severe injury” to only “hospitalization, transfer, or death” cases (n = 571), excluding cases requiring only extended observation. Given the limited number of events under this stricter definition, which could lead to overfitting in a multivariable logistic regression model with numerous covariates, this analysis primarily utilized univariate methods. We calculated crude injury proportions across groups and derived crude odds ratios (cORs) using cross-tabulation.
Statistical analyses were performed using SPSS version 25.0 (International Business Machines Corporation) and R version 4.5.1 (R Foundation for Statistical Computing). All statistical tests were two-sided, with a significance level (α) set at 0.05.
Results
3
Basic information
3.1
From 2016 to 2024, a total of 39,245 product-related injury cases among children aged 1 to 17 years were reported by the sentinel hospitals of the injury surveillance system in Xiamen City. Among these, there were 25,157 male cases (64.10%) and 14,088 female cases (35.90%), with a sex ratio of 1.97:1. The top five major product categories involved were: furniture (14,127 cases, 36.00%), stationery, educational and sports supplies (5,843 cases, 14.89%), transportation equipment other than automobiles (4,626 cases, 11.97%), children’s toys and related items (3,317 cases, 8.45%), and hardware and building materials (2,700 cases, 6.88%), collectively accounting for 78.00% (30,613 cases) of all product-related injury cases. Stratified by the pandemic period, there were 20,933 cases (53.34%) in the pre-NPIs (baseline) period, 8,817 cases (22.47%) during the NPIs period, and 9,495 cases (24.19%) in the post-NPIs period.
Distribution of injury characteristics across periods
3.2
Across the three periods, the distributions of all characteristics differed significantly (all p < 0.001) except for sex, As periods progressed, the proportion of young children (1–3 years) decreased, whereas older children (7–17 years) accounted for a growing share of injuries. During the NPIs period, injuries were increasingly concentrated at home (peak at 56.38%) and involved children’s toys and household daily necessities more frequently, while injuries related to transportation and occurring at schools/public places reached their lowest proportions. The injury cause spectrum shifted accordingly, with burns/scalds and foreign body injuries becoming more prominent, and transport-related causes declining (Table 1).
Analysis of factors influencing injury severity
3.3
The crude associations (cORs) from the univariable analysis are presented alongside the adjusted results in Table 2.
Main effects model (model 1)
3.3.1
The overall multivariate logistic regression model demonstrated significance (Omnibus test p < 0.001) and an adequate fit (Hosmer–Lemeshow test p = 0.718). Collinearity diagnostics revealed that most VIF values were < 5, except for ‘falls’ (VIF = 11.8) and ‘blunt injuries’ (VIF = 12.2). These elevated VIFs were deemed structural due to the high frequency of these injury causes (collectively >70%). Model stability was confirmed by the narrow 95% confidence intervals for these estimates (e.g., 0.37–0.87 for falls), indicating no substantial impact on the reliability of the results. Notably, the NPIs period itself was not significantly associated with injury severity in this main effects model. However, several other factors, namely sex, age, injury cause, injury location and product category, were identified as independent predictors (Table 2).
Regarding demographics, females and children aged 7–12 years (vs. 1–3 years) had a lower risk of severe injury.
Injury location was a significant predictor, independent of the NPIs period. Compared with injuries at home, those occurring at commercial/service premises and sports/athletic facilities were associated with approximately two-fold higher odds of risks.
The risk profile varied markedly across product categories, even after adjusting for the pandemic period. Injuries involving household appliances posed the highest risk. Other categories associated with increased severity included general/special equipment, automobiles, and textiles/garments/accessories. In contrast, children’s toys and agro-forestry-fishery products were associated with a reduced risk.
In line with the adjusted odds ratios presented in Table 2, falls and blunt trauma were associated with a lower risk of severe injury compared to motor vehicle accidents. Complete adjusted odds ratios for all variables, including other injury causes, are presented in Table 2.
Effect modification analysis (model 2)
3.3.2
The Likelihood Ratio Test indicated that Model 2 provided a significantly better fit than Model 1 (χ^2^ = 130.74, df = 42, p < 0.001). Specifically, the interactions between period and injury location and between period and product category were statistically significant (both P for interaction < 0.001), indicating that the NPIs period modified the associations of these factors with injury severity. In contrast, the interaction between age group and period was not significant (p = 0.074), suggesting that the effect of age on injury severity did not vary meaningfully across the three periods. Model estimates showed that compared to the reference group (home × pre-NPIs), injuries occurring at schools and public places during the post-NPIs period were associated with a significant 53% reduction in the risk of severity (aOR = 0.47, 95% CI: 0.23–0.99). Conversely, during the NPIs period, injuries occurring at “other/unspecified” locations carried a 2.58 times higher risk of hospitalization compared to the pre-NPIs period (95% CI: 1.17–5.73). Furthermore, compared to the reference group (furniture × pre-NPIs), the risk of severe injury was significantly elevated during the NPIs period for injuries involving agro-forestry-fishery products (aOR = 15.59, 95% CI: 4.70–51.75), household appliances (aOR = 4.20, 95% CI: 1.37–12.88), and children’s toys and related items (aOR = 3.47, 95% CI: 1.29–9.33). In the post-NPIs period, the elevated risk associated with children’s toys and related items remained (aOR = 3.98, 95% CI: 1.42–11.14) (Figure 1). The complete set of estimated aORs for all interaction term combinations derived from Model 2 is provided in Supplementary Table 1.
Effect modification by the NPIs period on the association of injury location and product category with the risk of severe injury in children. The figure presents adjusted odds ratios (aORs) and 95% confidence intervals (error bars) for key interaction terms (“injury location × period” and “major product category × period”) from the multivariable logistic regression interaction model (Model 2). All aORs were adjusted for sex, age group, cause of injury, injury location (in product interaction analysis), major product category (in location interaction analysis), and pandemic period (as a main effect). The reference group is set as: injury location = “Home,” product category = “Furniture,” period = “Pre-NPIs.” NPIs, Non-Pharmaceutical Interventions; aOR, adjusted odds ratio; CI, confidence interval.
Sensitivity analysis
3.3.3
The results of the sensitivity analyses consistently supported the core findings of the main effects model.
In Sensitivity Analysis 1 (including infants under 1 year old), the interaction effects remained highly stable. For instance, the increased risk associated with “children’s toys and related items” during the NPIs period remained significant (aOR = 3.04, 95% CI: 1.22–7.57), and the protective association for injuries at “schools and public places” in the post-NPIs period persisted (aOR = 0.47, 95% CI: 0.22–0.98).
Sensitivity Analysis 2 (using the stricter outcome definition) demonstrated that the core risk trends revealed in the main analysis remained robust. Firstly, the “strict severe injury rate” was higher during both the NPIs period (2.00%) and the post-NPIs period (1.55%) compared to the pre-NPIs period (1.18%). Regarding key interaction terms, significantly elevated risks for strict severe injury associated with “children’s toys and related items” were observed during both the NPIs and post-NPIs periods compared to the pre-NPIs period, with cOR values of 12.63 (95% CI: 2.90–55.06) and 11.11 (95% CI: 2.39–51.54), respectively. This direction of effect was entirely consistent with the adjusted odds ratios (aOR) in the main analysis. For the “post-NPIs period × schools and public places” group, univariate analysis yielded a cOR of 1.60 (p = 0.31), which did not reach statistical significance (Table 3).
Discussion
4
This study utilized large-scale injury surveillance data to elucidate the dynamic impact of COVID-19 NPIs on product-related injuries among children. Our findings reveal that NPIs not only altered the epidemiological distribution of injuries but also reshaped the risk landscape of injury severity, with the NPIs period acting as a powerful effect modifier. This shifting injurious potential suggests that macro-level social policies can fundamentally redistribute health risks across different environments and products.
A key finding is that while the NPIs period showed no significant independent association with injury severity in the main effects model, its interactions with injury location and product category were highly significant. This suggests that NPIs did not exert a uniform “blanket effect” on severity; instead, the lack of a significant main effect likely reflects competing countervailing trends: a substantial reduction in high-risk outdoor injuries (e.g., motor vehicle crashes) due to restricted mobility was statistically offset by a concurrent intensification of injury severity within the home environment.
The restructuring of activity spaces led to a marked concentration of injuries at home (peaking at 56.38%), aligning with the global “lockdown effect” (11, 12). However, our interaction analysis further delineates that the severity risk for injuries involving children’s toys (aOR = 3.47) and household appliances (aOR = 4.20) surged during NPIs. This intensification likely stems from dual mechanisms: “increased exposure dose” due to prolonged confinement and “caregiver fatigue” during remote work, which created supervision gaps and may have delayed intervention for minor incidents (13–17). Unlike pre-pandemic patterns, the home environment under NPI conditions became a site where domestic hazards possessed a higher potential to escalate into severe outcomes.
Conversely, the interaction analysis reveals a significant “Safety Resilience” in public institutions. Despite a post-pandemic rebound in the proportion of school-related injuries (18.07%), which aligns with other research (18), the risk of these injuries resulting in severe outcomes decreased by 53% (aOR = 0.47) compared to the pre-pandemic period. This seemingly paradoxical phenomenon of “high frequency but low severity” suggests that schools and public venues successfully institutionalized strengthened safety protocols and emergency response density during the pandemic (19). In contrast, NPIs triggered a “spillover effect” into informal spaces; when conventional recreational venues were restricted, children shifted toward “other/unclear” locations (e.g., agricultural sites, woodlands) where the severity risk rose significantly (aOR = 2.58) due to a lack of safety regulation and environmental adaptation (20).
Beyond the reshaped risk within built environments, the interaction analysis also captured the severe consequences of population displacement into natural or productive landscapes. The 15-fold surge in severity risk for agro-forestry-fishery products (aOR = 15.59) during NPIs highlights the impact of large-scale decentralized migration. Multiple international studies have confirmed a significant “decentralized” migration trend during COVID-19 lockdowns, with a massive outflow of people from high-density urban centers to suburban or rural areas (21, 22). That outflow exposed children to unfamiliar farming tools and more hazardous natural environments (23, 24). This “environmental mismatch” underscores that population shifts under restrictive measures require targeted safety education to bridge the gap between children’s prior experience and their new, more hazardous surroundings.
The robustness of these conclusions is supported by our multi-dimensional sensitivity analyses. The consistency of findings under a stricter outcome definition (Sensitivity Analysis 2) serves as a rigorous internal validation, confirming that the observed effect modifications are not artifacts of injury classification but reflect substantive changes across different clinical thresholds. Furthermore, the non-significant interaction between age group and period suggests that while NPIs altered activity scope, they did not modify the inherent developmental susceptibility to injury across the pediatric age spectrum.
This study has clear implications for public health practice. Prevention strategies should transition from generalized “home safety” to “precision intervention,” emphasizing adherence to toy safety standards, proactive safeguarding of household appliances, and environmental adaptation for families relocating during emergencies. Moreover, the experience of reduced injury severity in public places post-pandemic warrants institutionalization into sustainable safety standards.
This study also has several limitations. First, data were sourced from a single regional surveillance system, warranting caution regarding generalizability. Second, although we controlled for multiple confounders using multivariable models, unmeasured variables such as quality of home care, parental psychological stress, and socioeconomic status could not be included, potentially leading to residual confounding. Furthermore, as an observational study based on administrative data, we could not directly measure specific behavioral mediators of NPIs (e.g., actual time children spent at home, duration of online learning, or outdoor activity frequency). Therefore, although the observed changes in injury patterns (e.g., increased home injuries, decreased outdoor transport injuries, increased risk from home-related products) are highly consistent with the theoretical mechanism of “activity space shift to home” and align with global trends, alternative explanations cannot be entirely ruled out. This limitation primarily affects the in-depth interpretation of causal pathways but has a relatively limited impact on the main finding of a strong association between the NPIs period and injury patterns. Lastly, defining the entire 2020–2022 period as the “NPIs implementation period,” while based on the overarching presence of various NPIs, did not capture temporal variations in NPI intensity. China’s prevention policies followed a “dynamic zeroing” principle, encompassing forms ranging from comprehensive strict lockdowns to precise zonal control (25). This heterogeneous exposure definition may have led to a degree of non-differential misclassification, which typically biases effect estimates toward the null (i.e., dilution bias), potentially underestimating the true modifying effect of NPIs. However, this definition aligns with our research objective of examining the macro-policy “overall shift”. Future research could integrate multi-regional data and incorporate individual-level behavioral measurements, while adopting the ‘Stringency Index’ from the Oxford COVID-19 Government Response Tracker (OxCGRT) to further elucidate the underlying dynamic causal pathways (26).
Conclusion
5
In summary, COVID-19 NPIs dynamically reshaped the risk determinants of product-related injuries in children. By modifying the injurious potential of specific settings and products, NPIs led to a sharp increase in home-related injury severity while potentially catalyzing long-term improvements in public environmental safety. These findings call for the integration of targeted, context-specific injury prevention strategies within future public health emergency responses.
The reference list from the paper itself. Each links out to its DOI / PubMed record.
- 1Wei W Lyu W Zhang Y. Global patterns and health impact of unintentional injuries among children and adolescents, 1990-2021. Front Public Health. (2025) 13:1626739. doi: 10.3389/fpubh.2025.1626739, 41069815 PMC 12504300 · doi ↗ · pubmed ↗
- 2Xiao W Cheng P Hua J Schwebel DC Hu G. Product-related injury morbidity among Americans aged 0–19 years, 2001–2020. J Saf Res. (2023) 85:192–9. doi: 10.1016/j.jsr.2023.02.00337330869 · doi ↗ · pubmed ↗
- 3Matthay ZA Kornblith AE Matthay EC Sedaghati M Peterson S Boeck M . The distance study: determining the impact of social distancing on trauma epidemiology during the COVID-19 epidemic—an interrupted time-series analysis. J Trauma Acute Care Surg. (2021) 90:700–7. doi: 10.1097/TA.0000000000003044, 33252457 PMC 7979514 · doi ↗ · pubmed ↗
- 4Alao DO Cevik AA Yasin YJ Jaiganesh T Abu-Zidan F. The COVID-19 pandemic reduced the trauma incidence and modified its pattern in Al-Ain City, United Arab Emirates. Eur J Trauma Emerg Surg. (2022) 48:3011–6. doi: 10.1007/s 00068-022-01897-z, 35178582 PMC 8853936 · doi ↗ · pubmed ↗
- 5Aydın O Hanalıoğlu D Ünal B Güngör E Kaynak MO Yiğit H . What has changed in injury-related presentations during COVID-19 pandemic? A single-center experience from a pediatric emergency department. Turk Arch Pediatr. (2022) 57:453–8. doi: 10.5152/Turk Arch Pediatr.2022.22032, 35822479 PMC 9321838 · doi ↗ · pubmed ↗
- 6Bernardin ME Clukies L Gu H Fairfax C Keller MS. COVID-19 pandemic effects on the epidemiology and mortality of pediatric firearm injuries; a single center study. J Pediatr Surg. (2023) 58:1500–5. doi: 10.1016/j.jpedsurg.2022.10.007, 36402591 PMC 9596183 · doi ↗ · pubmed ↗
- 7He J Ning P Schwebel DC Yang Y Li L Cheng P . Injury mortality and morbidity changes due to the COVID-19 pandemic in the United States. Front Public Health. (2022) 10:1001567. doi: 10.3389/fpubh.2022.1001567, 36408028 PMC 9666887 · doi ↗ · pubmed ↗
- 8Chinese Center for Disease Control and Prevention. National injury surveillance dataset (2014). Beijing: China CDC (2016).