Virtual monochromatic versus conventional polychromatic CT images in patients with acute bowel ischaemia
Kilian Rothenbuehler, Ahmad Sayadi, Renaud Troxler, Christine Sempoux, Alban Denys, David Rotzinger, Sabine Schmidt

TL;DR
Virtual monochromatic CT images are as effective as traditional CT for detecting acute bowel ischaemia, allowing for reduced radiation dose.
Contribution
Demonstrates that virtual monochromatic CT images can replace traditional non-enhanced scans for diagnosing acute bowel ischaemia.
Findings
Virtual monochromatic and conventional CT images showed similar diagnostic accuracy for detecting acute bowel ischaemia.
Significant differences in bowel wall density were observed between healthy and pathological segments using virtual monochromatic images.
Using virtual non-enhanced images can reduce radiation exposure without compromising diagnostic quality.
Abstract
To compare 40 keV virtual monochromatic images (VMIs) with conventionally acquired polychromatic multi-detector CT images (CONV) in patients with acute bowel ischaemia (ABI). We retrospectively included 48 consecutive patients (38 males, mean age 69 years) with pathologically proven ABI over 40 months. They underwent portovenous dual-energy multi-detector CT followed by surgery within < 48 h. Nineteen patients had VMIs, and 29 had CONV after non-enhanced acquisition. After dividing the small and large bowel into 10 segments, two radiologists blinded to the exact localisation of the ABI read the VMIs and CONV images separately. After this qualitative analysis, bowel wall density was assessed quantitatively on (virtual) non-enhanced and portovenous images. Qualitative analysis showed good overall sensitivity (75.9–82%) and specificity (85.9–88.7%) for localising ABI on VMIs and CONV…
Genes, proteins, chemicals, diseases, species, mutations and cell lines named across the full text — each resolved to its canonical identifier and authoritative record.
Click any figure to enlarge with its caption.
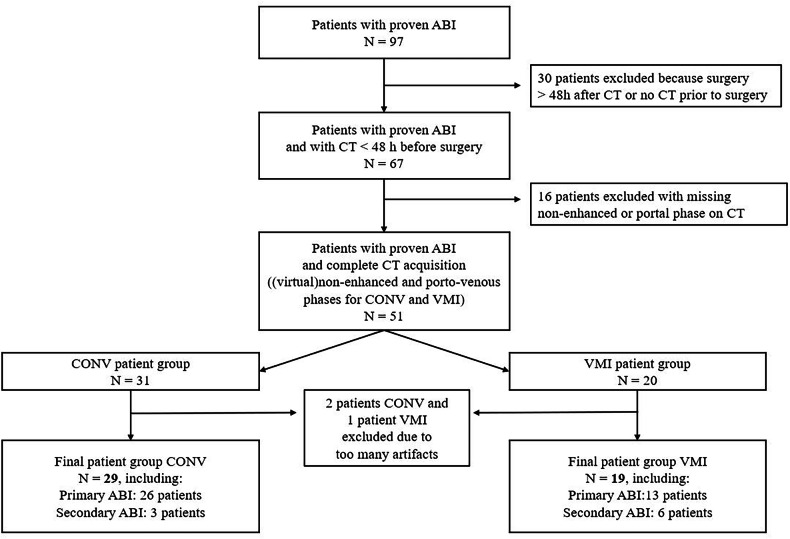 Figure 1
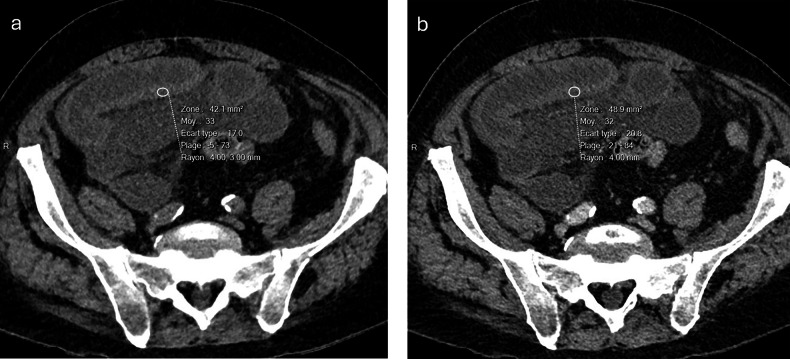 Figure 2
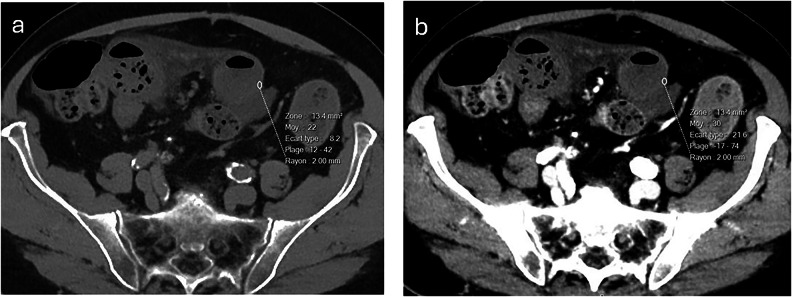 Figure 3
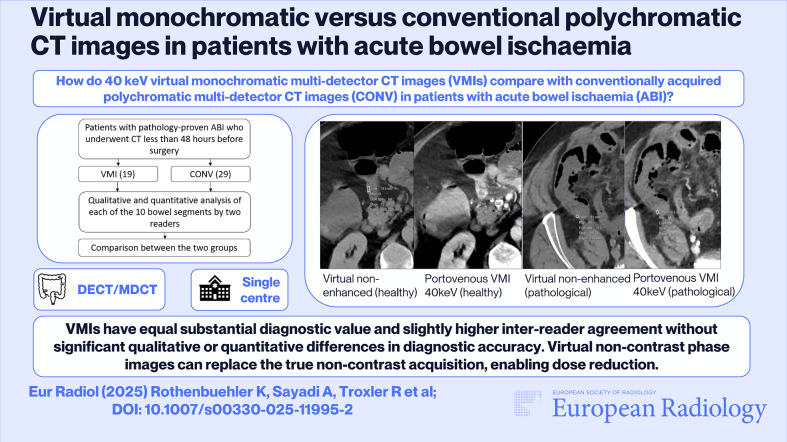 Figure 4
Peer Reviews
No public reviews on file for this paper yet. If you reviewed it on a platform where reviews are public (OpenReview, ICLR, NeurIPS, ICML), you can paste yours below so the community can read it here.
Videos
No videos yet. Explain this paper in a talk, walkthrough, or lecture? Add one.
Taxonomy
TopicsAdvanced X-ray and CT Imaging · Radiation Dose and Imaging · Aortic aneurysm repair treatments
Introduction
Acute bowel ischaemia (ABI) is an emergency with poor prognosis and a mortality rate of nearly 100%, in the absence of treatment or when treatment is initiated too late [1]. Therefore, prompt diagnosis and the detection of irreversible bowel necrosis are critical [2]. Due to steady availability, fast acquisition time, excellent spatial resolution, and reproducibility of image acquisition, contrast-enhanced multi-detector computed tomography (MDCT) is the imaging modality of choice for ABI, with a reported sensitivity and specificity between 90% and 100% [1, 3–8].
Although several bowel signs have been described as being helpful for detecting ABI on contrast-enhanced MDCT images [1, 8], reduced or absent mural enhancement is known to be a major feature, though variable sensitivity (18–92%) and specificity (50–100%) have been reported [1, 7, 9–11]. The lack of wall enhancement is most easily diagnosed in direct comparison with non-enhanced MDCT images traditionally acquired prior to the contrast-enhanced phase. However, the development of dual-energy computed tomography (DECT) seems to obviate the need for such non-enhanced MDCT acquisition, as virtual non-enhanced images can also be secondarily reconstructed from intravenous contrast medium-enhanced images.
Furthermore, DECT enables the reconstruction of virtual monochromatic images (VMIs) of any energy within a range of 40 keV to approximately 200 keV. Reconstructions at low energy maximise the contrast from the intravenous injection of the iodinated contrast agent as they approach the K-edge energy of iodine, which is 33 keV. Therefore, VMIs at low energy are particularly useful for the distinction between contrast-enhanced and non-enhanced bowel walls, facilitating the diagnosis of ABI.
Multiple authors have reported the general advantages of DECT in abdominal and emergency radiology [12–16], but only a few have focused on the exact benefits of DECT in ABI [17]. To the best of our knowledge, a quantitative analysis of bowel wall enhancement using density measurements on both conventional polychromatic images and VMIs has not yet been performed. Consequently, we designed a retrospective study to qualitatively and quantitatively compare 40-keV VMIs with conventionally acquired polychromatic MDCT images (CONV) in detecting reduced or absent bowel wall enhancement indicative of ABI from any cause. We also aimed to determine whether virtual non-enhanced MDCT images are as reliable as conventional non-enhanced MDCT images in assessing bowel wall density.
Materials and methods
Patients
Our study protocol (no 2021-01266) was approved by our institutional ethics committee. Patients’ active consent was waived. This single-centre retrospective study conformed with the Strengthening the Reporting of Observational Studies in Epidemiology (STROBE) guidelines [18]. We consecutively included all adult patients with ABI who were admitted to the emergency department, including intensive care patients between 1 January 2018 and 30 April 2021 and underwent contrast-enhanced abdominal CT during the portovenous phase, followed by surgery within < 48 h. Patients with ABI who only underwent non-enhanced CT or enhanced polychromatic CT acquisition without a non-enhanced phase were excluded, as well as patients < 18 years.
From the initial study population of 97 patients with pathologically proven ABI, 67 patients had undergone IV contrast-enhanced CT acquisition ≤ 48 h prior to surgery. In 51 of these patients, (virtual) non-enhanced acquisition was available in addition to the portovenous phase. After excluding three patients because of inadequate image quality, our final study population consisted of 48 patients. Twenty-nine patients belonged to the CONV group and 19 patients to the VMI group (Fig. 1).Fig. 1. Flow chart of patient inclusion. ABI, acute bowel ischaemia; CONV, conventional polychromatic multi-detector CT images; VMI, virtual monochromatic image
MDCT
MDCT examinations were performed on a 256-detector row CT system (Revolution, GE Healthcare). The imaging protocol included the whole abdomen and pelvis (diaphragm to pubic symphysis; 120 kV for CONV, fast 80 and 140 kV switching for VMIs; 300–400 mA; table speed, 55 mm per rotation [0.8 s], pitch 1.375, noise index 14). We intravenously injected the iodinated contrast medium Accupaque^®^ (Iohexol, 300 mgI/mL, GE Healthcare, volume in mL = body weight + 30 mL) at a flow rate of 3 mL/s and acquired a portovenous phase (75 s, 1.25/1 mm reconstructed axial slices) in all patients. The portovenous phase consisted of a conventional polychromatic acquisition preceded by a non-enhanced acquisition for the patients of the CONV group. Monochromatic reconstruction at 40 keV of the portovenous phase and a virtual non-enhanced reconstruction were performed for all patients with VMI acquisition. We used the iterative reconstruction algorithm ASiR-V and automatic tube current modulation in all three axes (SmartmA).
The choice to acquire the images in conventional polychromatic mode (CONV) or dual-energy mode (VMI) was based primarily on the clinical judgement of the on-call radiologist at the time, without strict criteria.
Arterial phase images were also acquired in all our patients with suspicion of primary ischaemia, but were not explicitly part of our study design, which focused on evaluating the bowel wall.
Image analysis
To ensure the reproducibility of our image analysis, the small and large bowel were divided into 10 segments. The small bowel was divided using the umbilicus as a reference point: small bowel loops situated in the left upper quadrant (SB-LUQ), left lower quadrant (SB-LLQ), right upper quadrant (SB-RUQ), and right lower quadrant (SB-RLQ). The large bowel was divided according to the anatomic segments into the caecum, ascending colon, transverse colon, descending colon, sigmoid, and rectum.
Qualitative analysis
Two radiologists with 15 and 20 years of subspeciality expertise in abdominal imaging, respectively, read CONV (polychromatic non-enhanced and portovenous images) and VMI (virtual unenhanced and 40-keV VMIs in portovenous phase) examinations separately while blinded to the exact localisation of ABI. Diagnostic criteria for ABI were absent or reduced bowel wall enhancement compared with the (virtual) non-enhanced phase. Helpful secondary diagnostic signs were associated bowel dilatation, mesenteric and pericolic stranding, and intestinal pneumatosis ± portovenous gas [19]. These were not analysed further.
Quantitative analysis
After an interval of 6–8 weeks to reduce recall bias, two radiologists independently measured the bowel wall density quantitatively on (virtual) non-enhanced and portovenous phase VMIs and CONV images in each of the 10 bowel segments using regions of interest (ROIs). ROIs measuring 10 mm², if possible, were placed within the wall of each of the 10 intestinal segments and the mean density, including standard deviation (SD) of each bowel segment recorded in Hounsfield Units (HU) for each patient. The readers were instructed to centre the ROIs on the most pathological bowel segment, to avoid walls with pneumatosis intestinalis, if possible, and to indicate segments with immeasurable walls.
Subsequently, a radiologist reconstructed the portal-venous phase of the VMI examinations in iodine density maps to measure the quantity of iodine uptake in healthy and pathological walls using ROIs.
Analysis of patient records
One author subsequently reviewed each electronic patient file using our clinical workflow information system Soarian Clinical (Cerner Corporation) and assessed demographic (age, sex) and laboratory parameters (leucocyte count, C-reactive protein (CRP), lactate levels), time between imaging and surgery, and the type of ischaemia. The latter was divided into either primary (i.e., of arterial origin) or secondary (i.e., due to underlying mechanical causes such as strangulation or volvulus resulting from bowel obstruction) ischaemia.
Statistical analysis
Statistical analyses were performed using R software (version 4.3.1, R Core Team) [20].
Data are presented as numbers and relative percentages. Continuous variables are presented as means ± SD and categorical variables as numbers or proportions. Between-group comparisons were performed using the Wilcoxon rank sum test with continuity correction for continuous variables, and chi-squared with continuity correction or the Fisher test for categorical variables. Statistical differences were considered significant if p < 0.05.
For the qualitative analysis of the 10 bowel segments, we calculated the sensitivity, specificity, positive and negative predictive values, and accuracy for each of the two readers using our pathological reference standard, followed by a between-group comparison (CONV versus VMIs).
Inter-reader agreement was assessed by a weighted kappa analysis according to Landis and Koch [21] with the following thresholds: 0–0.2 (very weak agreement), 0.21–0.4 (weak agreement), 0.41–0.6 (moderate agreement), 0.61–0.8 (important agreement), and 0.81–1.00 (near-perfect agreement).
The quantitative analysis comprised three tests:
- Wall density was compared between healthy and pathological small and large bowel segments, as measured separately by each reader on (virtual) non-enhanced and portovenous VMIs and CONV images.
- A subtraction analysis was performed to evaluate the difference in wall density between portovenous and (virtual) non-enhanced phases for pathological segments, followed by the same calculation for healthy segments. The results for pathological and healthy segments were then compared separately for VMIs and CONV images, as measured by each reader, and further stratified by small and large bowel.
- To directly compare mural contrast enhancement conspicuity between VMIs and CONV images, we calculated the delta wall density (defined as the density of the healthy wall in HU minus the density of the pathological wall in HU) as measured by each reader and further stratified by small and large bowel. The delta wall density was furthermore evaluated according to a more standardised approach (defined as (density of the healthy wall in HU minus the density of the pathological wall in HU) divided by the density of the healthy wall in HU). Finally, we calculated the contrast-to-noise ratio (CNR) between the bowel wall (Wall) and mesenteric fat (Fat) on portovenous VMIs and CONV images according to the following formula:
The CNR of the bowel wall was then compared between VMIs and CONV images for both pathological and healthy segments.
Results
Patients
Our final study population consisted of 48 patients (38 males, mean age 68.9 ± 15.1 years, range 29–91 years). Twenty-nine patients belonged to the CONV group and 19 patients to the VMI group (Fig. 1). In each patient, ABI was surgically confirmed, after which all except two patients underwent bowel resection. In two patients with extensive ABI, surgery was cancelled due to the fatal outcome. Thus, histopathology was our reference standard for all patients except two, for whom a detailed macroscopic surgical description of each bowel segment was available.
Demographic, clinical, and laboratory results
There were no significant differences in demographic, clinical, or biological variables between the two patient groups VMI and CONV (Table 1). The lactate level tended to be higher in the CONV group.Table 1. Comparison of demographic, clinical and laboratory variables in patients with acute bowel ischaemia investigated by the two CT techniquesVariablesCONV(n = 29)VMI(n = 19)p-valueAge (years)66.6 ± 15.972.4 ± 13.50.29Women460.16Primary/secondary ABI26/313/60.12Delay between imaging and surgery (h)8.16 ± 9.368.68 ± 13.30.24Leucocytes (g/L)16.63 ± 8.419.69 ± 11.20.36C-reactive protein (mg/L)127.41 ± 115.8170.38 ± 115.10.3Lactates (mmol/L)3.83 ± 2.92.77 ± 2.40.07Values are given as mean ± standard deviation unless otherwise notedCONV conventionally acquired polychromatic multi-detector CT images, VMI virtual monochromatic multi-detector CT images, ABI acute bowel ischaemia
In the CONV group (n = 29), ABI was of primary origin in 26 patients (89.7%), including 1 patient with concomitant vascular occlusion and 25 patients with non-occlusive mesenteric ischaemia (NOMI). ABI was of secondary origin in 3 patients (10.3%) due to strangulated small bowel obstruction. Surgical resection involved the small bowel in 8 patients, the colon in 16, and both in 5 patients.
In the VMI group (n = 19), ABI was of primary origin in 13 patients (68.4%), including 3 patients with concomitant vascular occlusions and 10 with NOMI. ABI was of secondary origin in 6 patients (31.6%), caused by stenosing colon carcinoma (n = 2), incarcerated hernia (n = 2), or strangulated small bowel obstruction (n = 2). Surgical resection involved the small bowel in 8 patients, the colon in 6 patients, and both in 5 patients.
Qualitative analysis
The two radiologists performed a qualitative analysis of a total of 480 bowel segments (290 in CONV and 190 in VMI acquisition). Table 2 shows sensitivity, specificity, positive predictive value, negative predictive value, and accuracy for each technique, each bowel segment, and each reader for CONV versus VMIs. The overall sensitivity and specificity for the two readers ranged from 75.9% to 82% and from 85.9% to 88.7%, respectively, without any significant differences between the two techniques (p = 0.55 and p = 0.5, respectively).Table 2. Qualitative analysis of 480 bowel segments for the detection of ABICONVVMISensSpecPPVNPVAccSensSpecPPVNPVAccReader 1 SB-LUQ10095.8383.2910096.558085.7166.6592.3184.21 SB-LLQ77.789077.7590.0186.2190.9110010099.8994.74 SB-RUQ80.0095.8379.9595.8493.1110071.4355.5410078.94 SB-RLQ83.3382.3576.9487.4982.7691.6785.7191.6885.6989.48 Caecum73.3371.4373.3171.4572.4183.3384.6271.4591.6684.21 Asc colon66.6758.8253.3571.4162.0762.5081.8271.4275.0073.69 Trans colon71.4372.7345.4088.9172.4180.0078.5757.1291.6778.95 Desc colon10010010010010075.0080.0050.3792.2078.94 Sigmoid66.6795.0085.6986.3886.2266.6781.2540.0292.8578.95 Rectum50.0092.0050.0192.0086.2050.0094.1249.9394.1389.49 All segments77.0187.3272.2589.8684.2381.9785.9170.3792.1084.76Reader 2 SB-LUQ40.0010010088.9289.6810085.7171.4110089.47 SB-LLQ77.7895.0087.4890.4989.6690.9110010088.8994.74 SB-RUQ80.0010010096.0196.5610092.8683.3210094.74 SB-RLQ83.3382.3576.9487.4982.7691.6710010087.4894.73 Caecum73.3392.8691.6676.4982.7666.6776.9257.1783.3273.68 Asc colon75.0076.4769.2581.2475.8675.0081.8274.2282.4379.02 Trans colon71.4359.0935.6786.6962.0680.0057.1439.9888.9063.15 Desc colon10095.0089.9910096.5550.0073.3333.4084.5868.41 Sigmoid66.6795.0085.6986.3886.2233.3310010088.8889.47 Rectum75.0088.0050.0195.6586.2150.0010010094.4694.75 All segments77.8688.6774.1689.5584.8380.3386.0573.1390.2584.21ABI acute bowel ischaemia, CONV conventionally acquired, polychromatic multi-detector CT images, VMI virtual monochromatic images, Sens sensitivity, Spec specificity, PPV positive predictive value, NPV negative predictive value, Acc accuracy. SB small bowel, LUQ left upper quadrant, LLQ left lower quadrant, RUQ right upper quadrant, RLQ right lower quadrant, Asc ascending, Trans transverse, Desc descending
The comparison between the small and large bowel for ABI localisation was generally non-significant, with three exceptions: First, reader 2 assessed ABI in the small bowel with higher sensitivity than ABI in the large bowel on VMIs (p = 0.008). In addition, both readers assessed ABI in the small bowel with a higher specificity than ABI in the large bowel on CONV images (p = 0.01 and p = 0.001, respectively).
The overall interobserver agreement between the two readers was important (kappa 0.73). For the analysis of CONV images, the agreement was important (kappa 0.72), and for VMIs, it was nearly perfect (kappa 0.83).
Qualitative image analysis also revealed pneumatosis intestinalis in 7 and 10 patients and free abdominal fluid in 22 and 19 patients of the CONV and VMI group, respectively.
Quantitative analysis
From the 480 bowel wall segments (290 in CONV and 190 in VMI mode), reader 1 considered 66 wall segments (13.7%, 22 CONV, 44 VMI) and reader 2 considered 45 wall segments (9.4%, 28 CONV, 17 VMI) as non-assessable, mostly because the walls were too thin, due to extreme luminal dilatation.
Significant differences (p < 0.05) in wall density between healthy and pathological bowel segments were detected on non-enhanced and portovenous acquisitions for both CONV (Fig. 2) and VMI examinations (Fig. 3), except for reader 2 when comparing the non-enhanced healthy small bowel segments with the pathological small bowel segments on VMIs (Table 3). ROI subtraction analysis yielded significant differences in wall density throughout all bowel segments for both readers and for each acquisition mode (Table 3).Fig. 2. Axial, conventionally acquired, polychromatic non-enhanced (a) and portovenous (b) multi-detector CT images demonstrate acute bowel ischaemia resulting from acute small bowel obstruction in an 88-year-old male patient. Quantitative analysis of the bowel wall revealed no enhancement during the portovenous phase (b), with a mean density of 33 Hounsfield units (HU) in a and 32 HU in bFig. 3. Axial 40 keV virtual monochromatic non-enhanced (a) and portovenous (b) multi-detector CT images demonstrate acute bowel ischaemia resulting from acute small bowel obstruction in an 86-year-old male patient. Quantitative analysis of the bowel wall revealed only minimal change in the mean bowel wall density during the portovenous phase (b), with a mean density of 30 Hounsfield units (HU) in b compared to 22 HU in aTable 3. Quantitative analysis of bowel wall densityReader 1Reader 2p-valuesWall densitiesCONVVMICONVVMI Small bowel (Virtual) non-enhanced phase:healthy vs pathological wall**< 0.01****< 0.01****< 0.010.119 Portovenous phase:healthy vs pathological wall< 0.010.011< 0.010.033** Large bowel (Virtual) non-enhanced phase:healthy vs pathological wall**< 0.01< 0.010.030.042** Portovenous phase:healthy vs pathological wall**< 0.01****< 0.01****< 0.01****< 0.01Subtraction analysis Small bowel Portovenous − (virtual) non-enhanced pathological wall vs portovenous − (virtual) non-enhanced healthy wall< 0.01****< 0.01****< 0.01****< 0.01** Mean density (HU): healthy − pathological wall7.5814.557.6410.64Large bowel Portovenous − (virtual) non-enhanced pathological wall vs portovenous − (virtual) non-enhanced healthy wall**< 0.01****< 0.01****< 0.01****< 0.01** Mean density (HU): healthy − pathological wall5.2725.264.4323.72Significant p-values are in boldHU Hounsfield units, CONV conventionally acquired polychromatic multi-detector CT images, VMI virtual monochromatic images
We found no significant differences when comparing the delta wall density (defined as the density of the healthy wall minus the density of the pathological wall expressed in HU) between the CONV and VMIs, stratified by small and large bowel (Table 4). Notably, for reader 1, a trend favouring VMIs was observed because of higher delta values for the small and large bowel than those measured on CONV images. The standardised approach (defined as (density of the healthy wall in HU minus the density of the pathological wall in HU) divided by the density of the healthy wall in HU) showed a significant difference in favour of CONV for the small bowel evaluation of reader 1 and a significant difference in favour of VMI for the large bowel evaluation of reader 2. The CNR, computed on the basis of the HU for the bowel wall and adjacent mesenteric fat, did not reveal any significant differences between CONV and VMIs for healthy and pathological small bowel segments. The CNR of healthy and pathological large bowel segments, as measured by reader 1, was significantly in favour of VMIs (Table 5).Table 4. Comparison between wall densities measured on CONV and VMIs by means of delta (healthy – pathological) valuesReader 1Reader 2HUp-valuesHUp-valuesSmall bowel wall CONV (healthy − pathological)vsVMI (healthy − pathological)24 ± 42.5vs51 ± 117.50.09333.5 ± 47.0vs25.0 ± 78.00.611Large bowel wall CONV (healthy − pathological) vsVMI (healthy − pathological)17.0 ± 41.0vs20.5 ± 122.50.0829.0 ± 44.0vs10 ± 116.50.423NormalisedReader 1Reader 2p-valuesp-valuesSmall bowel wall CONV (healthy − pathological/healthy)vsVMI (healthy − pathological/healthy)0.4 ± 0.4vs0.2 ± 0.50.0190.4 ± 0.3vs0.3 ± 0.40.533Colon wall CONV (healthy − pathological/healthy)vsVMI (healthy − pathological/healthy)0.03 ± 0.6vs0.21 ± 1.10.4590.05 ± 1.0vs0.4 ± 1.20.009Significant p-values are in boldCONV conventionally acquired polychromatic multi-detector CT images, VMI virtual monochromatic images, HU Hounsfield UnitsTable 5Contrast-to-noise ratio of healthy and pathological bowel walls (related to mesenteric fat)Reader 1Reader 2Small bowelp-valuesp-values Healthy CONV vshealthy VMI11.0 ± 2.9vs11.8 ± 4.30.2110.8 ± 2.8vs10.5 ± 4.00.91 Pathological CONVvspathological VMI8.7 ± 2.8vs10.6 ± 2.80.128.8 ± 4.5vs9 ± 3.20.32Large bowel Healthy CONVvshealthy VMI6.4 ± 5.5vs8.9 ± 4**< 0.019.1 ± 3.4vs10.2 ± 3.60.10 Pathological CONVvspathological VMI8.6 ± 2.3vs10.8 ± 2.9< 0.01**9.1 ± 2.3vs9.8 ± 3.80.07Significant p-values are in boldCONV conventionally acquired polychromatic multi-detector CT images, VMI virtual monochromatic images
Finally, iodine quantification in the bowel wall assessed on the iodine density maps of the VMI acquisitions (n = 19) yielded significant differences between the healthy and pathological segments for both the small bowel (healthy wall = 2.39 ± 0.58 mg/mL, pathological wall = 1.1 ± 0.42 mg/mL, p < 0.001) and the large bowel (healthy wall = 2.51 ± 0.65 mg/mL, pathological wall = 1.34 ± 0.6 mg/mL, p < 0.001), because of decreased iodine content in the ischaemic walls.
Discussion
In this retrospective study, we showed that the diagnostic value of 40-keV VMIs for detecting ABI was equal to that of CONV images, with good sensitivity and specificity among all readers. Quantitative analysis revealed significant differences in wall density between healthy and ischaemic bowel segments, which were nearly consistently detected on both (virtual) non-enhanced, portovenous acquisitions and subtracted images. Therefore, we conclude that virtual non-enhanced images are as reliable as (polychromatic) non-enhanced images when compared to portovenous images for detecting and localising reduced or absent wall contrast enhancement.
Two of our results demonstrated a slight superiority of VMIs over polychromatic acquisition. We observed a trend favouring VMIs, as the measurements of reader 1 yielded higher delta values for the small and large bowel, and we found a significantly higher CNR for healthy and pathological large bowel segments when assessed by reader 1.
Several previous authors addressed this topic, concluding that DECT significantly improves the conspicuity of the ischaemic bowel compared with conventional CT by increasing attenuation differences between ischaemic and perfused segments on low-energy images [17, 22–25]. However, only Lourenco et al directly compared conventional polychromatic images with virtual monoenergetic (40 keV) images [22]. Retrospectively including 60 patients with suspected ABI, these authors reported improved diagnostic accuracy, better conspicuity and a higher interobserver agreement for 40-keV VMIs than with conventional polychromatic acquisition. We also observed a slightly higher interobserver agreement for VMIs (0.83 vs 0.72). As in Lourenco et al, we chose to reconstruct our VMIs at 40 keV, providing maximal mucosal enhancement and facilitating the detection of attenuation differences. The qualitative analysis of our readers did not reveal significant diagnostic differences between CONV and VMI, which partly aligns with Lourenco et al’s results [22]. The slightly lower diagnostic value of our qualitative analysis compared to that described by Lourenco et al may be attributed to the greater challenge of precisely localising ABI in a patient as opposed to determining whether the patient has ABI without the need for exact localisation.
Despite quantifying the iodine wall concentration and observing significant differences between healthy and pathological bowel segments, we did not include iodine density maps in our image analysis. Xu et al found no significant difference in ABI diagnosis or diagnostic confidence and even decreased sensitivity and negative predictive value using supplementary iodine map images added to the analysis of VMIs. Therefore, they advised against the systematic use of iodine density maps in clinical routine [24]. According to Wu et al, false linear iodine densities may appear along gas/water or gas/soft-tissue interfaces on these maps, which can simulate mural iodine enhancement [26].
Our study has several limitations. First, though we aimed at having a pathological reference standard for all patients, two of them did not undergo bowel resection, requiring us to rely on the detailed surgical report. Second, our study was retrospective and conducted at a single centre. Third, we included patients with primary and secondary acute bowel ischaemia, which introduces heterogeneity in disease aetiology and may affect the interpretation of imaging findings. Nonetheless, this study design may better reflect the true clinical scenario in which patients are encountered. Fourth, the relatively small number of patients in the VMI group may compromise the robustness of the statistical analysis. However, the approach of a segment-by-segment analysis enabled us to collect more data, substantially improving the statistical results.
Fourth, we did not include the arterial phase in our image analysis, although it was acquired in all our patients with suspected primary ABI. Indeed, the arterial phase is essential for vessel changes occurring in ABI; however, our image analysis focused on bowel wall assessment, for which the portovenous phase needs to be considered [1]. Finally, bowel wall enhancement was the sole parameter used to localise ABI, rather than incorporating other, more indirect features, such as bowel wall thickness, pneumatosis intestinalis, portal-venous gas or vascular signs. Indeed, in a recent meta-analysis, Reimtal Blaser et al pointed out that none of the non-vascular features alone was sufficiently reliable to diagnose ABI or its progression to transmural necrosis, whereas a combination of different radiological features conveyed a potential [27]. However, in many cases of ABI, the vascular occlusion is not detected or present, highlighting the pathophysiological variety of AMI [27]. This also applies to our study population, including 4 patients (8.3%) with vascular occlusion only.
In conclusion, our comparison of VMIs with CONV images for localising ABI revealed that VMIs have substantial diagnostic value and slightly higher inter-reader agreement without significant qualitative or quantitative differences in diagnostic accuracy. In addition, we found significant differences in bowel wall density between healthy and pathological segments on subtraction images in our two groups. Thus, we can rely on the virtual non-contrast phase instead of acquiring an additional non-contrast phase when ABI is suspected, which will enable considerable dose reduction in the future.
The reference list from the paper itself. Each links out to its DOI / PubMed record.
- 1R Core Team (2021) R: a language and environment for statistical computing. Available via https://www.R-project.org/ accessed date July 2023.