Mandibular Cortical Thickness Predicts Skull BMD in Adolescents
Tarsila de Moura Figueiredo, Vid Prijatelj, Olja Grgic-Chavez, Carolina Medina-Gomez, Eppo Wolvius, Lea Kragt, Fernando Rivadeneira

TL;DR
Thicker mandibular cortex in adolescents is linked to higher skull bone mineral density, suggesting dental X-rays could help identify children with low bone density.
Contribution
This study is the first to show that mandibular cortical thickness from dental X-rays is a reliable predictor of skull BMD in children.
Findings
Mandibular cortical thickness measures (MI and sPMI) are significantly associated with skull BMD in peripubertal children.
The association remains significant even after adjusting for confounders and using a Mendelian randomization framework.
Children with extreme genetic predispositions for BMD showed measurable differences in mandibular cortical thickness.
Abstract
Bone mass accrual during childhood and early adulthood is the most important modifiable determinant of lifelong skeletal health. Dental panoramic radiographs (DPRs) and measurements derived from them have yet to be assessed as a screening tool for low bone mineral density in children. Skull bone mineral density (SK-BMD) has high heritability and is less affected by environmental factors than measures of BMD at other skeletal sites. This study aimed to analyze the relationship between mandibular cortical thickness and SK-BMD in peripubertal children. This population-based cross-sectional study involved 2672 children aged 13 years from the Generation R Study. Mandibular cortical thickness was obtained from DPRs and quantified with the mental index (MI) and the superior panoramic mandibular index (sPMI). SK-BMD was quantified from total body dual-energy X-ray absorptiometry scans and…
Genes, proteins, chemicals, diseases, species, mutations and cell lines named across the full text — each resolved to its canonical identifier and authoritative record.
Click any figure to enlarge with its caption.
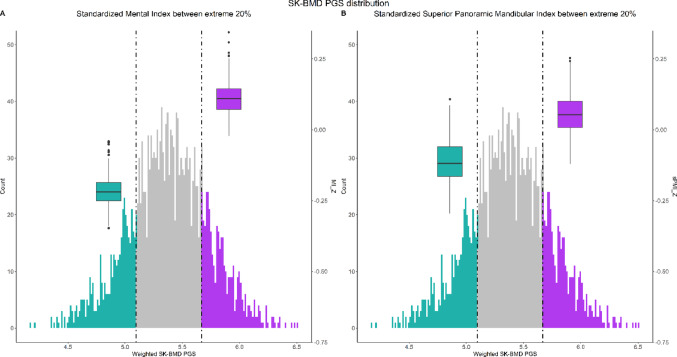 Figure 1
- —http://dx.doi.org/10.13039/501100001826ZonMw
Peer Reviews
No public reviews on file for this paper yet. If you reviewed it on a platform where reviews are public (OpenReview, ICLR, NeurIPS, ICML), you can paste yours below so the community can read it here.
Videos
No videos yet. Explain this paper in a talk, walkthrough, or lecture? Add one.
Taxonomy
TopicsDental Radiography and Imaging · Forensic Anthropology and Bioarchaeology Studies · Bone health and osteoporosis research
Introduction
Bone mineral density (BMD) is the amount of mineralized bone content per square centimeter in a given region of interest [1]. Dual-energy X-ray absorptiometry (DXA) is considered the gold standard to measure BMD [2]. Osteoporosis is characterized by low BMD, which increases fracture risk and diminishes the quality of life [3, 4]. Peak bone mass is an important determinant of BMD in the life course as it refers to the state of maximum accretion of skeletal mass. Environmental factors may be modified in childhood to maximize BMD before peak bone mass is reached. Approximately 26% of the final adult total body bone mass is accrued during the 2-years surrounding the period of peak height velocity [5]. By 18 years of age, 90% of peak bone mass is already achieved [1]. Therefore, bone mass accrual during childhood and early adulthood is an important modifiable determinant of lifelong skeletal health.
In children, skeletal development is assessed through DXA scans using total body less head BMD. However, DXA requires high initial and operational costs which restrict its availability [6]. Hence, radiographs have been proposed as a possible alternative to DXA scans [7]. Dental panoramic radiographs (DPRs) have been proposed as a useful tool for assessing low BMD in adults [8]. To that end, many quantitative indices have been proposed. Within those, the mandibular cortical thickness has been reported as having the best specificity for low BMD [9]. Previously, we showed that mandibular cortical thickness and total body less-head BMD are associated and may share underlying biological pathways [10]. Since the head is excluded from BMD evaluation in pediatric populations, it is unclear if DPRs parameters correlate with SK-BMD [11].
SK-BMD has been shown to have weaker associations with anthropometric, body composition, and lifestyle factors than other skeletal sites. Interestingly, despite less mechanical loading, calvarial osteocytes have been shown to maintain bone mass [12]. As such, SK-BMD has emerged as a relevant parameter for bone research. It has high heritability and is considerably less affected by environmental influences [13]. Due to those unique characteristics, SK-BMD captures more efficiently the genetic architecture of clinically relevant skeletal sites [14]. Analyzing SK-BMD thus provides an opportunity to better elucidate an individual’s genetic potential for bone mass accrual while serving the purpose of standing as a proxy of the gold standard for BMD evaluation in children.
Previous genome-wide association studies (GWAS) have identified genetic variants influencing SK-BMD and demonstrated that, while SK-BMD is genetically correlated to BMD at other skeletal sites, it also has specific loci, such as variants mapping to EYA4 and LIN7C [14, 15]. Our study employs a design similar to that used by “Recall-by-Genotype” (RbG) studies [16]. RbG studies seek recalling participants from the extremes of a genotype distribution for further phenotyping with the advantage of drawing comparisons in an “unconfounded” setting. This is possible due to the Mendelian randomization (MR) framework underlying a given polygenic score (PGS) distribution, where the random allocation of alleles (at conception) results in the randomization of confounding factors across PGS subgroups. Using this approach in an observational population-based study, allows us to evaluate the association between mandibular cortical thickness and SK-BMD in an unconfounded setting [17].
Given the high accessibility of DPRs in clinical dental practice, we aimed to assess their potential use for the identification of low BMD in children. Thus, the aim of this study is to analyze the relationship between mandibular cortical thickness and skull bone mineral density in healthy peripubertal children. The secondary objective is to describe the determinants of mandibular cortical thickness. The association established in an observational setting is further assessed using the MR framework.
Materials and Methods
Study Design
Study Population
This cross-sectional study is embedded in the Generation R Study [18]. Pregnant women who resided in Rotterdam, the Netherlands, within 2002–2006 were recruited. The children were assessed periodically via repeated questionnaires and measurements during visits to the research center. At approximately 13 years old, 4929 children had their growth assessed. Of those, 2672 participants had complete information on mandibular cortical thickness, SK-BMD and other relevant measurements. This study was approved by the Medical Ethics Committee of the Erasmus Medical Center, Rotterdam (MEC-2015-749), and followed the guidelines of the Helsinki Declaration. Study participants provided written informed consent at each phase of the study, and from the age of 12, children signed their own consent forms in accordance with Dutch Law. This cross-sectional study follows the STROBE (Strengthening the Reporting of Observational Studies in Epidemiology) reporting guidelines.
SK-BMD Assessment
SK-BMD was measured directly and by proxy using a PGS. Total body DXA scans were performed to obtain direct measurements (GE-Lunar iDXA scanner, GE Healthcare, Madison, WI, USA) according to manufacturer instructions. Qualified research assistants obtained the measurements. A daily quality control protocol was followed similarly to previous visits. Before scanning, participants were asked to remove shoes, heavy clothing, metallic accessories, and anything else that could affect the procedure [19]. The skull region of interest was extracted from the DXA scans. SK-BMD (g/cm^2^) was calculated using the enCORE software (v13.60).
Genotyping and SK-BMD PGS Calculation
DNA samples from cord blood or blood samples collected at the visit at 6 years old were genotyped in two phases, using Illumina HumanHap 610 or 660 Quad chips (Illumina Inc., CA, USA), and Global Screening Array-Molecular Diagnostics GSA-MD (GSA-MD) v2 arrays (Illumina Inc., CA, USA). Quality control, phasing, and imputation procedures for both phases have been described in detail previously [20, 21]. The PGS was created using summary statistics from a GWAS on SK-BMD [15]. Palindromic variants as well as variants with low minor allele frequency (MAF < 0.01) and insufficient imputation quality (Rsq < 0.8) were excluded. Information was obtained for 79 independent SNPs that were found to be genome-wide significant (p value < 5 × 10^−8^) after performing conditional and joint multiple-SNP analysis [15]. Dosage information from the same variants was extracted from imputed data of participants. Data was harmonized so that each extracted variant allele was trait-increasing. A weighted PGS (wPGS) was calculated wherein allele dosages were multiplied by their respective effect size and the products summed together [22].
Mandibular Cortical Thickness Assessment
The mandibular cortical thickness was based on DPRs, obtained from an orthopantomograph OP200D device (Oldelft Benelux B.V., Veenendaal, the Netherlands). Prior to scanning, participants removed any accessories that could present themselves as artifacts in the radiographs. Chin rests or bite blocks were provided to those missing front teeth or having malocclusion. Scans were taken following manufacturer specifications. The mandibular cortical thickness was quantified by two individual measures: MI and sPMI. Based on the DPRs, a trained dentist calculated both indices for each individual. A subset of 150 radiographs were re-evaluated and evaluated by a second dentist for inter- and intraclass correlation analyses. MI expresses the cortical thickness on an axis that crosses the approximate center of the mental foramen and forms a 90 angle with an axis tangential to the lower mandibular rim. sPMI is the ratio of MI and the distance between the mental foramen’s upper border and the mandible’s lower border on the same vertical axis [8]. These measurements were taken bilaterally, and the arithmetic mean was calculated. When both mental foramina were not clearly visible, the sinistral side was used since it was more often available. All measures were performed using the Viewbox 4 software (dHAL Software, Kifissia, Greece).
Migration Background
Migration background was established at enrollment based on the country of birth of the parents according to the Statistics Netherlands (CBS) classification and has been described elsewhere [23]. The diverse migration backgrounds were combined in three main categories: Europeans (all European countries, Americans, Oceanics, and North Africans), Asians (all Asian countries and Surinamese Hindustanis), and Africans (sub-Saharan Africans, Dutch Antilleans, and Surinamese Creoles) [24].
Ancestral Background
Genetically determined ancestral background was utilized to identify participants of European descent for inclusion in the MR framework. Genetic ancestry for each individual was established using ADMIXTURE [25]. Based on population allele frequency and the highest fraction of the estimated ancestral proportion (> 50%), individuals were clustered into three main groups: African (AFR), European (EUR), and Asian (ASN). Participants were classified as “admixed” if none of the calculated ancestral proportions exceeded 50% [26].
Puberty Scores
A questionnaire including seven questions regarding growth spurt, body hair growth, facial hair growth for boys, skin changes related to acne, voice changes for boys, breast development for girls and menarche for girls was filled in by the participants. The answers were used to calculate a pubertal score. All questions, except for the one on menarche, had five possible answers and were graded as follows: not yet started (1 point), barely started (2 points), definitively started (3 points), seems complete (4 points), and not known (missing). Menarche was a dichotomous outcome graded as: yes (4 points) and no (1 point). The point values were averaged for all items and summed to give the puberty score [27]. This questionnaire has been validated and shows sufficient accuracy to distinguish prepubertal and pubertal stages [28].
Additional Covariates
Sex and date of birth were obtained from the medical records and hospital registries. Height was measured using a Harpenden stadiometer (Holtain Limited, Dyfed, U.K.). Weight was determined with a mechanical personal scale (SECA, Almere, the Netherlands). BMI was calculated as body weight (kg)/height (m)^2^.
Statistical Analysis
The baseline descriptive characteristics of study participants were assessed using T-tests for continuous variables and chi-squared tests for categorical variables and presented stratified by sex. The association between mandibular cortical thickness and SK-BMD was explored using ordinary-least squares linear regression. Prior to running the model, these parameters were standardized using Z-score (normal) transformation for ease of interpretation. The standardized variables were then labeled as sPMI_Z, MI_Z, and SK-BMD_Z. Using multivariable models, the analysis was adjusted for confounders in a stepwise fashion as follows. Model 0 had only the raw association. Model 1 included age, sex, BMI, height and migration background. Model 2 contained the aforementioned covariates and puberty score. European migration background and male sex were defined as reference categories.
The effect of each determinant on mandibular cortical thickness was analyzed with univariate linear regression models. The marginal effect was assessed in two multivariable models. Model 1 contained all covariates except puberty and Model 2 included all covariates. Sensitivity analyses were performed with participants of European migration background and with missing puberty scores imputed using imputation by chained equations with 10 imputations. The baseline characteristics of participants with and without puberty information were compared with Student's t-tests, Mann–Whitney U tests or Chi-square tests.
The MR framework was used to mitigate the impact of unmeasured confounding. It was performed in participants of European ancestral background. Study participants were allocated along the wPGS distribution. Before comparing the extremes of the distribution, a power calculation to define extremes’ cutoffs was performed [17]. The parameters were sample size, number of quantiles, R^2^ between PGS and exposure as reported before [15], R^2^ between exposure and outcome, and alpha level. The analysis indicated sufficient statistical power to define quintiles as cutoff points. Individuals were stratified into quintiles based on their wPGS. The relevance assumption of the instrumental variable was assessed by regressing SK-BMD on the wPGS. The F-statistic was used to evaluate instrumental variable strength. Subsequently, each covariate was regressed on the wPGS to investigate the independence assumption. Characteristics of the participants in the bottom (1st) and top (5th) quintiles were compared using a T-test or a Chi-squared test. All statistical analyses were performed with R statistical software, version 4.1.2 (R Foundation for Statistical Computing).
Results
Population Characteristics
The observational analysis included 2672 children (1268 boys; 47.5%) with median age of 13.5 (IQR = 0.3) years old (Table 1). A total of 2254 children were of European migration background (84.4%). The mean sPMI and MI were 0.28 and 6.21 mm, respectively. The mean SK-BMD was 1.70 g/cm^2^. Girls had significantly higher measurements of SK-BMD, mandibular cortical thickness, BMI and puberty score than boys (p value < 0.001).Table 1. Population characteristics of the study sample stratified by sexBoysGirlsTotalp valueN1268 (47.5)1404 (52.5)2672SK-BMD (g/cm^2^)1.63 (0.17)1.77 (0.21)1.70 (0.20)< 0.001sPMI0.27 (0.05)0.29 (0.05)0.28 (0.05)< 0.001MI (mm)6.12 (1.19)6.29 (1.02)6.21 (1.10)< 0.001Age (Years)13.61 (0.34)13.60 (0.36)13.60 (0.35)0.461Weight (kg)53.32 (10.96)54.31 (10.52)53.84 (10.74)0.017Height (cm)165.75 (8.78)163.94 (6.91)164.80 (7.90)< 0.001BMI (kg/m^2^)19.29 (3.01)20.15 (3.44)19.74 (3.27)< 0.001Migration background African142 (11.2)139 (9.9)281 (10.5)0.456 Asian68 (5.4)69 (4.9)137 (5.1) European1058 (83.4)1196 (85.2)2254 (84.4)Puberty score2.04 (0.63)2.82 (0.61)2.45 (0.74)< 0.001Values are expressed as means with their corresponding standard deviation. Significant p values are represented in boldSignificance threshold ≤ 0.001N sample size, SK-BMD skull bone mineral density, sPMI superior panoramic mandibular index, MI mental index, BMI body mass index*Count percentage
Mandibular Cortical Thickness and Skull Bone Mineral Density
In the raw model, each standard deviation (SD) increase of sPMI was associated with a 0.22 SD increase of SK-BMD (Table 2) (p value < 2 × 10^−16^). Each SD increase of MI was associated with a 0.34 SD increase of SK-BMD (p value < 2 × 10^−16^). In model 1, each SD increase of sPMI and MI was associated with a 0.12 and 0.25 SD increase of SK-BMD, respectively (p value = 6.7 × 10^−12^, p value < 2 × 10^−16^). In model 2, the effect sizes of the sPMI and MI associations were slightly decreased and remained significant (respectively β = 0.11 and 0.23, p value = 6.01 × 10^−10^ and < 2 × 10^−16^). Sensitivity analyses on children of European background only (Table S1) and with imputed puberty status (Table S2) followed the original models’ trends. Participants with puberty score information were more often of European migration background and 0.39 cm taller than those who had this information missing (p value < 0.05).Table 2. Association between mandibular cortical thickness and SK-BMD measured in children aged 13 yearsBoys (N = 1268)Girls (N = 1404)Total (N = 2672)Model 0Model 1Model 2Model 0Model 1Model 2Model 0Model 1Model 2Model 0Model 1Model 2Model 0Model 1Model 2Model 0Model 1Model 2sPMI_Z**0.11 (0.023)****0.08 (0.024)****0.09 (0.024)****0.23 (0.027)****0.18 (0.026)****0.15 (0.025)****0.22 (0.019)****0.12 (0.018)****0.11 (0.018)MI_Z0.23 (0.021)****0.20 (0.023)****0.21 (0.023)****0.43 (0.027)****0.34 (0.026)****0.31 (0.026)****0.34 (0.018)****0.25 (0.018)****0.23 (0.018)**Age (Years)0.17 (0.071)0.17 (0.071)0.13 (0.069)0.13 (0.069)**0.40 (0.068)****0.34 (0.066)****0.40 (0.066)****0.35 (0.064)****0.29 (0.050)****0.27 (0.049)****0.27 (0.048)****0.25 (0.048)**Sex (Girl)**0.66 (0.035)****0.49 (0.043)****0.67 (0.034)****0.53 (0.042)**BMI (kg/m^2^)**0.03 (0.008)****0.03 (0.008)**0.02 (0.008)0.02 (0.008)**0.07 (0.007)****0.04 (0.008)****0.05 (0.007)****0.03 (0.007)****0.055 (0.005)****0.046 (0.006)****0.042 (0.005)****0.036 (0.005)**Height (cm)0.01 (0.003)**0.01 (0.003)0.003 (0.003)0.01 (0.003)0.03 (0.004)****0.02 (0.004)****0.03 (0.003)****0.02 (0.004)0.017 (0.002)0.0097 (0.002)0.011 (0.002)0.0059 (0.002)Migration background (African)0.08 (0.075)0.09 (0.075)0.02 (0.073)0.03 (0.073)0.13 (0.082)0.07 (0.079)0.08 (0.079)0.03 (0.076)0.105 (0.056)0.081 (0.056)0.049 (0.055)0.033 (0.055)Migration background (Asian)− 0.18 (0.103)− 0.15 (0.104)− 0.21 (0.101)− 0.17 (0.102)0.20 (0.113)0.06 (0.110)0.15 (0.109)0.04 (0.106)− 0.039 (0.077)− 0.101 (0.077)− 0.078 (0.076)− 0.12 (0.076)Puberty score− 0.10 (0.045)− 0.15 (0.044)****0.46 (0.044)**0.42 (0.043)**0.21 (0.032)0.17 (0.032)Results are presented for each sex and for the whole study population separately. Table represents linear regression coefficients and standard errosSignificance threshold ≤ 0.001. Significant estimates are represented in boldModel 0: raw association. Model 1: sPMI_Z or MI_Z and age, sex, BMI, height and migration background. Model 2: sPMI_Z or MI_Z and age, sex, BMI, height, migration background and puberty scoresPMI superior panoramic mandibular index, MI mental index, BMI body mass index. Z standardized values
Determinants of Mandibular Cortical Thickness
In the univariate models sex, BMI, African migration background and puberty score were significantly associated with sPMI (respectively β = 0.33, 0.065, 0.35 and 0.29) (Table S3). All covariates, besides Asian migration background (p value = 0.67), had a significant effect on MI. In model 1, the relationship between the determinants and sPMI or MI resembled that observed in univariate models with the exception of age (p value > 0.001). In model 2, BMI (β = 0.047, p value = 1.1 × 10^−14^), African migration background (β = 0.27, p value = 1.3 × 10^−5^), and puberty score (β = 0.19, p value = 3.4 × 10^−8^) were significantly associated with sPMI. The aforementioned parameters and height (β = 0.013, p value = 8.6 × 10^−7^) were significantly and positively associated with MI. The effect of sex on sPMI and MI was attenuated and no longer significant once the puberty score was included.
MR Framework
A total of 2118 participants of European ancestral background had genetic data available for PGS calculation. The wPGS was a strong instrumental variable for SK-BMD (β = 0.8, p value < 2 × 10^−16^, F statistic = 183.8). It was not associated with age (p value = 0.3, F statistic = 1.1), BMI (p value = 0.4, F statistic = 0.7), sex (p value = 0.6), and puberty (p value = 0.2, F statistic = 1.9), ensuring the wPGS was independent of confounding factors. According to the power calculation, the study was sufficiently powered (1 − β > 0.8) to compare individuals grouped in the 1st and 5th quintiles of the distribution. SK-BMD (p value < 0.001), sPMI (p value = 0.032) (Fig. 1), and MI (p value < 0.001) were significantly higher in the top quintile compared to the bottom quintile, while other parameters were randomized (Fig. 1 and Table 3).Fig. 1. Distribution of the skull bone mineral density (SK-BMD) weighted polygenic score (wPGS). Dashed lines mark and colored areas highlight the 20% extreme quintiles. Boxplots show the distribution of mandibular cortical thickness indices in children in the extreme quintiles of the PGS distribution. A Standardized superior panoramic index (sPMI_Z). B Mental index (MI_Z)
Table 3. Representation of skull bone mineral density (SK-BMD), mandibular cortical thickness indices and other covariates for children at the 20% extreme quintiles of the SK-BMD polygenic score (PGS) distributionBottom 20%Top 20%p valueStratified by quintile N424424 SK-BMD_Z (mean (SD))− 0.40 (0.90)0.42 (0.95) < 0.001 sPMI_Z (mean (SD))− 0.09 (0.97)0.05 (0.98) 0.032 MI_Z (mean (SD))− 0.21 (0.88)0.13 (0.96) < 0.001 Age (Years) (mean (SD))13.62 (0.35)13.58 (0.33)0.132 BMI (mean (SD))19.60 (3.05)19.55 (2.76)0.791 Sex (Girl)219 (51.7)235 (55.4)0.302 Height (mean (SD))164.82 (7.68)165.16 (7.75)0.526 Puberty score (mean (SD))2.45 (0.75)2.40 (0.76)0.281Significance threshold ≤ 0.05. Significant estimates are represented in boldN* sample size, SD standard deviation, SK-BMD skull bone mineral density, sPMI superior panoramic mandibular index, MI mental index, BMI body mass index*Count percentage
Discussion
This report demonstrates the association between mandibular cortical thickness (sPMI and MI) and SK-BMD in a healthy peripubertal population. These findings were confirmed in an unconfounded setting, by accounting for various confounders in the model and by using an MR framework underlying the PGS distribution. Individuals in the lower quintile of the SK-BMD wPGS distribution had lower measurements for SK-BMD, sPMI and MI.
The clinical relevance of SK-BMD is two-fold. First, it captures the individual genetic potential for skeletal development more effectively than BMD measurements at weight-bearing skeletal sites, which are more influenced by environmental factors [14, 29]. Second, SK-BMD is strongly correlated with BMD at clinically relevant sites, such as the lumbar spine [15]. Thus, individuals predisposed to low peak bone mass may be identified through DPR examination. Clinical guidelines for this approach and clinical cutoffs for mandibular cortical thickness have been established for adults [30]. However, evaluating bone mass in childhood and adolescence provides an opportunity to intervene and reduce the elevated risk of a clinically significant fracture in the future [31]. Early intervention could be more beneficial, with adequate nutrition and weight-bearing exercise showing the strongest evidence of benefit [32].
The MR framework confirmed the unconfounded association between SK-BMD and mandibular cortical thickness. SK-BMD, sPMI and MI were significantly different between quintiles, unlike other measured parameters. These findings may be explained by a shared biological background. Genetic variants linked to SK-BMD may influence craniofacial development. For example, EN1 gene expression is associated with femoral cortical thickness, SK-BMD and craniosynostosis [33]. Additionally, a SMAD9 mutation reduces bone morphogenetic protein (BMP) inhibition, increasing osteoblast activity and results in mandible enlargement [34]. Future studies should explore the genetic mechanisms underlying this association.
Several individual characteristics significantly affected mandibular cortical thickness. Children of sub-Saharan African background had higher sPMI and MI, which is consistent with a previous study reporting greater cortical thickness at several skeletal sites in African–American young adults [35]. Genetic variation related to migration background partly explains these differences [36]. Importantly, correction for migration background did not affect the association between mandibular cortical thickness and skull BMD, making our findings generalizable to children from diverse backgrounds. BMI, which is associated with higher BMD in weight-bearing sites, was positively associated with sPMI and MI, suggesting a systemic effect on bone metabolism [37]. This association has been previously reported for overweight and obese children [38]. Previous studies have shown that boys have significantly thicker mandibular cortices than girls, but that such sexual dimorphism can be masked by pubertal status [39, 40]. In this study, no differences in mandibular cortical thickness were observed between sexes after puberty score adjustment. As such, migration background, BMI and pubertal status must be considered during DPR assessment.
DPRs provide a broad view of the maxillomandibular area, making them the preferred method for general oral health assessment. In children, they are recommended during the transitional dentition phase, after the eruption of the first permanent tooth, and before the eruption of the third molars [41]. Therefore, DPRs are a frequently used diagnostic tool in pediatric dental evaluations. DPRs and other dental radiographs are so widely used that they represent 30% of all radiographic examinations. However, due to the low exposure to ionizing radiation, they contribute only 4% of the total collective effective radiation dose [42]. In addition, DPRs also have low cost compared to other imaging techniques and intraoral radiographs [43]. Besides dental and craniofacial conditions, we have demonstrated that DPRs can be used to detect low BMD in children. However, DPRs should not replace DXA scan evaluations but serve as an adjunct evaluation tool to identify high-risk children undergoing dental assessments who might otherwise remain undetected.
A limitation of this study was the underrepresentation of other migration backgrounds, as the sample consisted mostly of European children. Future studies should investigate other confounders, such as physical activity or diet. The MR framework was ancestral background specific to avoid population stratification issues. Since the GWAS results were derived from a sample of mostly European individuals (85%), our analyses included only those of European ancestry. Additionally, DPR use has disadvantages such as distortion of three-dimensional structures and lower resolution, compared to other dental radiograph modalities [44]. Moreover, clinical cutoffs for low mandibular cortical thickness in children have yet to be established. However, given their accessibility, we aimed to contribute to validating DPRs as an evaluation tool.
Here we described an association between SK-BMD and mandibular cortical thickness as well as the determinants of mandibular cortical thickness in healthy children. A notable strength of this study was the application of a MR framework to analyze the significant association of these traits within an observational context. We suggest that DPRs may serve as a tool for identifying children with low BMD.
Supplementary Information
Below is the link to the electronic supplementary material.
Supplementary Material 1