Comparison of machine learning models for hemoglobin prediction in patients undergoing maintenance hemodialysis
Ting Xie, Xiaoyan Su, Chen Yun, Xiaohong Tang, Xuejia Zheng, Jingjing Dong, Qi Guo, Shouping Zhu, Donge Tang, Yong Dai, Lianghong Yin

TL;DR
This study compares machine learning models to predict hemoglobin levels in hemodialysis patients, finding that a neural network model performs best.
Contribution
The study introduces a comparison of eight ML models for hemoglobin prediction in hemodialysis patients using real-world clinical data.
Findings
The Multilayer Perceptron model achieved the highest performance with an R² of 0.672.
The most recent hemoglobin value was identified as the strongest predictor of future levels.
ML models using patient data can help identify anemia risk early in hemodialysis patients.
Abstract
To estimate the next hemoglobin (Hb) levels in maintenance hemodialysis (MHD) patients, predictive models were developed using various Machine Learning (ML) algorithms. A total of 8,159 records from 2,104 MHD patients across 24 blood purification centers in Shenzhen were included. Eight ML algorithms were employed to develop prediction models: Linear Regression (LR), Least Absolute Shrinkage and Selection Operator (Lasso), Bayesian Ridge, Gradient Boosting (XGBoost), Random Forest (RF), Support Vector Machine (SVM), Multilayer Perceptron (MLP), and Long Short-Term Memory (LSTM). Subsequently, the performance of models was evaluated and compared. Among all the models, the MLP performed the best performance, with an R 2 of 0.672, a mean absolute error (MAE) of 9.360 g/L, and a root mean square error (RMSE) of 12.438 g/L. The analysis indicated that the most recent Hb value (Hb(t-1)) was…
Genes, proteins, chemicals, diseases, species, mutations and cell lines named across the full text — each resolved to its canonical identifier and authoritative record.
Click any figure to enlarge with its caption.
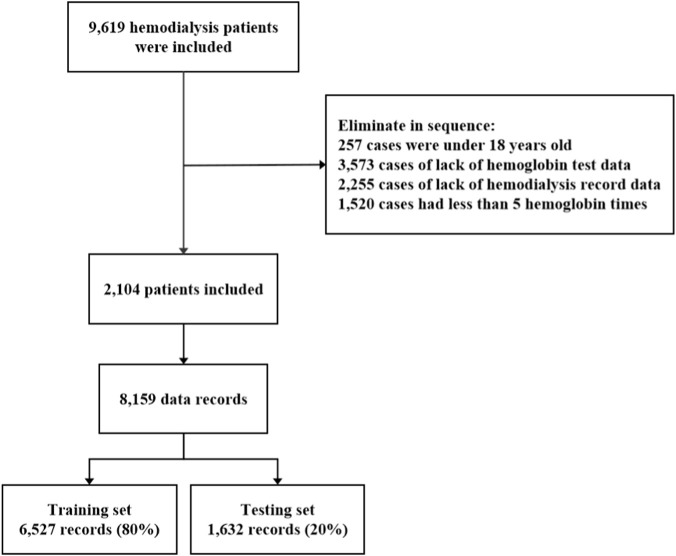 FIGURE 1
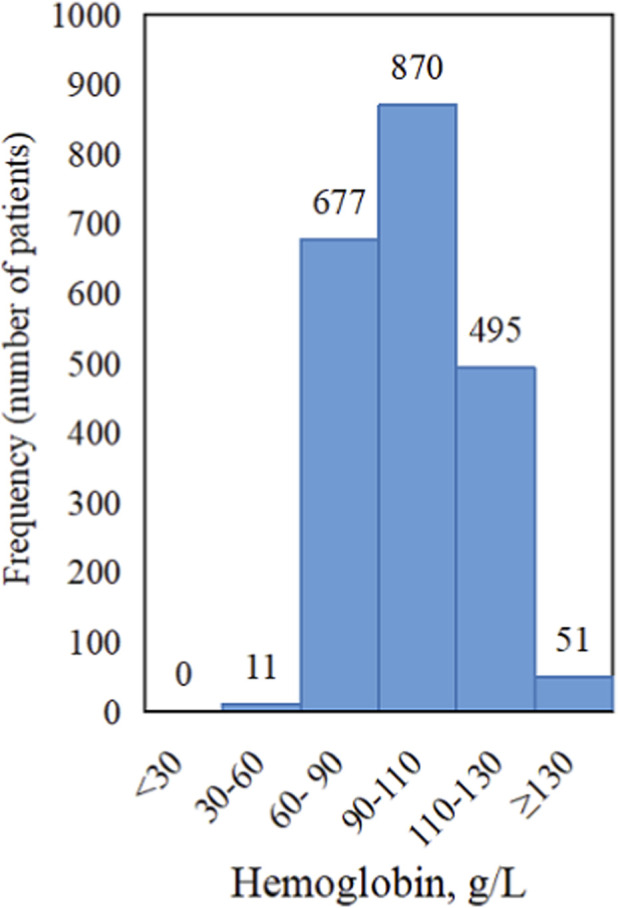 FIGURE 2
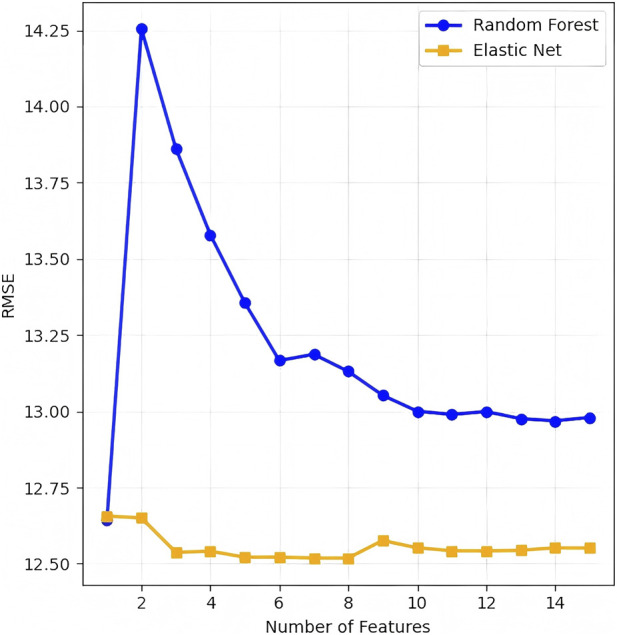 FIGURE 3
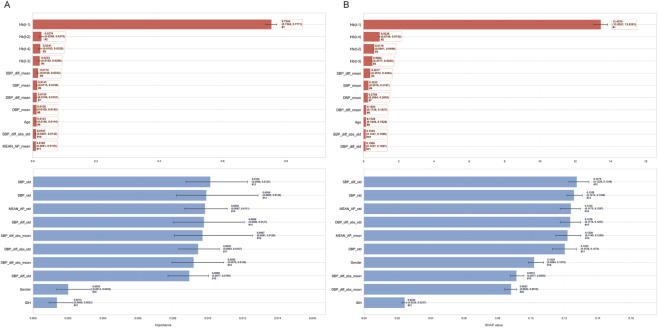 FIGURE 4
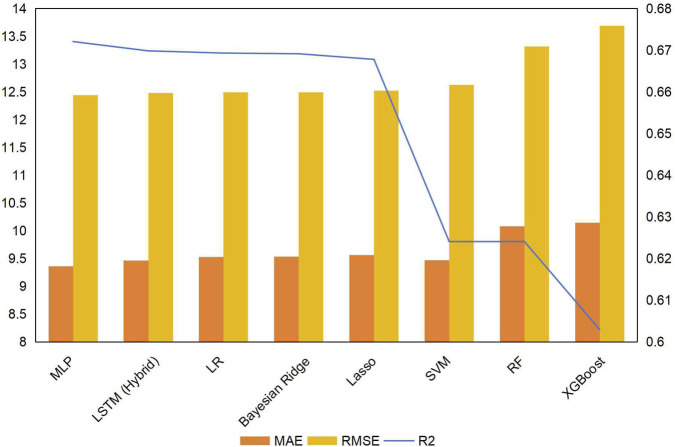 FIGURE 5
| Features | Definition | Value |
|---|---|---|
| Age | Age | Quantitative value |
| Gender | Gender | Male = 1; female = 0 |
| SBP_mean | Mean of systolic blood pressure | Quantitative value |
| SBP_std | Standard deviation of SBP | Quantitative value |
| SBP_diff_abs_mean | Absolute mean of SBP variation | Quantitative value |
| SBP_diff_abs_std | Absolute standard deviation of SBP variation | Quantitative value |
| SBP_diff_mean | Mean of SBP variation | Quantitative value |
| SBP_diff_std | Standard deviation of SBP variation | Quantitative value |
| DBP_mean | Mean of diastolic blood pressure | Quantitative value |
| DBP_std | Standard deviation of DBP | Quantitative value |
| DBP_diff_abs_mean | Absolute mean of DBP variation | Quantitative value |
| DBP_diff_abs_std | Absolute standard deviation of DBP variation | Quantitative value |
| DBP_diff_mean | Mean of SBP variation | Quantitative value |
| DBP_diff_std | Standard deviation of SBP variation | Quantitative value |
| MEAN_AP_mean | Mean of mean arterial pressure | Quantitative value |
| MEAN_AP_std | Standard deviation of mean arterial pressure | Quantitative value |
| IDH | Intradialytic hypotension | exist = 1; no = 0 |
| Hb(t-4) | Prior Hb of Hb (t-3) | Quantitative value |
| Hb(t-3) | Prior Hb of Hb (t-2) | Quantitative value |
| Hb(t-2) | Prior Hb of Hb (t-1) | Quantitative value |
| Hb(t-1) | Prior Hb of Hb(t) | Quantitative value |
| Hb(t) | Target Hb | Quantitative value |
| Features | Data record (n = 8159) |
|---|---|
| Age (year) | 54.02 ± 16.16 |
| Male (n, %) | 4871, 59.70% |
| SBP_mean (mmHg) | 142.12 ± 24.26 |
| SBP_std (mmHg) | 10.40 ± 6.56 |
| SBP_diff_abs_mean (mmHg) | 11.09 ± 7.43 |
| SBP_diff_abs_std (mmHg) | 6.84 ± 5.44 |
| SBP_diff_mean (mmHg) | 1.09 ± 6.39 |
| SBP_diff_std (mmHg) | 11.75 ± 8.64 |
| DBP_mean (mmHg) | 80.85 ± 15.61 |
| DBP_std (mmHg) | 6.02 ± 7.90 |
| DBP_diff_abs_mean (mmHg) | 6.71 ± 10.73 |
| DBP_diff_abs_std (mmHg) | 4.24 ± 7.60 |
| DBP_diff_mean (mmHg) | 0.05 ± 7.23 |
| DBP_diff_std (mmHg) | 7.23 ± 11.45 |
| MEAN_AP_mean (mmHg) | 101.27 ± 16.86 |
| MEAN_AP_std (mmHg) | 6.80 ± 6.23 |
| IDH (1, %) | 2256, 27.65% |
| Hb(t-4) (g/L) | 96.25 ± 22.26 |
| Hb(t-3) (g/L) | 96.76 ± 22.18 |
| Hb(t-2) (g/L) | 97.38 ± 21.81 |
| Hb(t-1) (g/L) | 98.07 ± 21.50 |
| Hb(t) (g/L) | 98.69 ± 21.80 |
| Models |
| MAE | RMSE | Comparison with MLP |
|---|---|---|---|---|
| MLP | 0.672053 | 9.360747 | 12.438173 | - |
| LSTM (Hybrid) | 0.669824 | 9.464916 | 12.480358 | 0.006446 |
| LR | 0.669291 | 9.526813 | 12.490429 | 0.001586 |
| Bayesian Ridge | 0.669124 | 9.532605 | 12.493586 | 0.001727 |
| Lasso | 0.667777 | 9.563647 | 12.518990 | 0.003220 |
| SVM | 0.624077 | 9.470317 | 12.625002 | 0.003840 |
| RF | 0.624077 | 10.080685 | 13.316931 | 0.000295 |
| XGBoost | 0.602982 | 10.142349 | 13.685471 | 0.000556 |
| Models |
| MAE | RMSE |
|---|---|---|---|
| LR | 0.669374 | 9.511276 | 12.488872 |
| Bayesian Ridge | 0.667977 | 9.539164 | 12.515222 |
| Lasso | 0.665798 | 9.563185 | 12.556220 |
| LSTM (Hybrid) | 0.655486 | 9.552188 | 12.748474 |
| RF | 0.647083 | 9.687298 | 12.903015 |
| SVM | 0.646450 | 9.821718 | 12.914571 |
| XGBoost | 0.595570 | 10.390483 | 13.812622 |
| MLP | 0.106594 | 10.145912 | 20.529531 |
Peer Reviews
No public reviews on file for this paper yet. If you reviewed it on a platform where reviews are public (OpenReview, ICLR, NeurIPS, ICML), you can paste yours below so the community can read it here.
Videos
No videos yet. Explain this paper in a talk, walkthrough, or lecture? Add one.
Taxonomy
TopicsErythropoietin and Anemia Treatment · Dialysis and Renal Disease Management · Iron Metabolism and Disorders
Introduction
1
End stage renal disease (ESRD) is a global public health issue and imposes a large disease burden (Ke et al., 2022). The Global Burden of Disease study estimated the global prevalence of individuals undergoing dialysis to be approximately 3.57 million in 2023 (Collaborators, 2025). As the main renal replacement therapy for ESRD, maintenance hemodialysis (MHD) was used by about 1.027 million patients in China by the end of 2024.
Patients with ESRD often experience renal anemia (RA), with an anemia rate up to 90% (Shen et al., 2021). Numerous studies have shown that RA in MHD patients is associated with various adverse outcomes, such as rapid deterioration of renal function, adverse cardiovascular events, and decline in health-related quality of life (Yang et al., 2020; Toft et al., 2020; Alshogran et al., 2021; Spinowitz et al., 2019). Effective anemia management is thus crucial to improving the prognosis and quality of life in patients receiving MHD.
Machine Learning (ML) is a branch of Artificial intelligence that completes specified tasks through data learning (Borhani et al., 2022). The application of ML in MHD patients is increasing, including the prediction of essential parameters (e.g., blood pressure, dry weight, Kt/V) and the risk of complications such as anemia and mortality (Li et al., 2025; Kim H. R. et al., 2021; Kim H. W. et al., 2021; Kang et al., 2024; Shu et al., 2025). The application of the Anemia Control Model tailored hemoglobin (Hb) target regulation, and was significantly correlated with a lower hospitalization risk in hemodialysis patients (Barbieri et al., 2016; Garbelli et al., 2024). However, existing prediction models are often challenged by inadequate multi-center data standardization and the absence of key clinical variables, which limits their generalizability and clinical applicability.
This study involved the development and comparative evaluation of ML models to predict the next Hb levels in a cohort of MHD patients, utilizing routinely collected data including longitudinal Hb records, dialysis parameters, and demographic characteristics to facilitate personalized anemia management.
Research methods
2
Data sources
2.1
This study collected 9,619 MHD patients from 44 blood purification centers in Shenzhen from 1 January 2001, to 20 April 2021. During dialysis, patients were dialyzed two or three times a week for 4 hours each time. Blood pressure was collected before, after, and every hour during each dialysis. We excluded patients younger than 18 years old, without Hb test data, hemodialysis record data, and Hb test times <5. Finally, 2104 MHD patients from 24 blood purification centers were included as the final research objects of this study. This study was approved by the Ethics Committee of Shenzhen People’s Hospital (LL-KY-2021, 870), Shenzhen, China.
Data preprocessing and feature selection
2.2
Hb(t-4), Hb(t-3), Hb(t-2), Hb(t-1), and Hb(t) from five consecutive tests at any time during dialysis were selected. Hb(t) was defined as the prediction target, namely, the Hb value of the next detection, and Hb at other times was used as the model features. Then the blood pressure from t-1 to t in dialysis records was processed to obtain new model features, where variation was defined as the difference between the actual value and the mean value. The patient’s age, gender, systolic blood pressure, diastolic blood pressure and their related features, as well as five consecutive Hb values, were recorded as one piece of data. To clarify, intervals between consecutive Hb measurements were variable (due to individualized follow-up schedules) and not incorporated into our data structure. Table 1 provided a detailed description of the definitions and assignment instructions for the included features. SPSS 23.0 statistical software was used for basic data analysis. The measurement data of normal distribution was described as mean ± standard deviation, and the counting data was described as number of cases and percentage. Detailed basic information of data record features were shown in Table 2.
Feature selection was performed based on the comparative results of root mean square error (RMSE) against the number of features for Random Forest (RF) and Elastic Net models. The predictive accuracy of candidate models was evaluated using RMSE, a key metric for Hb levels. After excluding Hb(t) as the prediction target, 21 candidate features were retained and utilized to develop all predictive models. Following the principle of minimizing prediction error, the combination of features with the lowest error rates were selected and subsequently incorporated into all ML models for Hb prediction.
Model selection and performance evaluation
2.3
We assessed and compared the performance of multiple modeling algorithms, including linear models (Linear Regression (LR), Least Absolute Shrinkage and Selection Operator (Lasso), and Bayesian Ridge), ensemble methods (such as Gradient Boosting (XGBoost) and RF), high-dimensional or nonlinear models (e.g., Support Vector Machine (SVM)), and deep learning architectures (including Multilayer Perceptron (MLP) and Long Short-Term Memory (LSTM)). Data analysis was conducted using the ML algorithm library Scikit-learn 1.0.2 implemented in Python (Pedregosa et al., 2011). Model transparency was presented in Supplementary Material.
To ensure the reliability of model performance estimation, the dataset was partitioned via a stratified 80:20 hold-out split into a training subset and an independent test subset. Hyperparameter tuning was conducted using five-fold cross-validation restricted to the training subset, thereby avoiding data leakage between the training and test partitions. The generalization ability of the final tuned model was assessed on the independent test set using the coefficient of determination (R ^2^), mean absolute error (MAE), and RMSE. RMSE was set as the primary evaluation metric. The benchmark model was defined as the one with the lowest RMSE. To compare the predictive performance of all models with that of the benchmark model, the normality of RMSE differences was first assessed via the Shapiro-Wilk test. Paired t-tests with Bonferroni correction were applied for pairwise comparisons if the RMSE differences conformed to a normal distribution; otherwise, the Wilcoxon signed-rank test was employed.
Results
3
Basic information
3.1
We enrolled 2,104 MHD patients from 24 blood purification centers in Shenzhen, resulting in a final dataset of 8,159 records (Figure 1). The average age of patients participating in the study was 54.02 ± 16.16 years old, and male accounted for 59.70%. The mean Hb level during the observation period was 97.97 ± 16.70 g/L, with the majority of patients exhibiting values within the range of 60–130 g/L (Figure 2). The detailed information of the features in the data record was shown in Table 2.
Flowchart of patient enrollment, screening, and dataset partitioning. Among 9,619 patients initially assessed, 2,104 were eligible for inclusion, generating 8,159 records that were allocated to training (80%) and test (20%) datasets.
Frequency distribution of hemoglobin (Hb) levels in the study population (n = 2,104). The majority of observations were within the range of 60–130 g/L.
Feature selection and SHAP analysis
3.2
Based on the patterns of RMSE in relation to the number of features for the RF and Elastic Net models, the RMSE values of both models reached or approached their minimum levels when the feature number was set to 6 (Figure 3). The top 6 predictors identified by the RF model were as follows: Hb(t-1), Hb(t-2), Hb(t-4), Hb(t-3), SBP_diff mean, and SBP mean (Figure 4A). These selected features were defined as the final predictive feature set and incorporated into all subsequent ML models for Hb levels prediction. The top 6 features identified by SHAP analysis were fully consistent with the top 6 features ranked by RF feature importance, reinforcing that these covariates were the most critical drivers of Hb levels prediction (Figure 4B).
Feature selection optimization. Root mean square error (RMSE) values for the Random Forest and Elastic Net models demonstrated that optimal model performance plateaus at 6 features.
Model interpretability analysis (A) Feature importance ranking based on Random Forest and (B) SHAP values identifying Hb(t-1) and SBP parameters as the strongest predictors.
Model performance comparison
3.3
Using the top 6 features as input, we built 8 ML models with their respective algorithms. R ^2^, MAE, and RMSE, as performance evaluation indexes of prediction models were shown in Table 3 and Figure 5. The MLP model achieved the highest R ^2^ value and the lowest MAE and RMSE among all candidate models. Statistical analysis using paired t-tests with Bonferroni correction further confirmed that the MLP model exhibited significantly superior predictive accuracy compared to all other models (P < 0.05), based on differences in RMSE. These findings collectively indicated that the MLP model demonstrated superior accuracy and clinical applicability for predicting Hb levels in MHD patients.
Performance comparison of eight machine learning models. The Multilayer Perceptron (MLP) model achieved significantly superior predictive performance, with a coefficient of determination (R 2) of 0.672 and a root mean square error (RMSE) of 12.438.
To verify whether the models outperform simple linear fitting and avoid overestimating performance caused by the autoregressive effect of Hb(t−1), we constructed an LR model using the same features. Compared with LR, MLP achieved an R ^2^ of 0.672, demonstrating a slight but stable improvement. This result indicated that beyond the strong autoregressive effect of Hb(t−1), MLP could capture the subtle non-linear associations between features and Hb levels that cannot be resolved by linear fitting.
In addition, the predictive performance of all models was evaluated using the full feature set for comparison (Table 4). Our results demonstrated that predictive performance was consistently improved across all models when using the top 6 features, relative to the complete feature set.
Discussion
4
Traditional statistics primarily aims to characterize relationships between data and outcome features through statistical inference, typically utilizing complete datasets for this purpose. In contrast, ML focuses on achieving precise predictions by optimizing model performance on independent test datasets, without requiring prior assumptions about functional relationships between predictors (X) and outcome (Y). This methodology systematically divides the dataset into training and test subsets, specifically designated for model development and validation purposes, respectively.
This study utilized a comprehensive dataset collected from 24 blood purification centers to develop prediction models for the next Hb levels in MHD patients. The MLP model achieved superior predictive accuracy in our analysis, which aligned with previous research employing ML for Hb prediction in similar patient populations (Martinez-Martinez et al., 2014; Barbieri et al., 2015).
Consistent with previous finding (Martinez-Martinez et al., 2014), the most recent Hb value Hb(t-1) was identified as the strongest predictor of Hb(t), with importance significantly outperforming other clinical and demographic features. In patients undergoing regular MHD without acute blood loss, Hb levels generally remain stable over the lifespan of red blood cells and more directly reflect the current hematologic status. In contrast, earlier historical values (e.g., Hb(t-2) to Hb(t-4)) demonstrate diminished predictive power as they may exceed this physiological timeframe. Furthermore, studies have shown that the Hb level of patients with RA gradually increases over time after treatment (Coyne et al., 2022). Since Hb(t-1) is the measurement value that is closest to the target detection time and within the lifespan of red blood cells, it can more effectively reflect the cumulative effect of continuous treatment. Therefore, compared with other previous Hb values, Hb(t-1) has greater predictive value.
The present study demonstrated that blood pressure-related parameters (SBP_diff mean, and SBP mean) hold significant predictive value for Hb levels. Although the current observational predictive model data has not yet been confirmed, these associations may have reasonable physiological pathways as a basis. However, there are still only hypotheses that need to be evaluated. Higher blood pressure variability may induce compensatory erythropoiesis via vascular remodeling and subsequent tissue hypoxia (Intengan and Schiffrin, 2001; D’Alessandro and Xia, 2020), while hypertension can indirectly exacerbate anemia by triggering renal inflammation and fibrosis—pathological processes that impair erythropoietin synthesis and upregulate hepcidin expression (Cui et al., 2017). Collectively, these observations indicate that blood pressure parameters are correlated with Hb levels through the aforementioned mechanistic pathways, and the predictive value of such parameters in our machine learning models is thus underpinned by a well-established clinicopathological rationale.
Notably, age and gender were not included in the final predictive feature set, as they ranked low in feature importance and their independent contribution to Hb levels prediction was significantly weaker than that of historical hemoglobin values and blood pressure-related parameters; their incorporation would not effectively improve the predictive performance of the model. This finding was consistent with the clinical characteristics of the MHD population, in which the inherent physiological effects of age and gender on Hb levels are masked by strong clinical interventions, including regular dialysis and standardized management of renal anemia, thus reducing their relative predictive value in this specific cohort.
The innovative aspect of this study lies in its development and systematic benchmarking of eight distinct ML algorithms for predicting subsequent Hb levels in MHD patients, utilizing a large-scale, multi-center clinical dataset from 24 blood purification centers. Contrasting with previous studies limited to single-center data or restricted features selection, our approach integrated longitudinal dialysis records with multi-timepoint laboratory data, which significantly improved the generalization ability and clinical application potential of the model, and provided a reliable data-driven tool for individualized anemia management.
This study has several limitations. First, as an observational investigation, it cannot establish causal relationships between the selected features and Hb levels; future cohort or experimental studies are needed to elucidate the underlying mechanisms. Second, this study did not conduct subgroup analysis. Subsequent work can reduce population heterogeneity through grouping to enhance the reliability of the conclusion. Another limitation of this study is that the variable time interval for Hb measurements may compromise the interpretability and reproducibility of the models. Furthermore, the lack of external/temporal validation in this study may have weakened the broad applicability of the model. In addition, due to the inconsistent progress and standards of electronic information system construction among various blood purification centers, some early data were recorded in paper form, resulting in limited scale and insufficient completeness of electronic data, such as the lack of detailed medication records, blood transfusion history, iron metabolism indicators, and dialysis doses and other key features. After the information system is improved, more features can be incorporated to optimize the model’s prediction performance.
Conclusion
5
This study demonstrated that demographic characteristics, dialysis treatment records, and historical Hb data serve as effective predictors of Hb levels in maintenance MHD patients. Among all evaluated ML models, the MLP exhibited optimal performance. Our research provides a novel perspective on anemia management strategies from a non-pharmacological intervention standpoint, although its clinical applicability requires further validation. Notably, the early prediction of Hb levels using ML models enables clinicians to assess patients’ anemia status ahead of routine blood tests. This not only provides a theoretical basis for improving the individualized and precise management of anemia in dialysis patients but also creates practical possibilities for improving the long-term prognosis of patients.
The reference list from the paper itself. Each links out to its DOI / PubMed record.
- 1Alshogran O. Y. Shatnawi E. A. Altawalbeh S. M. Jarab A. S. Farah R. I. (2021). Predictors of poor health-related quality of life among hemodialysis patients with anemia in Jordan. Health Qual. Life Outcomes 19 (1), 272. 10.1186/s 12955-021-01905-7 34952599 PMC 8709968 · doi ↗ · pubmed ↗
- 2Barbieri C. Mari F. Stopper A. Gatti E. Escandell-Montero P. Martinez-Martinez J. M. (2015). A new machine learning approach for predicting the response to anemia treatment in a large cohort of end stage renal disease patients undergoing dialysis. Comput. Biol. Med. 61, 56–61. 10.1016/j.compbiomed.2015.03.019 25864164 · doi ↗ · pubmed ↗
- 3Barbieri C. Molina M. Ponce P. Tothova M. Cattinelli I. Ion T. J. (2016). An international observational study suggests that artificial intelligence for clinical decision support optimizes anemia management in hemodialysis patients. Kidney Int. 90 (2), 422–429. 10.1016/j.kint.2016.03.036 27262365 · doi ↗ · pubmed ↗
- 4Borhani S. Borhani R. Kajdacsy-Balla A. (2022). Artificial intelligence: a promising frontier in bladder cancer diagnosis and outcome prediction. Crit. Rev. Oncol. Hematol. 171, 103601. 10.1016/j.critrevonc.2022.103601 35065220 · doi ↗ · pubmed ↗
- 5Collaborators G. T. (2025). Global, regional, and national prevalence of kidney failure with replacement therapy and associated aetiologies, 1990-2023: a systematic analysis for the global burden of disease study 2023. Lancet Glob. Health 13 (8), e 1378–e 1395. 10.1016/S 2214-109X(25)00198-6 40712611 · doi ↗ · pubmed ↗
- 6Coyne D. W. Singh A. K. Lopes R. D. Bailey C. K. Di Mino T. L. Huang C. (2022). Three times weekly dosing of daprodustat versus conventional epoetin for treatment of anemia in hemodialysis patients: ASCEND-TD: a phase 3 randomized, double-blind, noninferiority trial. Clin. J. Am. Soc. Nephrol. 17 (9), 1325–1336. 10.2215/CJN.00550122 35918106 PMC 9625096 · doi ↗ · pubmed ↗
- 7Cui J. Wan J. You D. Zou Z. Chen Y. Li Z. (2017). Interstitial complement C 3 activation and macrophage infiltration in patients with hypertensive nephropathy. Clin. Nephrol. 88 (12), 328–337. 10.5414/CN 109154 28793954 · doi ↗ · pubmed ↗
- 8D'Alessandro A. Xia Y. (2020). Erythrocyte adaptive metabolic reprogramming under physiological and pathological hypoxia. Curr. Opin. Hematol. 27 (3), 155–162. 10.1097/MOH.0000000000000574 32141895 PMC 8900923 · doi ↗ · pubmed ↗