Association between vitamin D and serum uric acid in a large Chinese cohort of middle-aged and elderly Chinese men and women
Rong Cao, Bingchao Xu, Yubao Wang, Xinzheng Lu, Xianhui Qin, Xiaoshu Cheng, Guifan Sun, Jingang Yang, Ningling Sun, Gang Sun, Hui Shi, Han-Ping Shi, Liangdi Xie

TL;DR
This study finds that vitamin D levels are linked to uric acid in Chinese adults, with different patterns in men and women and across age groups.
Contribution
The study reveals sex- and age-specific nonlinear associations between vitamin D and uric acid in a large Chinese cohort.
Findings
Vitamin D deficiency and insufficiency were common in the study population.
Younger men showed an inverse J-shaped relationship between vitamin D and uric acid.
Women showed a consistent positive linear relationship between vitamin D and uric acid.
Abstract
Vitamin D is essential for calcium homeostasis, bone health, and immune function, yet its association with serum uric acid (UA) remains uncertain. This study evaluates vitamin D status in Chinese adults and explores its sex- and age-specific relationships with UA and hyperuricemia (HUA). We conducted a cross-sectional analysis of 15,116 males and 25,895 females from The China Precision Nutrition and Health KAP Real World Study (CPNAS). Restricted cubic spline (RCS) visualized dose-response relationships, while multivariate regression assessed associations between vitamin D and UA/HUA. Subgroup analyses (age < 70 vs. ≥70, male vs. female) explored potential variations. The study revealed a high prevalence of vitamin D deficiency (33.5%) and insufficiency (53%) in Chinese adults. Among males under 70 years, we observed an inverse J-shaped relationship between vitamin D and serum UA…
Genes, proteins, chemicals, diseases, species, mutations and cell lines named across the full text — each resolved to its canonical identifier and authoritative record.
Click any figure to enlarge with its caption.
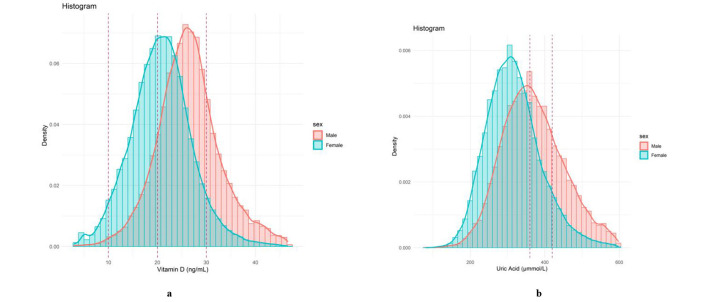 Figure 1
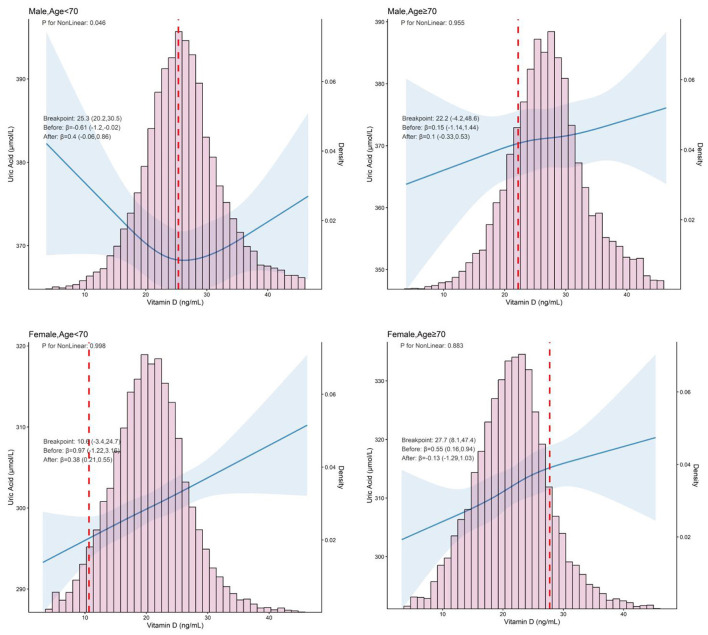 Figure 2
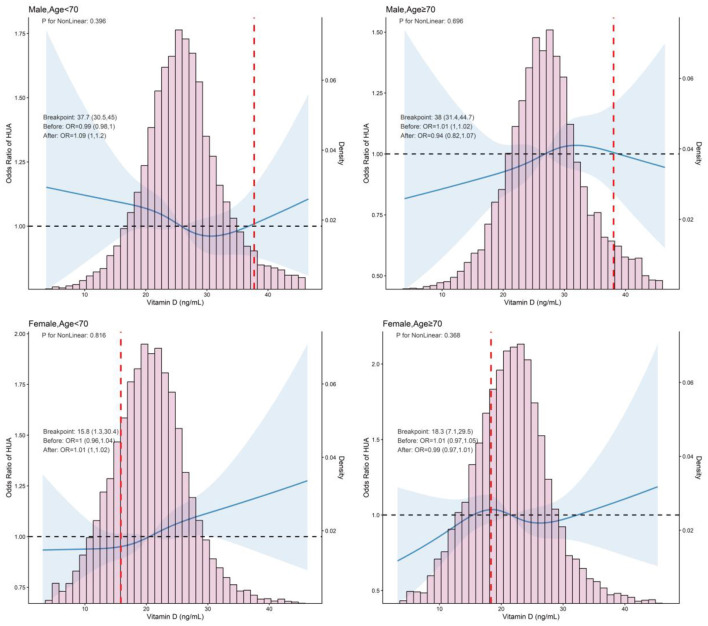 Figure 3
|
|
|
|
|
|
|---|---|---|---|---|
| Age (years)a | 65.4 (58.1, 71.5) | 67.3 (59.8, 73.1) | 64.0 (57.4, 70.3) | < 0.001 |
| BMI (kg/m2)a | 25.6 (23.2, 28.0) | 24.9 (22.6, 27.3) | 25.9 (23.6, 28.5) | < 0.001 |
| < 0.001 | ||||
| Current | 6,716 (16.40) | 6,542 (43.30) | 174 (0.70) | |
| Quit | 2,889 (7.00) | 2,848 (18.80) | 41 (0.20) | |
| Never smoked or otherwise | 31,377 (76.60) | 5,722 (37.90) | 25,655 (99.20) | |
| < 0.001 | ||||
| Never | 30,419 (74.40) | 5,960 (39.50) | 24,459 (94.7) | |
| Current | 9,232 (22.60) | 7,974 (52.80) | 1,258 (4.90) | |
| Abstinence or others | 1,260 (3.10) | 1,155 (7.70) | 105 (0.40) | |
| 0.026 | ||||
| No | 19,158 (46.9) | 7,179 (47.6) | 11,979 (46.5) | |
| Yes | 21,716 (53.1) | 7,906 (52.4) | 13,810 (53.5) | |
| < 0.001 | ||||
| No | 34,098 (84.0) | 12,705 (84.9) | 21,393 (83.5) | |
| Yes | 6,484 (16.0) | 2,259 (15.1) | 4,225 (16.5) | |
| < 0.001 | ||||
| No | 23,450 (57.3) | 10,283 (68.1) | 13,167 (51.0) | |
| Yes | 17,461 (42.7) | 4,813 (31.9) | 12,648 (49.0) | |
| < 0.001 | ||||
| No | 33,387 (81.6) | 10,917 (72.3) | 22,470 (87.0) | |
| Yes | 7,548 (18.4) | 4,184 (27.7) | 3,364 (13.0) | |
| CREA (μmol/L)a | 63.0 (56.0, 72.0) | 71.0 (64.0, 80.0) | 59.0 (53.0, 65.0) | < 0.001 |
| SBP (mmHg)a | 137.7 (125.0, 151.7) | 136.7 (124.7, 149.7) | 138.7 (125.3, 152.3) | < 0.001 |
| DBP (mmHg)a | 81.0 (74.3, 88.0) | 82.3 (75.3, 89.7) | 80.3 (73.7, 87.3) | < 0.001 |
| HR (beats/min)a | 73.3 (66.7, 81.3) | 72.0 (64.7, 80.3) | 74.0 (67.7, 81.7) | < 0.001 |
| GLU (mmol/L)a | 5.40 (5.00, 6.00) | 5.40 (5.00, 6.00) | 5.40 (5.00, 6.00) | 0.923 |
| TG (mmol/L)a | 1.40 (1.00, 2.10) | 1.20 (0.90, 1.80) | 1.60 (1.10, 2.20) | < 0.001 |
| TC (mmol/L)a | 5.50 (4.80, 6.20) | 5.20 (4.60, 5.90) | 5.60 (4.90, 6.40) | < 0.001 |
| LDL-C (mmol/L)a | 3.20 (2.70, 3.70) | 3.00 (2.60, 3.50) | 3.30 (2.80, 3.90) | < 0.001 |
| UA (μmol/L)a | 328.0 (279.0, 385.0) | 363.0 (310.0, 422.0) | 311.0 (266.0, 359.0) | < 0.001 |
| Vitamin D (ng/ml)a | 22.7 (18.4, 27.0) | 26.2 (22.4, 30.1) | 20.8 (16.8, 24.6) | < 0.001 |
| < 0.001 | ||||
| Deficiency | 13,720 (33.5) | 2,115 (14.0) | 11,605 (44.8) | |
| Insufficiency | 21,751 (53.0) | 9,188 (60.8) | 12,563 (48.5) | |
| Sufficiency | 5,540 (13.5) | 3,813 (25.2) | 1,727 (6.7) |
|
|
|
|
|
| ||||||||
|---|---|---|---|---|---|---|---|---|---|---|---|---|
| < | ≥ | |||||||||||
| M1 [β (95% CI)] | 4.18 (2.74, 5.62) | 0 (Ref) | 2.98 (0.45, 5.51) | 5.02 (2.49, 7.55) | 6.41 (3.88, 8.94) | < 0.001 | 0.004 | Ref | 3.31 (1.45, 5.16) | 6.69 (2.98, 10.40) | < 0.001 | 0.004 |
| M2 [β (95% CI)] | 4.06 (.2.72, 5.41) | 0 (Ref) | 2.66 (0.32, 5.01) | 4.16 (1.82, 6.50) | 6.32 (3.97, 8.67) | < 0.001 | 0.004 | Ref | 3.27 (1.56, 4.99) | 6.71 (3.24, 10.18) | < 0.001 | 0.004 |
| < | ≥ | |||||||||||
| M1 [β (95% CI)] | 0.60 (−1.43, 2.64) | Ref | −1.73 (−5.46, 1.99) | −2.13 (−5.86, 1.59) | 0.22 (−3.51, 3.94) | 0.967 | 0.967 | Ref | −2.00 (−5.91, 1.90) | −0.12 (−4.51, 4.26) | 0.793 | 0.793 |
| M2 [β (95% CI)] | 0.04 (−1.83, 1.92) | Ref | −1.57 (−4.99, 1.85) | −1.75 (−5.17, 1.67) | −0.39 (−3.82, 3.05) | 0.807 | 0.807 | Ref | −2.29 (−5.89, 1.30) | −1.22 (−5.28, 2.83) | 0.759 | 0.759 |
| < | ≥ | |||||||||||
| M1 [β (95% CI)] | −0.27 (−2.8, 2.3) | Ref | −5.61 (−10.35, −0.86) | −4.21 (−8.94, 0.53) | −1.75 (−6.49, 2.99) | 0.613 | 0.817 | Ref | −4.21 (−9.02, 0.60) | −1.65 (−7.17, 3.88) | 0.793 | 0.793 |
| M2 [β (95% CI)] | −0.50 (–.2.9, 1.9) | Ref | −5.40 (−9.82, −0.99) | −3.31 (−7.73, 1.10) | −1.31 (−5.73, 3.11) | 0.798 | 0.807 | Ref | −4.65 (−9.14, −0.16) | −2.11 (−7.27, 3.06) | 0.664 | 0.759 |
| < | ≥ | |||||||||||
| M1 [β (95% CI)] | 3.71 (0.41, 7.01) | Ref | −2.09 (−8.08, 3.89) | 3.92 (−2.06, 9.91) | 5.55 (−0.44, 11.53) | 0.019 | 0.038 | Ref | 3.84 (−2.82, 10.50) | 6.03 (−1.23, 13.30) | 0.110 | 0.220 |
| M2 [β (95% CI)] | 2.28 (−0.69, 5.25) | Ref | −0.25 (−5.60, 5.11) | 2.96 (−2.39, 8.32) | 3.33 (−2.05, 8.71) | 0.129 | 0.258 | Ref | 4.33 (−1.66, 10.31) | 3.94 (−2.60, 10.49) | 0.387 | 0.759 |
|
|
|
|
|
| ||||||||
|---|---|---|---|---|---|---|---|---|---|---|---|---|
|
| < | ≥ | ||||||||||
| M1 [β (95% CI)] | 1.01 (1.00, 1.01) | Ref | 1.05 (0.95, 1.17) | 1.09 (0.98, 1.20) | 1.09 (0.98, 1.20) | 0.091 | 0.196 | Ref | 1.04 (0.97, 1.12) | 1.11 (0.95, 1.28) | 0.134 | 0.294 |
| M2 [β (95% CI)] | 1.01 (1.00, 1.01) | Ref | 1.07 (0.96, 1.19) | 1.09 (0.98, 1.22) | 1.12 (1.00, 1.25) | 0.049 | 0.196 | Ref | 1.06 (0.98, 1.15) | 1.12 (0.95, 1.31) | 0.074 | 0.246 |
|
| < | ≥ | ||||||||||
| M1 [β (95% CI)] | 1.00 (0.99, 1.00) | Ref | 0.96 (0.87, 1.06) | 0.97 (0.87, 1.07) | 0.94 (0.85, 1.04) | 0.249 | 0.249 | Ref | 0.98 (0.88, 1.08) | 0.94 (0.84, 1.06) | 0.305 | 0.407 |
| M2 [β (95% CI)] | 1.00 (0.99, 1.00) | Ref | 0.96 (0.86, 1.08) | 0.99 (0.89, 1.11) | 0.94 (0.84, 1.05) | 0.281 | 0.281 | Ref | 0.98 (0.87, 1.10) | 0.93 (0.82, 1.06) | 0.249 | 0.332 |
| < | ≥ | |||||||||||
| M1 [β (95% CI)] | 1.00 (0.99, 1.00) | Ref | 0.91 (0.80, 1.03) | 0.91 (0.80, 1.03) | 0.89 (0.79, 1.01) | 0.098 | 0.196 | Ref | 0.94 (0.82, 1.06) | 0.90 (0.77, 1.04) | 0.147 | 0.294 |
| M2 [β (95% CI)] | 1.00 (0.99, 1.00) | Ref | 0.90 (0.79, 1.04) | 0.94 (0.82, 1.08) | 0.90 (0.79, 1.04) | 0.233 | 0.281 | Ref | 0.93 (0.81, 1.06) | 0.88 (0.75, 1.03) | 0.123 | 0.246 |
| < | ≥ | |||||||||||
| M1 [β (95% CI)] | 1.00 (1.00, 1.01) | Ref | 0.97 (0.82, 1.15) | 1.09 (0.92, 1.29) | 1.09 (0.92, 1.28) | 0.187 | 0.249 | Ref | 1.10 (0.91, 1.33) | 1.10 (0.90, 1.36) | 0.456 | 0.456 |
| M2 [β (95% CI)] | 1.01 (1.00, 1.02) | Ref | 1.04 (0.86, 1.25) | 1.14 (0.94, 1.37) | 1.11 (0.92, 1.34) | 0.180 | 0.281 | Ref | 1.16 (0.94, 1.44) | 1.14 (0.90, 1.43) | 0.460 | 0.460 |
- —Development and Reform Commission of Shenzhen Municipality10.13039/501100012228
Peer Reviews
No public reviews on file for this paper yet. If you reviewed it on a platform where reviews are public (OpenReview, ICLR, NeurIPS, ICML), you can paste yours below so the community can read it here.
Videos
No videos yet. Explain this paper in a talk, walkthrough, or lecture? Add one.
Taxonomy
TopicsGout, Hyperuricemia, Uric Acid · Vitamin D Research Studies · Thyroid Disorders and Treatments
Introduction
1
Uric acid (UA), the final metabolite of purine metabolism in humans, is commonly considered a metabolic waste product. However, numerous investigations have demonstrated that UA plays two distinct roles in oxidative stress: it can act as a pro-oxidant, causing damage through crystallization, as well as an anti-oxidant, providing protective effects (1). It is becoming increasingly clear that UA is not a biologically inert substance, but it has multiple biological functions. Serum UA levels are determined by the balance between its production and excretion. Any imbalances in this process can lead to abnormal UA levels, resulting in dysuricemia, which includs both hyperuricemia (HUA) and hypouricemia. HUA has been a major focus of research and concern in the past, as it can lead to clinical symptoms such as gout. In contrast, hypouricemia has long been neglected. Initially hypouricemia was regarded as a biochemical disorder with no clinical significance. However, recent studies of UA have revealed new insights, showed that hypouricemia is a pathological condition that increases the risk of several diseases, including chronic kidney disease (CKD) (2), dementia (3), and Parkinson disease (4). Therefore, it is crucial to acknowledge that both elevated and decreased UA levels can have adverse effects on the human body.
The role of vitamin D in regulating skeletal and mineral ion homeostasis is well established (5). Additionally, the presence of vitamin D receptor and vitamin D-metabolizing enzymes in nearly all human tissues suggests that vitamin D plays a widespread role in overall human health. Accumulating evidence also indicates that low vitamin D levels are associated with an increased risk of various common disorders, including cardiovascular disease (CVD) (6), malignant (7), type 2 diabetes mellitus (T2DM) (8), autoimmune diseases (9), high blood pressure, depression, and overall mortality (10). However, excessive vitamin D concentrations (>100 ng/ml), also known as vitamin D toxicity, can be detrimental. It may lead to hypercalciuria, which can result in acute kidney disease (AKD) and vascular calcification (11).
The need for data on the representational status and intake of vitamin D has been a focus of research for over a decade. Epidemiological studies have documented that the global prevalence of vitamin D levels < 25/30 and < 50 nmol/L ranges from approximately 5 to 18% and 24 to 49%, respectively (12). Notably, considering factors such as latitude, genetics, lifestyle, body composition, and dietary intake, the current vitamin D status in China remains unclear and requires further clarification. Given the crucial role of vitamin D and the importance of maintaining appropriate levels of UA for human health, the potential contribution of vitamin D to serum UA concentrations remains uncertain and warrants further investigation. The association between vitamin D and UA levels remains elusive in existing studies. Some studies have suggested that there is no relationship between vitamin D and serum UA (13, 14), however, other studies have indicated a link between vitamin D and UA levels, but the evidence is less clear and controversial. For example, some studies have found a positive linear correlation between vitamin D and serum UA (15–17), while other studies have found a negative correlation between vitamin D and HUA (18, 19), and several studies have found a non-linear relationship between vitamin D and serum UA/HUA (20, 21). Although none of these studies reported a sex and age-specific association between vitamin D and serum UA in detail. Thus, an updated relationship between vitamin D and UA among elder Chinese is critically needed. The primary objective of this study was to depict the association between vitamin D and UA. As serum UA levels are vary between the sexes (17) and vitamin D levels are vary in different ages (22), it is therefore important to take gender and age differences into account when exploring the relationship between vitamin D and UA, to provide clues and evidence for the application of precision nutrition in China (23, 24). We hypothesized that plasma 25(OH)D is associated with serum UA in Chinese adults and that this association differs significantly by sex and age.
Methods
2
Participants
2.1
The subjects were over 18 years old in Rongcheng, China, who participated in The China Precision Nutrition and Health KAP Real World Study (CPNAS; registration number: ChiCTR2100051983). CPNAS is a long-term, multi-center, prospective, observational, real-world study conducted in different regions of China. Detailed descriptions of CPNAS have been outlined in earlier publications. Each eligible participant achieved informed consent (25, 26).
A total of 41,011 participants from the CPNAS were enrolled in our study. Participants were excluded based on the following criteria: (1) taking Enalapril folic acid (n = 9,031); (2) taking vitamin D (n = 1,819); (3) taking multivitamins (n = 500); (4) taking multivitamins minerals (n = 220); and (5) missing data (on vitamin D, uric acid, or covariates) or having vitamin D or UA values outside 3 standard deviations (SD; n = 1,114).
Data collection
2.2
Age, sex, body mass index (BMI), medical history, personal history (smoking, drinking, hypertension, diabetes mellitus, and hyperlipidemia), vitamin D, UA, creatinine (CREA), glucose (GLU), triglyceride (TG), total cholesterol (TC), low-density lipoprotein cholesterol (LDL-C), systolic blood pressure (SBP), diastolic blood pressure (DBP), and heart rate (HR) of all participants were extracted from the CPNAS.
The measurement of vitamin D was performed using Liquid Chromatography-Tandem Mass Spectrometry (LC-MS/MS). Detailed methods for the LC-MS/MS measurements can be found in a previous publication (27). Vitamin D deficiency was defined as a vitamin D < 20 ng/ml, insufficiency as 20–30 ng/ml, and sufficiency as a vitamin D >30 ng/ml (28). HUA was defined as serum UA ≥420 μmol/L regardless of males or females (29). Hypertension (HTN) is diagnosed with any of the following: (1) previously diagnosed HTN; (2) taking hypertensive medication; (3) being informed by a licensed physician of hypertension or stated in the questionnaire to take prescribed medication for hypertension; and (4) measuring the participant's average SBP ≥140 mmHg and/(or) DBP ≥90 mmHg (30). Diabetes mellitus (DM) was diagnosed in subjects who met any of the following criteria: (1) previously diagnosed DM; (2) GLU ≥7.0 mmol/L; and (3) use of diabetes medication or insulin (31). The diagnostic criteria for hyperlipidemia are any of the following: (1) TC ≥6.19 mmol/L; (2) TG ≥2.3 mmol/L; (3) LDL-C ≥4.1 mmol/L; (4) previously diagnosed hyperlipidemia; and (5) use of lipid-lowering medication (32).
Statistical analysis
2.3
Normally distributed variables were expressed as mean ± standard deviation (SD), and abnormally distributed variables were shown as the median (interquartile range, IQR). Categorical data were expressed as numbers and percentage (n, %).
Restricted cubic spline (RCS) was used to visualize the dose-response relationship between vitamin D and serum UA. Subsequently, multivariate regression analysis was performed with UA/HUA as the dependent variable and vitamin D as the main independent variable. The vitamin D levels were modeled in quartiles (Q1, Q2, Q3, and Q4) categories (Q1, Q2-Q3, and Q4) and clinical cut-off values (< 20, 20–30, >30 ng/ml). Both the non-adjusted and multivariate-adjusted models were used. Model 1 was the crude model with no adjustments. Model 2 was adjusted for age, sex, BMI, smoking status, drinking status, HTN, DM, hyperlipidemia, and CREA. Model assumptions and fit were verified using residual plots, goodness-of-fit tests, and multicollinearity assessments (e.g., variance inflation factor, VIF; generalized variance inflation factor, GVIF). Finally, post hoc subgroup analyses (age < 70 vs. ≥70, male vs. female) were performed.
To verify the robustness of our findings, we performed sensitivity analyses by: (1) excluding participants with CKD; and (2) including participants taking vitamin D supplements (who were excluded from the primary analysis) to assess the potential influence of exogenous vitamin D intake. All P-values were 2-tailed. A P-value < 0.05 was considered statistically significant. All of the statistical analyses were performed with R statistical software, V1.7 (https://www.r-project.org).
Results
3
Baseline characteristics
3.1
A total of 41,011 participants were selected for the final data analysis, with a median age of 65.4 (58.1, 71.5) years, of which 63.1% were female (Table 1). As shown in Figure 1, males had higher levels of both vitamin D and serum UA compared to females. Among all participants, 33.5% had vitamin D deficiency, 53% had insufficiency, and 13.5% had sufficient vitamin D levels. In males, the prevalence of vitamin D deficiency, insufficiency, and sufficiency was 14.0, 60.8, and 25.2%, respectively. In females, these values were 44.8, 48.5, and 6.7%, respectively. The overall prevalence of HUA in our study was 18.4%, with 27.7% of man and 13% of women affected. Compared to female, male had higher vitamin D (26.2 vs. 20.8, P < 0.001) and serum UA (363.0 vs. 311.0, P < 0.001) levels. Furthermore, compared to females, males tended to be older, with lower BMI, TG, TC, LDL-C, SBP, DBP and HR, and with higher CREA, had a higher proportion of current smoking and drinking, and lower proportion of individuals with HTN, DM, and hyperlipidemia.
Distribution of vitamin D and serum UA by sex. (a) Distribution of vitamin D by sex; (b) distribution of serum UA by sex.
Association between vitamin D and serum UA
3.2
The RCS revealed an inverse J-shaped, non-linear dose-response relationship between vitamin D and serum UA in males, particularly in those younger than 70 years, This relationship was observed in both the non-adjusted (P-non-linear = 0.008) and an adjusted model (P-non-linear = 0.046). However, a positive linear relationship between vitamin D and serum UA in other groups (males and age ≥70 and females) in an adjusted model (Figure 2). The multivariate linear regression results for the association between vitamin D and serum UA are shown in Table 2 and Supplementary Table S3. Diagnostic plots and tests indicated that the regression models met the assumptions of linearity, normality of residuals, and homoscedasticity, with no evidence of significant multicollinearity (VIF, GVIF < 2; Supplementary Table S5). In males < 70 years, after adjusting all confounding factors, serum UA levels decreased with increasing vitamin D levels across different vitamin D categories and clinical cut-off values. Specifically, for participants with vitamin D levels between 22–25.8, 22–29.6, and 20–30 ng/ml, serum UA levels decreased as vitamin D increased (β = −5.40, 95% CI = −9.82, −0.99; P = 0.017; β = −4.36, 95% CI = −8.18, P = 0.026; β = −4.65, 95% CI = −9.14, −0.16, P = 0.042). The associations remained statistically significant after FDR correction. However, when vitamin D levels were ≥25.8, 29.6, and 30 ng/ml, no significant association was found between vitamin D and serum UA (P > 0.05 for all). In females, a significant positive linear relationship between vitamin D and serum UA was observed, regardless of whether vitamin D were treated as categorical variables (P all < 0.05) or as a continuous variable (per 10 ng/ml increment: β = 3.90, 95% CI: 2.30–5.40, P < 0.001). A similar trend was observed in the general population, where a significant positive correlation between vitamin D and serum UA was found. For the continuous variable, the relationship was also significant (per 10 ng/ml increment: β = 7.20, 95% CI: 6.10–8.20; P < 0.05 for all; Supplementary Table S1). Notably, the results remained consistent in sensitivity analyses after excluding participants with CKD or when including participants taking vitamin D supplements (Supplementary Tables S6–S23).
Restricted cubic spline analysis of the association between serum vitamin D and UA levels, stratified by sex and age (< 70 vs. ≥70 years). Adjusted age, sex, BMI, smoking, drinking, CREA, hyperlipidemia, HTN, and DM. BMI, body mass index; UA, uric acid; CREA, creatinine; HTN, hypertension; DM, diabetes mellitus.
Association between vitamin D and HUA
3.3
RCS between vitamin D and HUA revealed that there was an inverse J-shaped trend in the general population (P for non-linearity = 0.015), which was significant only in Model 1. In contrast, vitamin D and HUA were positively correlated linearly in both males and females (Figure 3). To further investigate the association between vitamin D and HUA, we performed a logistic regression analysis the results of which are presented in Table 3 and Supplementary Table S4. Model diagnostics indicated no significant multicollinearity among covariates (VIF, GVIF < 2) and adequate goodness-of-fit (Supplementary Table S5). When vitamin D was analyzed as a continuous variable, a significant positive correlation was found between vitamin D and HUA in both females and the general population (female, OR from 1.00 to 1.01, P < 0.05; general, OR from 1.01 to 1.01, P < 0.001). However, no significant correlation was observed between vitamin D and HUA in males. When vitamin D was analyzed as a categorical variable (quartile, three categories, or clinical cut-off values), a positive correlation between vitamin D levels and HUA was still present in the general population (P < 0.05), In contrast, no significant association was found between vitamin D and HUA in either males or females. Additionally, there was no difference in the relationship between vitamin D and HUA based on age stratification (age < 70, ≥70; Table 3, Supplementary Table S2). Sensitivity analyses, which excluded participants with CKD or included those taking vitamin D supplements, confirmed the robustness of these findings (Supplementary Tables S24–S40).
Restricted cubic spline analysis of the association between serum vitamin D and HUA, stratified by sex and age (< 70 vs. ≥70 years). Adjusted age, sex, BMI, smoking, drinking, CREA, hyperlipidemia, HTN, and DM. BMI, body mass index; UA, uric acid; CREA, creatinine; HTN, hypertension; DM, diabetes mellitus; HUA, hyperuricemia.
Discussion
4
Vitamin D deficiency (33.5%) and insufficiency (53%) were prevalent in this Chinese population, with men having a higher rate of insufficiency (60.8%) than women (48.5%). The relationship between vitamin D levels and serum UA varied by sex and age. In men under 70, an inverse J-shaped association was observed, with lower vitamin D linked to higher UA, attenuating at higher vitamin D levels. In women, a positive linear correlation between vitamin D and UA was seen, regardless of the variable type. Overall, the general population showed a pattern similar to women, indicating a broadly applicable positive linear relationship between vitamin D and UA. However, for HUA, while the general population exhibited an inverse J-shaped relationship, both genders displayed a positive linear trend, highlighting the differing effects of vitamin D on uric acid metabolism.
Several studies have explored the relationship between vitamin D and serum UA levels, revealing both complex and varied associations depending on population characteristics. Two meta-analyses (15, 33) found that vitamin D deficiency is linked to hyperuricemia. Similarly, an inverse U-shaped relationship was observed between vitamin D levels and serum UA, as well as the risk of elevated serum UA status, in a study involving 4,777 participants aged 6–18 years (n = 18,000) (21). Other research indicates a positive association between serum UA levels and 25-hydroxyvitamin D (25(OH)D), with the incidence of hyperuricemia increasing by 9.4% for every 10 nmol/L rise in 25(OH)D (P < 0.001) in a cohort of 9,220 subjects (17). A study in South Korea (10,864 participants) further emphasized a non-linear relationship between serum vitamin D and uric acid, showing a significant positive correlation within the vitamin D deficiency range (< 30 ng/ml) (34). In contrast, a cross-sectional study conducted in Zhejiang, China (7,086 participants), found an inverse U-shaped relationship between 25(OH)D and serum UA, identifying a threshold of 28.82 ng/ml, below which lower vitamin D levels were associated with an increased risk of hyperuricemia (OR: 1.0146, P = 0.0148), while higher levels were protective (OR: 0.9616, P = 0.0164) (20). Aadditionally, two studies involving adults aged 18 and older from the 2007–2014 National Health and Nutrition Examination Survey (NHANSE) in the United States found a significant negative association between vitamin D and HUA. Additionally, in the stratified analysis by gender, both studies found no gender differences in the relationship between vitamin D and UA/HUA (18, 19). These findings suggest that while the relationship between vitamin D and serum UA is multifaceted, it is influenced by both vitamin D status and the demographic characteristics of the studied populations. Besides, vitamin D and UA metabolism is regulated by genetic factors. It is worth noting that a single genetic variation site can explain 1%−4% of the variation in 25(OH)D levels across different populations (35–39). This variability underscores the need for further longitudinal and interventional research to establish the potential causal links and clinical implications of vitamin D and serum UA levels.
Over half of the Chinese participants in the present studies had vitamin D insufficiency (25(OH)D < 50 nmol/L). Vitamin D insufficiency/deficiency has been observed in various age groups across China. A meta-analysis by Zhang et al. (40) found that the prevalence of vitamin D deficiency (25(OH)D < 25 nmol/L) in Mainland China between 2000–2012 was approximately 30%. A cross-sectional study from the 2010 to 2013 China National Nutrition and Health Survey (CNNHS) reported that 12% of women and 7.8% of men over 60 had vitamin D deficiency (25(OH)D < 30 nmol/L), while 32% of women and 26.3% of men had insufficiency (25(OH)D < 50 nmol/L) (41). The 2010–2012 CNNHS also revealed that 7.2% of children and adolescents had vitamin D deficiency (25(OH)D < 25 nmol/L), and 42% had insufficiency (25(OH)D < 50 nmol/L) (42). These findings collectively highlight the significant burden of vitamin D deficiency and insufficiency in the general Chinese population.
The published evidence suggests that a minimum serum level of 25(OH)D is 30 ng/ml protects against less than one-third of common disorders, including musculoskeletal and calcium homeostasis. In contrast, when serum 25(OH)D levels range from 50 to 80 ng/ml, it can protect against 99% of health conditions without having any negative consequences (43). However, our results suggest that the theory of “the higher, the better” for vitamin D may not be entirely supported, vitamin D levels were inversely associated with UA in males under 70. but when vitamin D levels exceeded the above range, this inverse association disappeared, and serum UA increased with the increase of vitamin D level. The potential biological explanation for this finding is as follows: in men aged ≥70, declines in kidney function, vitamin D receptor (VDR) activity, and androgen levels reduce the bidirectional regulatory effects of vitamin D. In women, lower VDR expression due to vitamin D levels and estrogen influences, coupled with an increased risk of calcium metabolism disorders post-menopause, results in the harmful effects of high-dose vitamin D outweighing its “uric acid excre tion-promoting” benefits. Consequently, the relationship between vitamin D levels and the outcome does not exhibit a reverse J-shaped curve (15). Similarly, in the females of our study, higher vitamin D levels do not necessarily correlate with lower UA levels. When vitamin D exceeds a certain threshold, it can lead to HUA, which is associated with a variety of diseases. It is important to note that the phrase “the lower the serum UA, the better” is outdated. Considering that vitamin D and serum UA are positively correlated in females and males older than 70 years old in our study, too low and too high vitamin D levels may be associated with hypouricemia and HUA, respectively. Therefore vitamin D levels should be maintained within an optimal range. Additionally, our study found an L-shaped relationship between vitamin D and serum UA in males under 70 years. This emphasizes the importance of considering optimal vitamin D levels across different age groups and sexes.
Although there is some evidence of a relationship between serum vitamin D and serum UA, the causal relationship remains unclear. It has been reported that 25(OH)D is metabolized by the enzyme 1α-hydroxylase in the kidneys into 1,25-dihydroxy (1,25(OH)_2_D). This active form of vitamin D inhibits parathyroid hormone (PTH) synthesis, both directly by activating the vitamin D receptor in the parathyroid glands, and indirectly by stimulating intestinal calcium absorption, which leads to a transient increase in serum ionized calcium level (44). Furthermore, PTH downregulates the urate exporter, ATP-binding cassette transporter G2 transporter (ABCG2), which leads to decreased urinary UA excretion and subsequent accumulation of serum UA (45). Elevated UA inhibits the expression of the CYP27B1 gene, which encodes the enzyme 1α-hydroxylase. This enzyme is responsible for converting 25(OH)D into 1,25(OH)_2_D in the renal proximal tubule, resulting in increased level of 25(OH)D (46, 47). Despite the proposed interaction mechanism between vitamin D, PTH, and UA, the causal relationship between vitamin D and serum UA remains controversial. Two bidirectional analyses investigating this relationship reported conflicting results. Han et al. (48) suggested a causal association of genetically predicted UA on 25(OH)D. Specifically, they found that each 1 mg/dl increase in UA was associated with a decrease of 0.74 nmol/L of 25(OH)D. However, no causal relationship was observed between 25(OH)D and serum UA. Another bidirectional analysis conducted by Thakkinstian et al. constructed two causal pathways: rs2282679 → 25(OH)D → UA and rs2231142 → UA → 25(OH). They found each minor C allele in rs2282679 led to a decreasein 25(OH)D and then significantly decreased the UA by 0.0236 unit. For the second pathway, they found each T allele copy for rs2231142 increased UA levels, and subsequently increasing 25(OH)D by 0.0806 unit. In addition, this study also demonstrated a positive correlation between vitamin D levels and serum UA, which is partly consistent with our results (49). These findings suggest that clarifying the causal relationship between vitamin D and UA requires further validation through longitudinal cohort studies and interventional research. This is particularly important considering confounding factors such as impaired renal function, which may lead to both elevated UA levels and altered vitamin D metabolism, as well as the potential for reverse causality.
To date, no real-world population survey with such a large sample size across a broad age range has assess vitamin D levels in the Chinese population, the only existing studies include a 2013 meta-analysis (34) and several smaller studies focused on specific age groups, such as adolescents (42) or older adults (35). Furthermore, all participants in our study were included during the same season, which helps reduce bias, as vitamin D levels can be influenced by sunlight exposure. Additionally, the methods of vitamin D detection in the existing studies were inaccurate, either as a crude assessment using dietary questionnaires or chemiluminescence method (13, 16, 17), rather than applying the gold standard for vitamin D detection: LC-MS/MS. we used LC-MS, the gold standard for vitamin D detection, ensuring the accuracy of our measurements. To account for individual variations we also assessed the relationship between UA and vitamin D across gender and age groups.
This study has several limitations. Firstly, due to its cross-sectional design, it is not possible to establish a causal relationship between vitamin D levels and serum UA. Additionally, residual confounding may have affected the results, as other unmeasured factors—such as lifestyle, physical activity, or underlying health conditions—could have influenced both vitamin D levels and serum UA. Moreover, the study lacked data on dietary intake or sunlight exposure, both of which are important determinants of vitamin D status. Although this study provides valuable insights into the association between vitamin D levels and serum UA, the findings are not sufficient to directly inform individualized vitamin D recommendations. Further research, incorporating longitudinal data and considering dietary and sunlight exposure factors, is needed to develop personalized guidelines for vitamin D supplementation in the Chinese population.
In conclusion, our large-scale study suggests a significant vitamin D deficiency/insufficiency in the Chinese population. A sex- and age-specific association between vitamin D levels and both serum UA and HUA was observed in middle-aged to elderly Chinese individuals. If this potential causal relationship is further confirmed through longitudinal studies, our findings could pave the way for new strategies in the prevention and treatment of HUA, positioning vitamin D as a promising therapeutic target.
The reference list from the paper itself. Each links out to its DOI / PubMed record.
- 1Otani N Ouchi M Mizuta E Morita A Fujita T Anzai N . Dysuricemia-a new concept encompassing hyperuricemia and hypouricemia. Biomedicines. (2023) 11:1255. doi: 10.3390/biomedicines 1105125537238926 PMC 10215565 · doi ↗ · pubmed ↗
- 2Wang S Shu Z Tao Q Yu C Zhan S Li L. Uric acid and incident chronic kidney disease in a large health check-up population in Taiwan. Nephrology. (2011) 16:767–76. doi: 10.1111/j.1440-1797.2011.01513.x 21854506 · doi ↗ · pubmed ↗
- 3Tana C Ticinesi A Prati B Nouvenne A Meschi T. Uric acid and cognitive function in older individuals. Nutrients. (2018) 10:975. doi: 10.3390/nu 1008097530060474 PMC 6115794 · doi ↗ · pubmed ↗
- 4Haig A. On uric acid and arterial tension. Br Med J. (1889) 1:288–91. doi: 10.1136/bmj.1.1467.28820752582 PMC 2154674 · doi ↗ · pubmed ↗
- 5Giustina A Bilezikian JP Adler RA Banfi G Bikle DD Binkley NC . Consensus statement on vitamin D status assessment and supplementation: whys, whens, and hows. Endocr Rev. (2024) 45:625–54. doi: 10.1210/endrev/bnae 00938676447 PMC 11405507 · doi ↗ · pubmed ↗
- 6de la Guía-Galipienso F Martínez-Ferran M Vallecillo N Lavie CJ Sanchis-Gomar F Pareja-Galeano H. Vitamin D and cardiovascular health. Clin Nutr. (2021) 40:2946–57. doi: 10.1016/j.clnu.2020.12.02533397599 PMC 7770490 · doi ↗ · pubmed ↗
- 7Carlberg C Velleuer E. Vitamin D and the risk for cancer: a molecular analysis. Biochem Pharmacol. (2022) 196:114735. doi: 10.1016/j.bcp.2021.11473534411566 · doi ↗ · pubmed ↗
- 8Szymczak-Pajor I Drzewoski J Sliwińska A. The molecular mechanisms by which vitamin D prevents insulin resistance and associated disorders. Int J Mol Sci. (2020) 21:6644. doi: 10.3390/ijms 2118664432932777 PMC 7554927 · doi ↗ · pubmed ↗