The diagnostic accuracy of soft tissue oedema measurements: a systematic review and best-evidence synthesis
Margje B. Buitenhuis, Elise M. Gane, Janine T. Hidding, Judith D. de Rooij, Wichor M. Bramer, Remco de Bree, Caroline M. Speksnijder

TL;DR
This review evaluates tools for measuring soft tissue swelling in lymphoedema, finding no single best method for diagnosis.
Contribution
A systematic review and best-evidence synthesis of measurement tools for diagnosing lymphoedema in adults.
Findings
MF-BIA, perometry, and MRI showed high diagnostic value but lacked strong supporting evidence.
Tape measurements, ultrasound, and MF-BIA were the most studied instruments.
No single instrument emerged as a definitive gold standard for diagnosing lymphoedema.
Abstract
Effective lymphoedema management relies on early detection and treatment during its reversible phase, underlining the importance of accurate measurement tools. This systematic review aims to identify measurement instruments for quantitatively diagnosing lymphoedema and their diagnostic accuracy. Literature was systematically searched on the diagnostic accuracy of instruments for assessing soft tissue oedema across body parts in adults. Inclusion criteria encompassed studies establishing diagnostic accuracy (sensitivity and/or specificity) of instruments for quantifying oedema through volume changes, tissue characteristics, or lymphatic system function. Searches included Embase, Medline, Web of Science, and CINAHL databases from inception to March 18, 2024. Methodological quality was assessed using the COSMIN checklist for criterion validity and QUADAS-2. Diagnostic value was evaluated…
Genes, proteins, chemicals, diseases, species, mutations and cell lines named across the full text — each resolved to its canonical identifier and authoritative record.
Click any figure to enlarge with its caption.
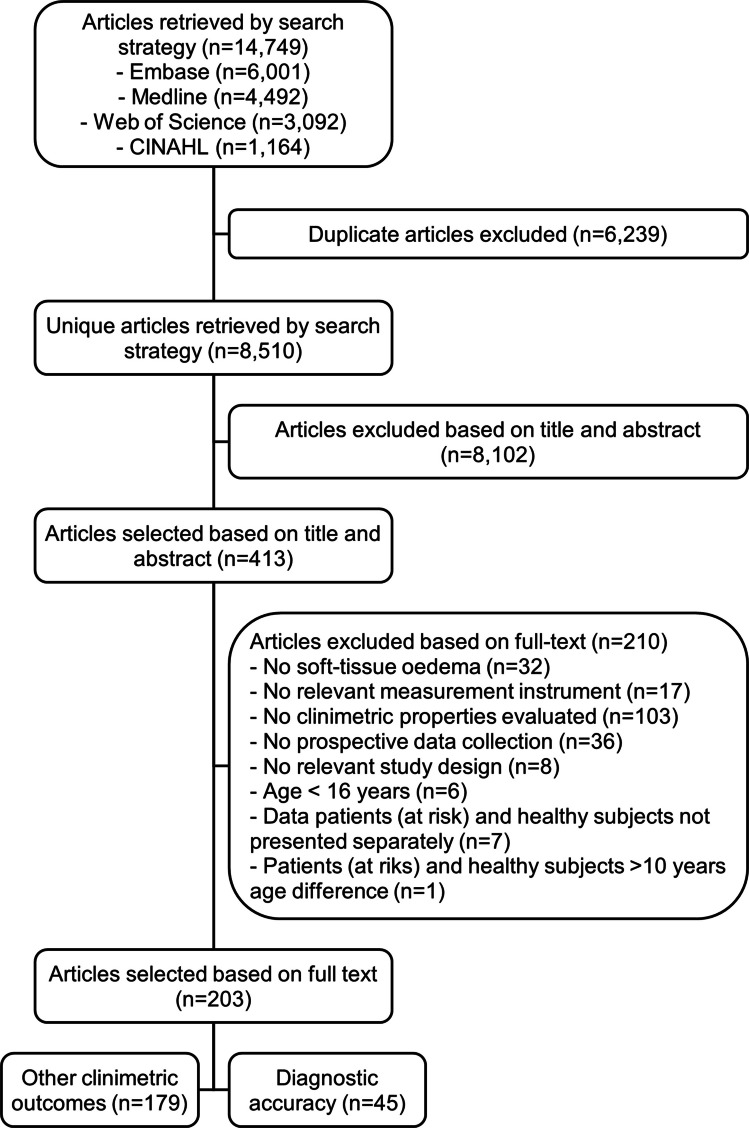 Figure 1
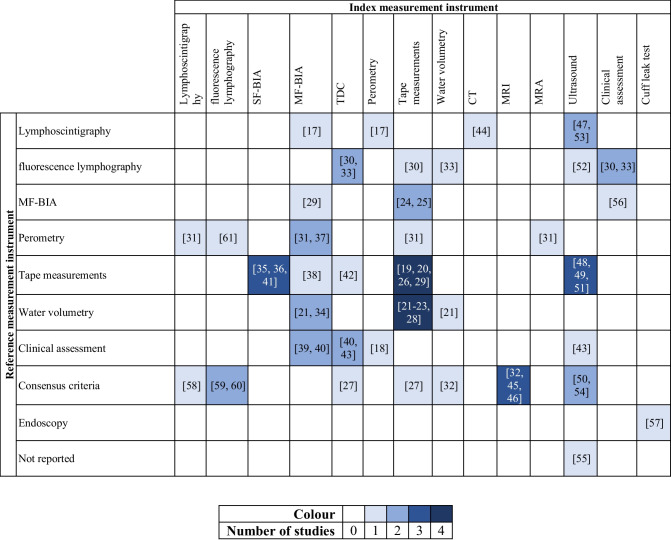 Figure 2
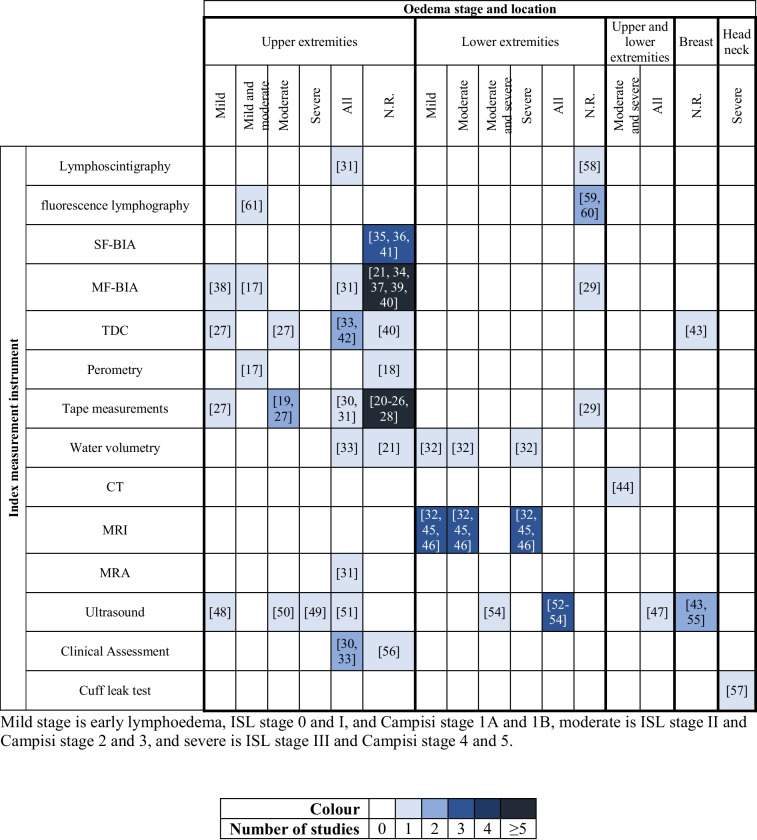 Figure 3
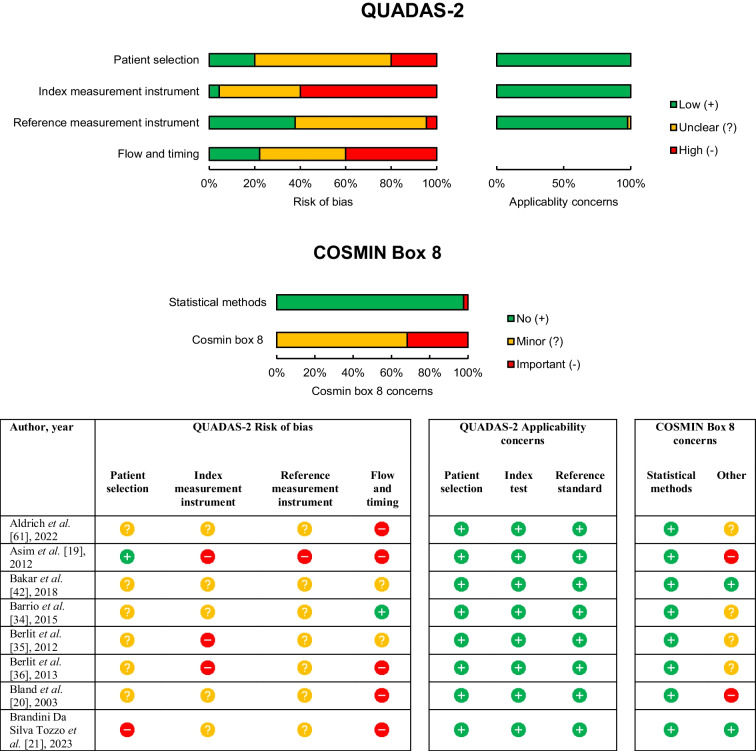 Figure 4
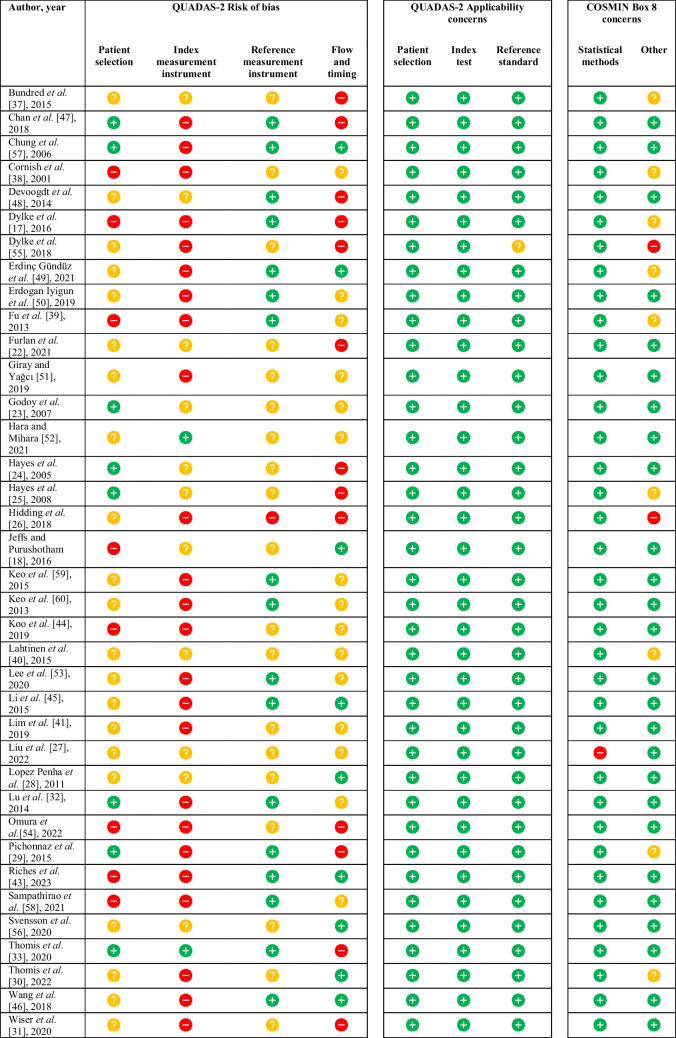 Figure 5
Peer Reviews
No public reviews on file for this paper yet. If you reviewed it on a platform where reviews are public (OpenReview, ICLR, NeurIPS, ICML), you can paste yours below so the community can read it here.
Videos
No videos yet. Explain this paper in a talk, walkthrough, or lecture? Add one.
Taxonomy
TopicsLymphatic System and Diseases · Diagnosis and Treatment of Venous Diseases · Lymphatic Disorders and Treatments
Introduction
Lymphoedema is a significant global health issue, affecting approximately 200 million people worldwide [1]. This condition is characterized by lymphatic fluid accumulation and occurs as either primary, due to genetic mutations, or secondary, arising from systemic disease, trauma, or interventions, especially cancer-related surgeries and radiotherapy [2–5].
The International Society of Lymphoedema (ISL) stages lymphoedema from subclinical (stage 0) to hard, fibrotic oedema (stage 3) [2]. Early symptoms are often subjective, like tightness or heaviness, progressing to visible swelling and tissue fibrosis [2]. Chronic lymphoedema can cause significant physical discomfort, including pain, swelling, heaviness, and reduced mobility of the affected area, and is associated with complications such as recurrent skin infections, skin ulcers, or, in the worst case, angiosarcoma [5]. Lymphoedema has major psychological and social impacts on the quality of life of patients [6]. Moreover, the condition is a major burden on the health care system because it is a chronic and progressive condition that often requires lifelong treatment [5].
Lymphoedema treatment is commonly a multi-modal approach of manual lymphatic drainage, compression, exercises, and skincare [7, 8]. Several adjunct treatment options have also been trialled, such as pneumatic compression, pharmaceuticals, laser therapy, and microvascular surgery [7]. Evidence suggests that early treatment of lymphoedema is both effective and cost-saving [4]. To commence early treatment of lymphoedema, early detection is crucial, underscoring the need for measurement instruments with good diagnostic capacity.
Lymphoedema can be quantified in multiple methods, including volume, tissue characteristics, and lymphatic system function, depending on its stage [2, 5]. However, no universally accepted gold standard for assessment exists, and multiple instruments with unique advantages and drawbacks are applied in research and clinical settings [9].
To our knowledge, only one systematic review has evaluated the diagnostic accuracy of lymphoedema measurement instruments [9]. This review highlighted limited and sometimes conflicting results for measuring upper extremity lymphoedema and recommended water volumetry as the reference test due to its superior reliability. Although various instruments were assessed, only one study used water volumetry as the reference, evaluating tape measurement with sensitivities from 0.05 to 0.90 and specificities from 0.69 to 1.00. Notably, advanced imaging modalities like computed tomography (CT), magnetic resonance imaging (MRI), and ultrasound (US) were excluded, though these could provide valuable information and could be applied in specific cases during regular clinical follow-up.
Given advancements in lymphoedema research since this review from 2015, a reassessment of measurement instruments and their properties is relevant and timely. This systematic review aims to identify instruments for quantitatively diagnosing soft-tissue oedema, including lymphoedema, across any body part and their diagnostic accuracy. We expect the results to assist clinicians in selecting appropriate instruments for their patients and support researchers in improving early diagnostic methods.
Methods
Protocol and registration
This review follows the Preferred Reporting Items for Systematic Reviews and Meta-Analyses (PRISMA) guidelines [10] and has been registered in PROSPERO (registration number: CRD42023474209). Given the extensive initial search, this review addresses the diagnostic accuracy of measurement instruments for soft tissue oedema, with other clinimetric properties covered in separate reviews (in preparation).
Eligibility criteria
Studies were included when describing measurement instruments that quantified soft tissue oedema. Although the primary focus was lymphoedema, studies assessing other types of soft tissue swelling, such as postoperative swelling that could mimic early-stage lymphoedema, were also included. Studies were excluded when describing measurements of temporary oedema in healthy subjects (e.g. individuals with standing jobs or those taking long flights), although cohort studies with patients and healthy subjects were included. Studies reporting on soft tissue oedema in skin conditions (e.g. ulcers, burn wounds, or psoriasis) or vascular oedema were excluded. Only prospective studies involving adults (≥ 16 years of age) were included; studies on paediatric cohorts were excluded. Instruments had to measure body part or tissue volume, tissue characteristics, or lymphatic system function. Clinical assessment of one of these aspects by a specialist was also considered relevant. Patient-reported outcomes were excluded. Studies on measurement instruments not aiming to quantify soft tissue oedema or those quantifying the quality of the venous system were excluded. Studies that reported both objective measures and patient-reported measures of lymphoedema were included, with only objective data extracted.
Studies had to report on the diagnostic accuracy with sensitivity or specificity. For cohort studies, data had to be presented separately for patients, patients at risk, and healthy subjects. Data was excluded when patients (at risk) and healthy subjects had a difference in the mean age of more than 10 years to minimize bias as aging leads to alteration of elastic properties of the skin [11]. Meta-analyses, systematic reviews, conference papers, case reports, and studies without accessible full text were excluded.
Information sources and search
Electronic databases Embase.com, Medline via Ovid, Web of Science Core Collection, and CINAHL via EBSCO were systematically searched from inception until March 18, 2024 (date last searched). The search strategy included terms related to the construct (e.g. lymphoedema, swelling) combined with a methodological search filter for finding studies on measurement properties [12]. Full search strategies are provided in Supplementary information 1.
Study selection
Two reviewers (MBB and JTH) independently assessed titles and abstracts of the studies retrieved by the literature search. Full-text articles were then retrieved and divided into two sets for examination. Each set was independently reviewed by two reviewers (MBB and EMG for set A; JTH and JDR for set B) to compile the final list of eligible studies. Disagreements were resolved by a third reviewer (CMS).
Data collection process
Two reviewers (MBB and EMG) independently extracted data from the included articles into a custom-built template in Microsoft Word. Extracted data included the first author, year of publication, index measurement instrument, reference measurement instrument, study population (age, gender, previous diagnosis, swelling type, and swelling stage), and diagnostic accuracy (sensitivity and specificity). Consensus was achieved through discussion in cases of disagreement.
Quality assessment
The methodological quality of included studies was independently assessed by two reviewers (MBB and EMG) using the Quality Assessment of Diagnostic Accuracy Studies tool (QUADAS-2), which evaluates patient selection, index test, reference standard, and flow and timing [13]. Each domain contributes to the assessment of risk of bias, with the first three domains also assessing applicability. In addition, criterion validity was specifically evaluated using the COnsensus-based Standards for the selection of health Measurement Instruments (COSMIN) checklist Box 8 [14]. The assessment protocol is detailed in Supplementary information 2. Disagreement was resolved by a third reviewer (CMS).
Data synthesis
Pooling of the studies was not possible due to the diversity in instruments and parameters. Therefore, a best-evidence synthesis for diagnostic accuracy has been established and conducted. Index measurement instruments are categorized into five levels of evidence as presented in Table 1. Table 1. Best-evidence synthesis for diagnostic accuracyLevel of evidenceCriteriaStrong evidenceProvided by at least three studies with very good quality, defined as ≥ 3 good quality-scores (+) for QUADAS-2 Risk of bias, and 3 good-quality scores (+) for QUADAS-2 applicability, and no concerns for COSMIN Box 8Moderate evidenceProvided by at least two studies with very good quality, defined as ≥ 3 good quality-scores (+) for QUADAS-2 Risk of bias, and 3 good-quality scores (+) for QUADAS-2 applicability, and no important concerns for COSMIN Box 8Limited evidenceProvided by one study with very good quality, defined as ≥ 3 good quality-scores (+) for QUADAS-2 Risk of bias, and 3 good-quality scores (+) for QUADAS-2 applicability, and no important concerns for COSMIN Box 8, or at least two studies with good quality, defined as ≥ 2 good quality-scores (+) for QUADAS-2 Risk of bias, and ≥ 2 good-quality scores (+) for QUADAS-2 applicability, and no important concerns for COSMIN Box 8Insufficient evidenceIn the case that eligible studies do not meet the criteria for one of the above stated levels of evidenceNo evidenceIn the case of no eligible studies
For all extracted diagnostic accuracy data, the diagnostic evidence was given by the Youden index, which was calculated by deducting 1 from the sum of the sensitivity and specificity [15, 16]. The Youden index was interpreted as weak (< 0.4), moderate (≥ 0.4 and < 0.7), high (≥ 0.7 and < 0.9), and very high (≥ 0.9) as an indicator of the diagnostic value of measurement instruments. Diagnostic evidence was classified as conflicting when the Youden index differed ≥ 0.4 within or between studies.
Diagnostic accuracy data were interpreted as indicators of the index measurement instrument, not the reference measurement instrument. Index instruments could be experimental, while reference measurement instruments were commonly used clinically in the absence of a clear gold standard. Applicability of reference instruments was evaluated during quality assessment.
Results
Included studies
The search identified 8,510 unique articles, with 413 eligible for full-text assessment. Of these, 210 articles were excluded based on the eligibility criteria, and 179 articles assessed clinimetric outcome measures other than diagnostic accuracy, which will be addressed in subsequent reviews. Ultimately, 45 articles on diagnostic accuracy were included in this review, as detailed in the study selection flowchart (Fig. 1).Fig. 1. Study selection flowchart
Study characteristics
The characteristics of the included studies are presented in Table 2, sorted by index and reference measurement instruments. An overview of the identified measurement instruments is provided in Table 3. Table 2. Study characteristics of included articlesAuthor, yearIndex measurement instrumentReference measurement instrumentDiagnoseVersusDiagnostic classification system/thresholdBody partPopulationMeasurement instrument specification and thresholdDiagnostic accuracyPrevious diagnosisN** (%F)Age; mean ± SD median (range)SensitivitySpecificityYouden indexWiser et al*.* [31], 2020LSGPerometryAll stages LENo LEInterlimb volume difference > 10%Upper extremities unilateralVarious118 (98)54 ± 11Presence of dermal backflow or lack of radiotracer uptake after 3 h0.880.410.29Sampathirao et al*.* [58], 2021LSGISL consensus criteria 2020LENo LEISL consensus criteria 2020Lower extremitiesVariousLE: 86 (43)No LE: 9 (56)LE: (Range = 18–78)No LE: (Range = 20–45)Nodal uptake ≤ 22.18%1.000.800.80Keo et al*.* [60], 2013Fluorescence lymphographyLymphedema Framework International consensus 2006LENo LELymphedema Framework International consensus 2006Lower extremitiesNot specifiedLE: 89 (66)No LE: 82 (74)LE: 47 (IQR = 29–56)No LE: 48 (IQR = 37–58)Maximum spread of dye ≥ 8 mm0.940.280.22 ≥ 10 mm0.910.400.31 ≥ 12 mm0.870.640.51 ≥ 14 mm0.790.830.62 ≥ 15 mm0.780.830.61 ≥ 16 mm0.720.840.56Keo et al*.* [59], 2015^a^Fluorescence lymphographyLymphedema Framework International consensus 2006LENo LELymphedema Framework International consensus 2006Lower extremitiesNot specified70 (66)45 (IQR = 27–56)Maximum spread of dye ≥ 10 mm0.940.510.45 ≥ 12 mm0.940.790.73 ≥ 14 mm0.920.860.78 ≥ 16 mm0.760.890.65Aldrich et al*.* [61], 2022Fluorescence lymphographyPerometryMild to moderate LENo LERelative volume change ≥ 5% to baselineUpper extremitiesBC42 (100)54 (28–68)Dermal backflow present0.970.500.47Berlit et al*.* [35], 2012SF-BIATape measurementsLENo LENRUpper extremitiesBC unilateral33 (100)59.9 ± 9.3Resistance, threshold NR0.750.860.61Phase angle, threshold NR0.750.830.58Berlit et al*.* [36], 2013^b^SF-BIATape measurementsLENo LENRUpper extremitiesBC unilateralLE: 7 (100)No LE: 35 (100)LE: 60.3 ± 10.6No LE: 60.4 ± 11.3Resistance, threshold NR0.860.970.83Lim et al. [41], 2019SF-BIATape measurementsLENo LE > 2 cm interlimb differenceUpper extremitiesBC unilateralLE: 22 (100)No LE: 206 (100)LE: 56.3 ± 12.0No LE: 52.8 ± 9.75 kHz, interlimb ratio > 1.0470.630.950.58Dylke et al*.* [17], 2016MF-BIALSGDermal backflow score 1 and 2Dermal backflow score 00: no dermal backflow1: small area or localized backflow2: circumferential dermal backflow in < 50% of the forearm3: circumferential dermal backflow in > 50% of the forearmUpper extremitiesBC unilateralLE: 68 (100)At risk: 6 (100)No LE: 13 (100)LE: 60.7 ± 11.1At risk: 50.5 ± 7.5No LE: 55.9 ± 17.6Impedance interlimb ratio3SD0.960.67–0.720.63–0.682SD0.930.81–0.870.74–0.80Pichonnaz et al*.* [29], 2015MF-BIAMF-BIA (preoperative)Postoperative (TKA) swellingNo swellingPercentage difference between the healthy and involved limb (threshold NR)Lower extremities (unilateral)Osteoarthritis24 (50)69.5 ± 9.7Postoperative day 2, interlimb difference > 13.4%0.960.960.92Postoperative day 8, interlimb difference > 13.8%1.000.960.96Bundred et al*.* [37], 2015MF-BIAPerometryLENo LE > 10% volume increase from baselineUpper extremitiesBC612 (100)55 (24–90) ≥ 10 units difference from baseline0.730.840.57Wiser et al*.* [31], 2020MF-BIAPerometryAll stages LENo LEInterlimb volume difference > 10%Upper extremities unilateralVarious118 (98)54 ± 11L-Dex > 100.910.760.67Cornish et al*.* [38], 2001MF-BIATape measurementsEarly LENo LE > 0.139 volume ratio from baselineUpper extremitiesBC unilateral102 (NR)51 (25–82) > 0.102 ratio from baseline1.000.980.98Fu et al*.* [39], 2013MF-BIATape measurement + clinical assessment + self-reportLEAt riskTape measurement > 200 ml interlimb differenceUpper extremitiesBC unilateralLE: 42 (100)At risk: 148 (100)LE: 58.0 ± 10.7At risk: 55.8 ± 11.6L-Dex interlimb ratio > + 100.660.950.61 > + 7.10.800.900.70Barrio et al*.* [34], 2015MF-BIAWVLENo LE > 10% interlimb differenceUpper extremitiesBC unilateral186 (100)60 (27–83)L-Dex interlimb ratio > 100.750.930.68Brandini Da Silva Tozzo et al*.* [21], 2023MF-BIAWVLENo LEInterlimb volume difference of ≥ 200 mLUpper extremitiesBC462 (100)57 ± 9L-Dex interlimb ratio ≥ 100.440.950.39 ≥ 7.350.570.910.48 ≥ 6.50.570.890.46 ≥ 1.350.740.670.41Lahtinen et al*.* [40], 2015MF-BIA2 of the following 3: WV, clinical assessment (palpation), self-reportLENo LEWV ≥ 5% interlimb differenceUpper extremitiesBC unilateral100 (100)57.4 ± 11.5Interlimb ratio 1.066 nondominant arm and 1.139 dominant arm0.420.940.36Thomis et al. [33], 2020TDC measurementsFluorescence lymphographyDermal backflow stage I-VNo dermal backflowDermal backflow stage:I: splash patternII: stardust pattern proximally to the olecranonIII: stardust pattern exceeds olecranonIV: stardust pattern whole armV: diffuse patternUpper extremities (unilateral)HandBC45 (NR)61.3 ± 9.9Water content interlimb ratio ≥ 1.20.650.900.55Ventral forearm0.810.670.48Dorsal forearm0.780.750.53Elbow0.850.11-0.04Ventral upper arm0.670.850.52Dorsal upper arm0.720.670.39Shoulder0.330.980.31Overall0.750.750.50Thomis et al*.* [30], 2022^c^TDC measurementsFluorescence lymphographyDermal backflow stage I-IVNo dermal backflowDermal backflow stage:0: NoI: splash patternII: stardust patternIII: diffuse patternIV: no transportUpper extremitiesAll regionsBC unilateral128 (99)56.7 ± 12.2Water content interlimb ratio ≥ 1.20.360.920.28Ventral upper arm0.380.910.29Bakar et al*. [42], 2018TDC measurementsTape measurementsGrade 1–3 LEGrade 0 LECircumference interlimb differenceGrade 1: 5–10%Grade 2: 10–30%Grade 3: > 30%Upper extremitiesBC unilateralLE: 31 (100)No LE: 32 (100)LE: 54.5 ± 13.0No LE: 53.3 ± 12.9Local tissue water interlimb ratio ≥ 1.200.650.940.59Lahtinen et al. [40], 2015TDC measurements2 of the following 3: WV, clinical assessment (palpation), self-reportLENo LEWV ≥ 5% interlimb differenceUpper extremitiesBC unilateral100 (100)57.4 ± 11.5Interlimb ratio 1.45 upper arm and 1.30 forearm0.660.840.50Riches et al. [43], 2023TDC measurementsClinical assessmentLENo LEPitting oedema present ≥ 1 breast quadrantBreastBC89 (NR)61.1 ± 9.6Interbreast ratio > 1.340.880.800.68Liu et al. [27], 2022TDC measurementsISL consensus criteria 2016Stage 0 LENo LEISL consensus criteria 2016Upper extremitiesBC unilateral69 (100)54.4 ± 9.3Interlimb ratio ≥ 1.20.44NRNAStage 1 LENo LE0.52NRNAStage 2 LENo LE0.96NRNADylke et al. [17], 2016PerometryLSGDermal backflow score 1 and 2Dermal backflow score 00: no dermal backflow1: small area or localized backflow2: circumferential dermal backflow in < 50% of the forearm3: circumferential dermal backflow in > 50% of the forearmUpper extremitiesBC unilateralLE: 68 (100)At risk: 6 (100)No LE: 13 (100)LE: 60.7 ± 11.1At risk: 50.5 ± 7.5No LE: 55.9 ± 17.6Whole arm volume3SD, truncated cone1.000.570.572SD, truncated cone1.000.810.813SD, perometry cut-off1.000.620.622SD, perometry cut-off1.000.780.78200 ml difference0.960.780.7410% increase0.960.780.74Circumferences3SD, single elevation1.000.810.813SD, 2 + elevation1.000.580.582SD, single elevation0.960.940.902SD, 2 + elevation1.000.770.773SD, SOAC1.000.640.642SD, SOAC1.000.770.77Single 2 cm difference1.000.850.852 + 2 cm difference1.000.650.65SOAC: 5 cm difference1.000.770.77Jeffs and Purushotham [18], 2016PerometryClinical assessmentLENo LEPresence of one or more symptoms: decreased visibility of veins, increased thickness of skin and subcutis, fullness of tissues or smoothing of natural limb contours, pitting oedemaUpper extremitiesBC40 (100)62 (IQR 55–66) ≥ 10% interlimb difference0.171.000.17Hayes et al. [24], 2005Tape measurementsMF-BIALENo LEInterlimb ratio > 3SDUpper extremitiesBC unilateral176 (100)54 ± 10Sum of arm circumference interlimb difference > 5 cm0.350.890.24 > 10%0.051.000.05Hayes et al. [25], 2008^d^Tape measurementsMF-BIALENo LEInterlimb ratio > 3SDUpper extremitiesBC unilateral211 (100)54 ± 10Sum of arm circumference interlimb difference > 5 cm0.420.880.30Wiser et al. [31], 2020Tape measurementsPerometryAll stages LENo LEInterlimb volume difference > 10%Upper extremities unilateralVarious118 (98)54 ± 11Circumference difference > 2 cm0.830.850.68Asim et al. [19], 2012Tape measurementsTape measurementsModerate LENo or mild LELymphedema Framework International consensus 2006; volume ≥ 20% interlimb differenceUpper extremitiesBC unilateral73 (100)61 ± 11^e^Circumference interlimb difference ≥ 7.5%0.830.810.64 ≥ 10%0.660.890.55 ≥ 2 cm0.660.800.46Hidding et al. [26], 2018Tape measurementsTape measurementsLENo LEVolume ≥ 10% interlimb differenceUpper extremitiesBC unilateral51 (98)51.3 ± 8.5Circumference > 4% interlimb difference0.850.850.70Bland et al. [20], 2003Tape measurementsTape measurements with clinical assessment specialistLENo LE > 10% increase in volume from baseline or > 1 cm increase in circumference from baseline, both with confirmation from a lymphoedema specialist (method not specified)Upper extremitiesElbowBCLE: 38 (100)No LE: 52 (100)LE: 54.8 ± 13.4No LE: 54.4 ± 10.3Circumference increase from baseline > 5%0.800.710.51 > 10%0.370.920.29 > 2 cm0.590.850.44Any site > 5%0.910.460.37 > 10%0.490.810.30 > 2 cm0.700.760.46Pichonnaz et al. [29], 2015Tape measurementsTape measurements (preoperative)Postoperative (TKA) swellingNo swelling% difference between the healthy and involved limb (threshold NR)Lower extremities (unilateral)Osteoarthritis24 (50)69.5 ± 9.7Postoperative day 2Volume, interlimb difference > 6.1%0.830.790.62Circumference, interlimb difference > 5.6%0.920.830.75Postoperative day 8Volume, interlimb difference > 7.7%0.920.920.84Circumference, interlimb difference > 5.8%0.960.880.84Brandini Da Silva Tozzo et al. [21],* 2023Tape measurementsWVLENo LEInterlimb volume difference of ≥ 200 mLUpper extremitiesBreast cancer462 (100)57 ± 9Interlimb difference ≥ 2 cm0.850.830.68Godoy et al*. [23], 2007Tape measurementsWVLENo LE ≥ 200 mL interlimb differenceUpper extremitiesBC unilateral^f^90 (100)54.8 ± 11.7Interlimb difference ≥ 2 cm0.900.720.62 ≥ 100 mL interlimb difference ≥ 2 cm0.870.690.56 ≥ 10% interlimb difference ≥ 10%0.730.780.51Furlan et al. [22], 2021Tape measurementsWVLENo LEInterlimb volume difference of ≥ 200 mLUpper extremitiesBC unilateral85 (NR)21% < 55y79% > 55yInterlimb difference ≥ 2 cmfor two contiguous points0.530.990.52any point0.630.920.55Lopez Penha et al. [28], 2011Tape measurementsWVLENo LE > 299 mL interlimb differenceUpper extremitiesBC145 (100)55 (33 -86)^g^Circumference interlimb difference > 2 cm0.820.730.55Sum of circumferences interlimb difference > 5 cm0.820.900.72Liu et al. [27], 2022Tape measurementsISL consensus criteria 2016Stage 0No LEISL consensus criteria 2016Upper extremitiesBC unilateral69 (100)54.4 ± 9.3Interlimb difference circumference ≥ 2 cm at any point, or volume ≥ 200 mL and/or ≥ 10%0.00NRNAStage 1 LENo LE1.00NRNAStage 2 LENo LE1.00NRNAThomis et al. [30], 2022^c^Tape measurements (arm) and water volumetry (hand)Fluorescence lymphographyDermal backflow stage I-IVNo dermal backflowDermal backflow stage:0: NoI: splash patternII: stardust patternIII: diffuse patternIV: no transportUpper extremitiesAll regionsBC unilateral128 (99)56.7 ± 12.2Interlimb volume difference ≥ 3%0.600.860.46 ≥ 5%0.460.920.38Ventral upper arm ≥ 3%0.670.650.32 ≥ 5%0.510.18-0.31Thomis et al. [33], 2020WVFluorescence lymphographyDermal backflow stage I-VNo dermal backflowDermal backflow stage:I: splash patternII: stardust pattern proximally to the olecranonIII: stardust pattern exceeds olecranonIV: stardust pattern whole armV: diffuse patternUpper extremities (unilateral)HandBC45 (NR)61.3 ± 9.9Interlimb difference ≥ 5%0.850.790.64Ventral forearm0.940.560.50Dorsal forearm0.970.750.72Elbow0.850.160.01Ventral upper arm0.940.220.16Dorsal upper arm1.000.260.26Overall0.930.390.32Brandini Da Silva Tozzo et al. [21], 2023WV (indirect)WV (direct)LENo LEInterlimb volume difference of ≥ 200 mLUpper extremitiesBC462 (100)57 ± 9Interlimb difference ≥ 200 ml0.660.960.62Lu et al. [32], 2014WVISL consensus criteria 2009Stage 1 LEStage 0 LEISL consensus criteria 2009Lower extremities (unilateral)CalfGC: cervical or endometrialLE stage0: 25 (100)1: 22 (100)2: 28 (100)3: 20 (100)Median = 57 ≥ 10%0.580.970.55Interlimb volume difference (56 ml)0.860.760.62Stage 2 LEStage 1 LEVolume (2620 ml)0.680.710.39Interlimb volume difference (364 ml)0.840.860.70Stage 3 LEStage 2 LEVolume (3450 ml)0.950.870.82Interlimb volume difference (1033 ml)0.900.870.77Koo et al. [44], 2019CTLSGLSG Stage IVLSG Stages I, II and IIIStage 1: normalStage 2: visible, but dysfunctional epifascial lymph nodesStage 3: dermal backflow and no visible epifascial lymph nodesStage 4: visible dermal backflow and no epifascial or subfascial lymph nodesUpper and lower extremitiesVarious24 (100)57.5 ± 13.4Interlimb ratio number of pixels of tissue layer between skin and muscle 17.570.780.600.38LSG Stages III and IVLSG Stages I and II0.750.560.31Li et al. [45], 2015^ h^MRIISL consensus criteria 2009Stage 1 LEStage 0 LEISL consensus criteria 2009Lower extremities (unilateral)CalfGC: uterineLE stage0: 22 (100)1: 15 (100)2: 38 (100)3: 19 (100)Median = 57Total soft tissue thickness (105.4 mm)0.600.820.42Interlimb difference total soft tissue thickness (5.65 mm)0.600.770.37Subcutaneous tissue thickness (23.7 mm)0.670.960.63Interlimb difference subcutaneous tissue thickness (3.45 mm)0.930.820.75Interlimb difference muscle tissue thickness (0.10 mm)0.730.640.37Stage 2 LEStage 1 LETotal soft tissue thickness (111.05 mm)0.710.800.51Interlimb difference total soft tissue thickness (13.85 mm)0.840.800.64Subcutaneous tissue thickness (30.6 mm)0.760.730.49Interlimb difference subcutaneous tissue thickness (11.1 mm)0.840.870.71Interlimb difference muscle tissue thickness (0.90 mm)0.610.600.21Stage 3 LEStage 2 LETotal soft tissue thickness (124.45 mm)0.900.820.72Interlimb difference total soft tissue thickness (31.63 mm)0.840.900.74Subcutaneous tissue thickness (46.95 mm)0.950.900.85Interlimb difference subcutaneous tissue thickness (29.3 mm)0.950.920.87Interlimb difference muscle tissue thickness (0.65 mm)0.470.40-0.13Stage 1 LEStage 0 LEThighTotal soft tissue thickness (133.25 mm)0.600.590.19Interlimb difference total soft tissue thickness (7.8 mm)0.730.820.55Subcutaneous tissue thickness (37.05 mm)0.730.730.46Interlimb difference subcutaneous tissue thickness (3.65 mm)0.730.730.46Interlimb difference muscle tissue thickness (0.05 mm)0.600.590.19Stage 2 LEStage 1 LETotal soft tissue thickness (144.60 mm)0.730.600.33Interlimb difference total soft tissue thickness (19.85 mm)0.760.720.48Subcutaneous tissue thickness (46.9 mm)0.660.600.26Interlimb difference subcutaneous tissue thickness (15.2 mm)0.760.600.36Interlimb difference muscle tissue thickness (4.55 mm)0.640.600.24Stage 3 LEStage 2 LETotal soft tissue thickness (158.35 mm)0.790.680.47Interlimb difference total soft tissue thickness (44.45 mm)0.740.870.61Subcutaneous tissue thickness (62.3 mm)0.740.680.42Interlimb difference subcutaneous tissue thickness (38.85 mm)0.680.870.55Interlimb difference muscle tissue thickness (7.65 mm)0.630.660.29Lu et al. [32], 2014MRIISL consensus criteria 2009Stage 1 LEStage 0 LEISL consensus criteria 2009Lower extremities (unilateral)CalfGC: cervical or endometrialLE stage0: 25 (100)1: 22 (100)2: 28 (100)3: 20 (100)Median = 57Total soft tissue thickness (970 mm)0.740.720.46Interlimb difference total soft tissue thickness (4.6 mm)0.710.920.63Subcutaneous tissue thickness (18.1 mm)0.930.840.77Interlimb difference subcutaneous tissue thickness (3.5 mm)0.961.000.96Stage 2 LEStage 1 LETotal soft tissue thickness (1111 mm)0.700.790.49Interlimb difference total soft tissue thickness (13.9 mm)0.840.930.77Subcutaneous tissue thickness (29.2 mm)0.780.710.49Interlimb difference subcutaneous tissue thickness (11.5 mm)0.880.940.82Stage 3 LEStage 2 LETotal soft tissue thickness (129.6 mm)0.840.890.73Interlimb difference total soft tissue thickness (31.7 mm)0.840.890.73Subcutaneous tissue thickness (48.2 mm)0.900.920.82Interlimb difference subcutaneous tissue thickness (29.3 mm)0.900.970.87Wang et al. [46], 2018MRIISL consensus criteria 2013Stage 1 LEStage 0 LEISL consensus criteria 2013Lower extremitiesVarious138 (NR)NRTotal area soft-tissue (6180 mm^2^)0.760.430.19Difference total area soft-tissue (306 mm^2^)0.760.640.40Water area soft-tissue (17 mm^2^)1.001.001.00Stage 2 LEStage 1 LETotal area soft-tissue (7006.5 mm^2^)0.750.590.34Difference total area soft-tissue (1281 mm^2^)0.890.910.80Water area soft-tissue (913 mm^2^)0.810.940.75Stage 3 LEStage 2 LETotal area soft-tissue (120,200 mm^2^)0.540.850.39Difference total area soft-tissue (4809 mm^2^)0.860.890.75Water area soft-tissue (10479.5 mm^2^)0.720.750.47Wiser et al. [31], 2020MRAPerometryAll stages LENo LEInterlimb volume difference > 10%Upper extremities unilateralVarious118 (98)54 ± 11Fluid accumulation0.940.440.38Fat hypertrophy0.960.640.60Lee et al. [53], 2020USLSGStage 1 or 2 LEStage 0 LEStage 0: normalStage 1: partial lymphatic obstructionStage 2: total lymphatic obstructionLower extremities (unilateral)Not specified60 (90)59.0 ± 11.7Evenlope amplitude, threshold NR0.700.480.18Nakagami parameter, threshold NR0.700.750.45Shannon entropy, threshold NR0.950.880.83Chan et al. * [47], 2018USLSGLymphatic obstruction (partial and total)No lymphatic obstructionNo: lymph nodes and lymphatic collectors are well visualized and without dermal backflowPartial: either decreased visualization of proximal lymph nodes or dermal backflowTotal: absence of lymphatic collector and proximal lymph nodes and dermal backflowUpper (N = 19) and lower extremities (N = 45)Cancer (N = 56) or none (primary LE, N = 8)64 (89)58.4 ± 11.9Cutaneous shear wave velocity > 2.10 m/s0.830.860.69Subcutaneous shear wave velocity > 1.43 m/s0.800.700.50Hara and Mihara [52], 2021USFluorescence lymphographyAll stages LENo LEPresence dermal backflowLower extremitiesGC14 (100)Mean 59.7(range 48–84)Presence dilated or sclerotic lymphedema vessels0.430.940.37Devoogdt et al*. [48], 2014USTape measurementsMild LENo LE > 5% volume interlimb differenceUpper extremitiesWristBC unilateral42 (NR)54.9 ± 11.4Thickness subcutis (> 20% interlimb difference)0.400.930.33Echogenicity cutis (disturbed)1.000.750.75Echogenicity subcutis (disturbed)0.330.930.26VentralThickness cutis (> 0.3 mm interlimb difference)0.330.930.26Thickness subcutis (> 20% interlimb difference)0.670.590.26Echogenicity cutis (disturbed)0.200.960.14Echogenicity subcutis (disturbed)0.130.960.09DorsalThickness cutis (> 0.3 mm interlimb difference)0.330.930.23Thickness subcutis (> 20% interlimb difference)0.200.63-0.17Echogenicity cutis (disturbed)0.271.000.27Echogenicity subcutis (disturbed)0.270.930.20BicepsThickness cutis (> 0.3 mm interlimb difference)0.140.860.00Thickness subcutis (> 20% interlimb difference)0.240.810.05Echogenicity cutis (disturbed)0.101.000.10Echogenicity subcutis (disturbed)0.140.900.04TricepsThickness cutis (> 0.3 mm interlimb difference)0.250.65-0.10Thickness subcutis (> 20% interlimb difference)0.670.670.34Echogenicity cutis (disturbed)0.241.000.24Echogenicity subcutis (disturbed)0.430.760.19Erdinç Gündüz et al.* [49], 2021USTape measurementsGrade 3 LEGrade 2 LEISL consensus criteria 2009; > 5 cm interlimb differenceUpper extremitiesBC unilateral34 (100)59.8 ± 10.7 > 0.22 cm interlimb difference0.800.750.55Giray and Yağcı [51], 2019USTape measurementsAll stages LENo LE > 200 ml interlimb differenceUpper extremitiesBC unilateral45 (NR)50.8 ± 8.7Subcutaneous tissue thickness > 0.17 cm interlimb difference0.790.690.48Riches et al*.* [43], 2023USClinical assessmentLENo LEPitting oedema present ≥ 1 breast quandrantBreastLower outer quadrantBC89 (NR)61.1 ± 9.6Skin thickness ≥ 2.3 mm0.840.870.71Lower inner quadrant ≥ 2.6 mm0.790.840.63Upper outer quadrant ≥ 2.5 mm0.920.920.84Upper inner quadrant ≥ 3.0 mm0.910.930.84Erdogan Iyigun et al*.* [50], 2019USISL 2013 consensus criteriaStage 2 LEStage 1 LEISL consensus criteria 2013Upper extremitiesBC unilateral36 (100)50.8 (30–69)Shear wave velocity > 1.78 m/s0.630.650.28Omura et al*.* [54], 2022USISL consensus criteria 2016Stage ≥ 1 LEStage 0 LEISL consensus criteria 2016Lower extremitiesNRISL stage0: 54 (89)1: 18 (89)IIa: 22 (95)IIb: 26 (89)ISL stage0: 60 ± 141: 57 ± 19IIa: 63 ± 12IIb: 68 ± 15Thickness (threshold NR)Dermis0.730.910.64Dermis SD0.590.640.23% echogenic region (threshold NR)Hypodermis0.690.730.42a part of Gaussian form factor (threshold NR)Dermis0.450.800.25Dermis, SD0.640.670.31Dermis, Combination0.550.730.28Hypodermis0.540.830.37Hypodermis, SD0.710.610.32Hypodermis, Combination0.840.490.33Effective scatter diameter (threshold NR)Dermis0.560.870.43Dermis, SD0.830.570.40Hypodermis0.610.600.21Hypodermis, SD0.460.740.20Effective acoustic concentration (threshold NR)Dermis0.540.930.47Dermis, SD0.780.760.54Hypodermis0.530.760.29Hypodermis, SD0.590.790.38Homodyned K distribution scatter clustering (threshold NR)Dermis0.610.570.18Dermis, SD0.680.590.27Hypodermis0.710.810.52Hypodermis, SD0.840.560.40Homodyned K distribution ratio of coherent to diffuse signal (threshold NR)Dermis0.730.730.46Dermis, SD0.900.360.26Hypodermis0.610.830.44Hypodermis, SD0.740.570.31Combination effective scatter diameter and effective acoustic concentration parametersDermis0.710.860.57Hypodermis0.440.930.37Combination homodyned K parametersDermis0.650.910.56Hypodermis0.750.810.56Combination effective scatter diameter, effective acoustic concentration and homodyned K parametersDermis0.730.890.62Hypodermis0.900.660.56Combination thickness effective scatter diameter and effective acoustic concentration parametersDermis0.710.960.67Combination echogenic region and homodyned K parametersHypodermis0.750.810.56Combination thickness, effective scatter diameter, effective acoustic concentration parameters for the dermis and echogenic region and homodyned K parameters for the hypodermis0.750.910.66Stage ≥ IIa LEStage ≤ 1 LEThickness (threshold NR)Dermis0.880.840.72Dermis SD0.590.590.18% echogenic region (threshold NR)Hypodermis0.800.690.49a part of Gaussian form factor (threshold NR)Dermis0.460.750.21Dermis, SD0.710.640.35Dermis, Combination0.570.670.24Hypodermis0.630.790.42Hypodermis, SD0.790.570.36Hypodermis, Combination0.910.450.36Effective scatter diameter (threshold NR)Dermis0.610.790.40Dermis, SD0.860.490.35Hypodermis0.610.540.15Hypodermis, SD0.540.730.27Effective acoustic concentration (threshold NR)Dermis0.700.900.60Dermis, SD0.860.670.53Hypodermis0.540.690.23Hypodermis, SD0.710.770.48Homodyned K distribution scatter clustering (threshold NR)Dermis0.500.46-0.04Dermis, SD0.700.530.23Hypodermis0.860.770.63Hypodermis, SD0.910.500.41Homodyned K distribution ratio of coherent to diffuse signal (threshold NR)Dermis0.790.650.44Dermis, SD0.910.300.21Hypodermis0.710.780.49Hypodermis, SD0.790.520.31Combination effective scatter diameter and effective acoustic concentration parametersDermis0.820.780.60Hypodermis0.500.870.37Combination homodyned K parametersDermis0.770.840.61Hypodermis0.890.760.65Combination effective scatter diameter, effective acoustic concentration and homodyned K parametersDermis0.860.810.67Hypodermis0.980.560.54Combination thickness effective scatter diameter and effective acoustic concentration parametersDermis0.860.870.73Combination echogenic region and homodyned K parametersHypodermis0.860.730.59Combination thickness, effective scatter diameter, effective acoustic concentration parameters for the dermis and echogenic region and homodyned K parameters for the hypodermis0.890.830.72Dylke et al*.* [55], 2018USNRLENo LENRBreastSuperiorBC38 (100)Range = 36–70Dermal thickness1.6 mm0.840.910.751.9 mm0.680.740.422.1 mm0.600.870.47Medial2.0 mm0.900.920.822.2 mm0.830.970.802.5 mm0.800.870.67Inferior2.0 mm0.900.920.822.1 mm0.830.950.782.4 mm0.800.870.67Lateral1.6 mm0.840.910.751.5 mm0.880.830.711.8 mm0.720.740.46Thomis et al*.* [33], 2020Clinical assessmentFluorescence lymphographyDermal backflow stage I-VNo dermal backflowDermal backflow stage:I: splash patternII: stardust pattern proximally to the olecranonIII: stardust pattern exceeds olecranonIV: stardust pattern whole armV: diffuse patternUpper extremities (unilateral)HandBC45 (NR)61.3 ± 9.9Pitting doubtful or clearly present0.540.950.49Ventral forearm0.830.670.50Dorsal forearm0.890.750.64Elbow0.580.580.16Ventral upper arm0.330.850.18Dorsal upper arm0.670.890.56Shoulder0.330.910.24Overall0.680.830.51HandInterlimb difference (increase) in skinfold thickness0.920.580.50Ventral forearm0.920.330.25Dorsal forearm0.920.750.67Elbow0.960.320.28Ventral upper arm0.560.820.38Dorsal upper arm0.890.440.33Shoulder0.330.810.14Overall0.870.620.49HandInterlimb difference (hard oedema) in elasticity0.231.000.23Ventral forearm0.330.890.22Dorsal forearm0.320.880.20Elbow0.070.950.02Ventral upper arm0.060.960.02Dorsal upper arm0.110.85-0.04Shoulder0.331.000.33Overall0.220.950.17Thomis et al*.* [30], 2022^c^Clinical assessmentFluorescence lymphographyDermal backflow stage I-IVNo dermal backflowDermal backflow stage:0: NoI: splash patternII: stardust patternIII: diffuse patternIV: no transportUpper extremitiesAll regionsBC unilateral128 (99)56.7 ± 12.2Pitting present0.190.980.17Increased skinfold thickness0.290.970.26Ventral upper armPitting present0.140.990.13Increased skinfold thickness0.290.970.26Svensson et al*.* [56], 2020Clinical assessmentMF-BIALENo LEInterlimb ratio > 2SD or 3SDUpper extremities (unilateral)BC100 (100)61.8 ± 10.6Pitting test, interlimb difference in depth and resolution time0.920.770.69Forearm pinch test, interlimb difference in tissue texture0.940.750.69Upper arm pinch test, interlimb difference in tissue texture0.730.770.50Chung et al*.* [57], 2006Cuff-leak testEndoscopySevere oedemaNo severe oedemaSwollen bilateral vocal cords and attachment to opposite side of the larynxLaryngealNot specified32 (34)71.3 ± 13.6Volume < 140 mL0.890.900.79Abbreviations: *BC* breast cancer, CT computed tomography, GC gynecological cancer, LE lymphedema, LSG lymphoscintigraphy, MF-BIA multi-frequency bioimpedance analysis, MRA magnetic resonance angiography, MRI magnetic resonance imaging, NR not reported, SF-BIA single-frequency bioimpedance analysis, TDC tissue dielectric constant, TKA total knee arthroplasty, US ultrasound, WV water volumetry^a^Partly same study population as Keo et al*.* [60]^b^Partly same study population as Berlit et al*. [35]^c^Partly same study population as Thomis et al. [33]^d^Partly same study population as Hayes et al. [24]^e^Data for full group (N = 193)^f^Unilaterality assumed since measurement instrument compares affected to unaffected side^g^Age at surgery^h^Partly same study population as Lu et al. [32]Table 3. Summary of the index and reference measurement instruments identified for measuring oedema in the included studiesCT* computed tomography, MF-BIA multi-frequency bioimpedance analysis, MRA magnetic resonance angiography, MRI magnetic resonance imaging, SF-BIA single-frequency bioimpedance analysis, TDC tissue dielectric constant
The studies evaluated various instruments for diagnosing soft-tissue oedema. Seventeen studies assessed volume measurement instruments, including perometry [17, 18], tape measurements [19–31], and water volumetry [21, 32, 33]. Sixteen studies focused on measurement instruments for tissue characteristics, involving bio-electrical impedance analysis (BIA) [17, 21, 29, 31, 34–41] and tissue-dielectric constant (TDC) [27, 30, 40, 42, 43]. Nineteen studies examined instruments measuring both volume and tissue characteristics, including CT [44], MRI [32, 45, 46], magnetic resonance angiography (MRA) [31], US [43, 47–55], clinical assessment [30, 33, 56], and cuff leak test [57]. Additionally, five studies evaluated the function of the lymphatic system using lymphoscintigraphy [31, 58] and fluorescence microlymphography [59–61].
Reference measurement instruments included volume measurements in 20 studies using perometry [31, 37, 61], tape measurements [19, 20, 26, 29, 35, 36, 38, 41, 42, 48, 49, 51] or water volumetry [21–23, 28, 34]. Tissue characteristics measurements served as reference in three studies using multi-frequency (MF)-BIA [24, 25, 29]. A combination of volume and tissue characteristics measurements was used as reference in 14 studies, involving clinical assessment [18, 39, 40, 43], consensus criteria [27, 32, 45, 46, 50, 54, 58–60] and endoscopy [57]. The lymphatic system function was used as reference in seven studies, using lymphoscintigraphy [17, 44, 47, 53], or fluorescence lymphography [30, 33, 52]. One study did not report the reference instrument [55].
The types of swelling considered were lymphoedema in 44 studies [17–28, 30–61] and postoperative swelling in one study [29]. Secondary lymphoedema arose from (treatment for) various conditions, including breast cancer [17–28, 30, 33–43, 48–51, 55, 56, 61], gynaecological cancer [32, 45, 52], or various causes [31, 44, 46, 47, 58]. In some cases, the cause of lymphoedema was unspecified [53, 54, 57, 59, 60]. The postoperative swelling study focused on total knee arthroplasty for osteoarthritis [29]. Of the 45 included studies, 30 focused on oedema in the upper extremities [17–28, 30, 31, 33–36, 38–42, 48–51, 56, 61], 10 in the lower extremities [29, 32, 45, 46, 52–54, 58–60], 2 in both upper and lower extremities [44, 47], 2 in the breast [43, 55] and 1 in the larynx [57], as illustrated in Table 4. The total number of participants across the studies was 4644, with 94% of the patients being female when gender was reported. Seven studies did not report gender distribution [22, 33, 38, 43, 46, 48, 51]. The mean or median age of participants ranged from 45.0 to 71.3 years. Table 4. Summary of the oedema location and stage per identified index measurement instruments in the included studiesCT computed tomography, MF-BIA multi-frequency bioimpedance analysis, MRA magnetic resonance angiography, MRI magnetic resonance imaging, N.R. not reported, SF-BIA single-frequency bioimpedance analysis
Risk of bias within studies
The quality assessment of the included studies is summarized in Table 5, with detailed assessment available in Supplementary information 3. According to QUADAS-2 assessment, no study was free from bias in all domains. Thirty-seven studies (82%) exhibited a high risk of bias in at least one domain [17–22, 24–26, 29–33, 35–39, 41, 43–51, 53–55, 57–61], while eight studies (18%) showed an unclear risk of bias in at least one domain [23, 27, 28, 34, 40, 42, 52, 56]. Common bias sources included unspecified patient enrolment, unspecified blinding, and non-prespecified thresholds. Nevertheless, all studies, except one [55], were considered applicable to the research question. All studies, except one [27], employed very good statistical methods as per COSMIN Box 8.
Table 5. Methodological quality assessment with QUADAS-2 and COSMIN Box 8
Best-evidence synthesis
Only two studies received three or more good quality scores on the QUADAS-2 risk of bias assessment, limiting the overall level of evidence for index measurements [33, 57]. Limited evidence was found for TDC, water volumetry, MRI, ultrasound, clinical assessment, and cuff leak test. Insufficient evidence was found for lymphoscintigraphy, fluorescence lymphography, SF-BIA, MF-BIA, perometry, tape measurements, CT, and MRA.
Oedema measurement instruments
Instruments assessing lymphatic system function
Lymphoscintigraphy (LSG), using a radioactive tracer, was reported in two studies as an index measurement instrument, demonstrating insufficient evidence with a conflicting diagnostic value (Youden index = 0.29–0.80) [31, 58]. LSG was applied to both upper and lower extremities to quantify lymphoedema by assessing the presence of dermal backflow and the uptake of the radiotracer.
Fluorescence lymphography, e.g. indocyanine green (ICG) lymphography or near-infrared fluorescence imaging (NIRF), was assessed in three studies, although two of these included overlapping populations. Lymphoscintigraphy displayed insufficient evidence with a conflicting diagnostic value (Youden index = 0.22–0.78) for lower extremities, where the diagnosis of lymphoedema was based on the maximum spread of the fluorescent dye [59, 60]. A moderate diagnostic value (Youden index = 0.47) was reported for mild and moderate lymphoedema in upper extremities by measuring dermal backflow [61].
Instruments assessing tissue characteristics
Single-frequency (SF) bio-impedance analysis (BIA) was reported in three studies as an index measurement instrument for upper extremities, showing insufficient evidence with a moderate to high diagnostic value (Youden index = 0.58–0.83) [35, 36, 41]. Multi-frequency (MF) BIA, also known as bio-impedance spectroscopy, was evaluated in nine studies. MF-BIA showed insufficient evidence with a conflicting diagnostic value (Youden index = 0.36–0.98) across both upper and lower extremities [17, 21, 29, 31, 34, 37–40]. Notably, for mild lymphoedema in upper extremities, MF-BIA displayed a very high diagnostic value with a Youden index of 0.98, although the risk of bias was unclear to high [38]. Mild and moderate lymphoedema in upper extremities had moderate to high Youden indexes (0.63–0.80) with also an unclear to high risk of bias [17]. In the context of post-operative swelling, MF-BIA exhibited very high diagnostic accuracy (Youden index = 0.92–0.96) by measuring the interlimb difference; however, there was a high risk of bias on two domains of QUADAS-2 [29]. MF-BIA often assessed lymphoedema by evaluating the L-DEX ratio, which compares the impedance of extracellular fluid between the unaffected and affected body parts, with MF-BIA’s ability to distinguish between intracellular and extracellular fluids, in contrast to SF-BIA.
Tissue dielectric constant (TDC) was reported in six studies, presenting limited evidence with a conflicting diagnostic value (Youden index = −0.04 to 0.68) [27, 30, 33, 40, 42, 43]. The Youden index could not be calculated in one study that assessed mild and moderate lymphoedema in the upper extremities [27]. A high-quality study comparing TDC with fluorescence lymphography for all stages of lymphoedema in the upper extremities demonstrated conflicting Youden indexes (−0.04 to 0.52) [33]. Another high-quality study compared TDC with clinical assessment in the breast, showing a moderate Youden index of 0.68 [43]. In all studies, lymphoedema was diagnosed by measuring the water content ratio between affected and unaffected body parts using TDC.
Instruments assessing volume
Perometry was evaluated in two studies as an index measurement instrument, demonstrating insufficient evidence with a conflicting diagnostic value (Youden index = 0.17–0.90) in the upper extremities [17, 18]. For the diagnosis of mild and moderate lymphoedema, perometry yielded moderate to very high Youden indexes (0.57–0.90) with an unclear to high risk of bias [17]. The highest Youden index (0.90) was observed when diagnosing oedema using a single elevated circumference, with LSG serving as the reference instrument [17]. In addition to obtaining circumference measurements, volume was also calculated based on the circumference or perometry directly measured volume.
Tape measurements, reported in 13 studies, showed insufficient evidence with a conflicting diagnostic value (Youden index = −0.31 to 0.84) [19–31]. The Youden index could not be calculated in one study that assessed mild and moderate lymphoedema in the upper extremities [27]. For the diagnosis of moderate lymphoedema in the upper extremities, tape measurements yielded moderate Youden indexes (0.46–0.64) when comparing circumferences to calculated volumes, though the studies exhibited a high risk of bias in three domains of the QUADAS-2 [19]. Tape measurements were also applied in the lower extremities. Across the studies, tape measurements were used to evaluate differences between affected and unaffected limbs in 12 studies [19, 21–29, 31], while one study measured differences from the baseline [20]. The method involved measuring various circumferences, and sometimes volume was calculated based on these circumferences.
Water volumetry, evaluated in three studies, displayed limited evidence with a conflicting diagnostic value (Youden index = 0.01–0.82) [21, 32, 33]. In one high-quality study comparing water volumetry with fluorescence lymphography, conflicting Youden indexes (0.01 to 0.72) were reported for the upper extremities [33]. In the lower extremities, water volumetry was used to assess mild, moderate, and severe lymphoedema, yielding weak to high Youden indexes (mild, 0.55–0.62; moderate, 0.39–0.70; severe, 0.77–0.82), with an unclear or high risk of bias in two domains of the QUADAS-2 [32]. All three studies focused on evaluating the volume difference between the affected and unaffected sides. Additionally, one of these studies assessed the diagnostic accuracy of water volumetry using the absolute limb volume, resulting in Youden indexes ranging from 0.39 to 0.82 [32].
Imaging techniques assessing both tissue characteristics and volume
Computed tomography (CT) was reported in one study as an index measurement instrument, showing insufficient evidence with a weak diagnostic value (Youden index = 0.31–0.38) for diagnosing moderate and severe lymphoedema in upper and lower extremities [44]. The diagnosis of oedema using CT was based on the ratio of the number of pixels of the tissue layer between skin and muscle between the affected and unaffected sides.
Magnetic resonance imaging (MRI), assessed in three studies, displayed limited evidence with a conflicting diagnostic value (Youden index = −0.13 to 1.00). MRI was used to evaluate mild, moderate, and severe lymphoedema, with each stage showing conflicting Youden indexes (mild, 0.19–1.00; moderate, 0.21–0.82; severe, −0.13 to 0.87) [32, 45, 46]. Notably, very high Youden indexes were observed for diagnosing mild lymphoedema by measuring the difference in subcutaneous tissue thickness between affected and unaffected limbs (Youden index = 0.96) [32] and assessing the absolute water area (Youden index = 1.00) [46]. MRI measurements involved the thickness or area of specific tissue, allowing for the differentiation between water, muscle, subcutaneous tissue, and total soft tissue.
Magnetic resonance angiography (MRA) was evaluated in a single study, providing insufficient evidence with weak to moderate diagnostic value (Youden index = 0.38–0.60) for all stages of lymphoedema in the upper extremities [31]. The diagnosis of lymphoedema using MRI was based on measurements of fluid accumulation and fat hypertrophy.
Ultrasound (US) was evaluated in ten studies, showing limited evidence with a conflicting diagnostic value (Youden index = −0.17 to 0.84) [43, 47–55]. Among these studies, three were of high quality. One high-quality study compared US to clinical assessment and found moderate to high diagnostic value (Youden index = 0.63–0.84) in the breast [43]. Another high-quality study compared US to LSG across all stages of lymphoedema, showing moderate diagnostic value (Youden index = 0.50–0.69) for US in both upper and lower extremities [47]. A third high-quality study compared US to tape measurements for severe lymphoedema in the upper extremities, also demonstrating moderate diagnostic value (Youden index = 0.55) for US [49]. For other stages and locations, the Youden indexes were weak for moderate and severe lymphoedema in the lower extremities (0.18–0.64) [54], conflicting for lymphoedema in the breast (0.42–0.82) [55] and conflicting for mild (−0.17 to 0.75) [48] or moderate lymphoedema (0.28) [50] in the upper extremities. Besides, each of these studies had a risk of bias.
Various outcome parameters were measured using US, with some showing high diagnostic value. For instance, the thickness of the skin yielded Youden indexes as high as 0.84 [43] and the thickness of the dermis reached up to 0.82 [54, 55]. Disturbed echogenicity of the cutis was another parameter with high diagnostic value, achieving a Youden index up to 0.75 [48]. Additionally, some calculated parameters based on algorithmic schemes and mathematical formulas, such as Shannon entropy (Youden index = 0.83) [53] or a combination of various calculated parameters (Youden index up to 0.73) [54], showed strong diagnostic performance. Other outcomes, such as share wave velocity [47, 50], which depends on the tissue density, and the presence of dilated or sclerotic lymphedema vessels [52], demonstrated lower diagnostic value.
Other methods assessing both tissue characteristics and volume
Clinical assessment was evaluated in three studies as an index measurement instrument, showing limited evidence with a conflicting diagnostic value (Youden index = −0.04 to 0.69) in the upper extremities [30, 33, 56]. Clinical assessment involved evaluating the presence of pitting, increased skinfold thickness, and deviations in tissue texture. In one high-quality study that compared clinical assessment with fluorescence lymphography, the Youden indexes for the presence of pitting and increased skinfold thickness were weak, ranging from 0.13 to 0.26 [33].
Cuff-leak test was reported once, showing limited evidence with a high diagnostic value (Youden index = 0.79) for laryngeal oedema. Endoscopy was used as the reference instrument [57].
Discussion
This systematic review aimed to identify measurement instruments for quantitatively diagnosing soft-tissue oedema, including lymphoedema, across any body part and their diagnostic accuracy. The findings highlight both advancements and ongoing challenges in accurately diagnosing lymphoedema.
Our review identified a variety of instruments focused on measuring volume, tissue characteristics, and lymphatic system function. Tape measurements, US, and MF-BIA were the most frequently studied. Index instruments with very high diagnostic value (Youden index ≥ 0.90) included MF-BIA, perometry, and MRI. However, when considering the quality of these studies, evidence is lacking. Limited evidence was found for TDC, water volumetry, MRI, US, clinical assessment, and cuff leak test, while insufficient evidence was found for lymphoscintigraphy, fluorescence lymphography, SF-BIA, MF-BIA, perometry, tape measurements, CT, and MRA. These methodological limitations require cautious interpretation of the current evidence.
Interpretation of evidence is also hampered by the absence of a universal gold standard, resulting in the use of various measurement instruments as reference, making comparisons between studies challenging. The most used reference instruments were tape measurements, consensus criteria, and water volumetry, applied in 12, nine, and five studies, respectively. The frequent use of water volumetry aligns with recommendations from an earlier review suggesting it as the preferred reference standard [23]. The suitability of instruments as a reference depends on the body part being assessed and the stage of lymphoedema. In ISL stage 0, only impaired lymph transport and subtle changes in tissue fluid or composition can be measured, while volumetric measurement becomes more relevant in later stages [2, 9]. Furthermore, a single body part may present with multiple stages simultaneously [2].
Effective lymphoedema management relies on early detection, ideally before irreversible changes such as fibrotic tissue formation occur. The diagnostic accuracy of index measurement instruments for early lymphedema was evaluated for MF-BIA, TDC, tape measurements, water volumetry, MRI, and US in extremities. Diagnostic value was very high for MF-BIA, weak to high for water volumetry, conflicting for MRI and ultrasound, and could not be determined for TDC and tape measurements. However, all evidence was restricted by the limited number of studies.
Strength and limitations
A key strength of this review is the inclusion of a wide variety of instruments and parameters for diagnosing lymphoedema. However, the inclusion of various instruments and parameters and lack of a uniform and reliable gold (reference) standard precluded meta-analysis and poses a challenge in assessing potential publication bias. This precluded standard methods like funnel plots or Egger’s test for a comprehensive evaluation. Although a best-evidence synthesis was conducted to summarize the overall level of evidence per instrument, it did not account for potential bias in subgroup outcomes for oedema stages or locations.
Implications for clinical practice
Given the chronic and progressive nature of lymphoedema, early detection is critical for effective management. Despite the extensive range of instruments studied, no single instrument emerged as a definitive gold standard for diagnosing lymphoedema. This finding reflects the multifaceted nature of lymphoedema, which manifests through various physical changes including fluid accumulation and tissue fibrosis. Consequently, the choice of measurement instrument should depend on the specific clinical context and the stage of lymphoedema. However, this review found insufficient evidence on the diagnostic accuracy of specific instruments to recommend their use in particular stages, especially the early stage. Practical tools like tape measurements, consensus criteria, and water volumetry are commonly used because they are inexpensive and easy to use, while advanced imaging techniques may be more appropriate for complex cases (e.g. presence of significant comorbidity) [2] or research settings.
Recommendations
To enhance the early detection and treatment of lymphoedema, it is essential to focus on several key areas. First, developing standardized protocols for lymphoedema measurement is crucial to reduce variability and improve comparability across studies. This standardization would help in establishing more consistent and reliable diagnostic criteria. In addition, there is a need for comprehensive evaluations through high-quality studies that assess the diagnostic accuracy of measurement instruments. Such studies should aim to fill the gaps in current knowledge and provide robust evidence to support clinical decision-making. Exploring the integration of different measurement techniques could also be beneficial. By combining various tools, healthcare providers may achieve a more accurate and comprehensive assessment of lymphoedema, which could improve diagnosis and management strategies.
In conclusion, this systematic review underscores the complexity of accurately diagnosing lymphoedema. While several measurement instruments are available, there remains a need for more high-quality research to improve standardization. Clinicians must carefully consider the available evidence and the specific clinical context, for example, early detection, when selecting measurement instruments for diagnosing lymphoedema.
Supplementary Information
Below is the link to the electronic supplementary material.Supplementary Material 1 (PDF 316 KB)Supplementary Material 2 (PDF 113 KB)Supplementary Material 3 (PDF 30.2 KB)