Investigation of nutritional and functional roles of β-mannanase on intestinal health and growth performance of nursery pigs fed low-cost formulated diets with high phytase inclusion
Hyunjun Choi, Zixiao Deng, Adebayo Sokale, Elke Von Heimendahl, Ahmed M Amerah, Sung Woo Kim

TL;DR
Low-cost diets with high phytase reduced pig growth and gut health, but adding β-mannanase helped restore performance and digestion.
Contribution
This study demonstrates that β-mannanase can mitigate the negative effects of low-cost diets with high phytase inclusion in nursery pigs.
Findings
Low-cost diets increased jejunal IL-8 and reduced ileal digestibility of ether extract in pigs.
β-mannanase supplementation decreased jejunal IL-6 and improved ileal digestibility of ether extract.
β-mannanase improved growth performance while maintaining feed cost efficiency in low-cost diets.
Abstract
The objective of this study was to investigate the impacts of low-cost formulated diets (LCD) with high phytase inclusion on intestinal health and growth performance of nursery pigs, and roles of β-mannanase in mitigating these impacts. Thirty-six pigs (6.2 ± 0.2 kg initial body weight; BW) were individually housed and assigned to three dietary treatments in a randomized complete block design (n = 12 per treatment), with initial BW (light, medium, and heavy) and sex (barrows and gilts) as blocking factors. Pigs were fed for 42 d in three phases of 10, 10, and 22 d, respectively. The LCD contained 14% more soybean meal than the control diet (CON). Treatments included: 1) CON, 2) LCD, and 3) LCD with 800 TMU/kg of β-mannanase (LCD + β-mannanase), in which β-mannanase was added at the expense of corn. All diets were supplemented with 3,000 FTU/kg of phytase. On d 20 and 42, 18 pigs (n = 6…
Genes, proteins, chemicals, diseases, species, mutations and cell lines named across the full text — each resolved to its canonical identifier and authoritative record.
Click any figure to enlarge with its caption.
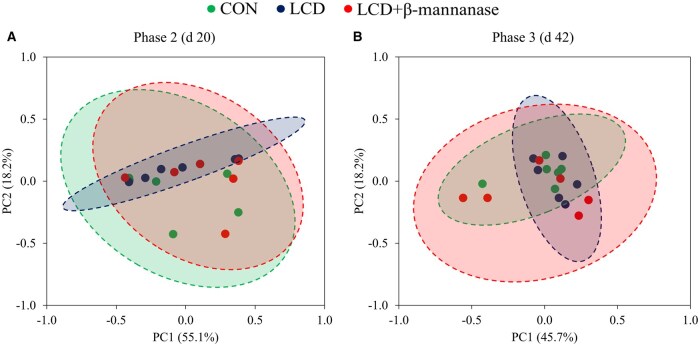 Figure 1
| Phase 1 | Phase 2 | Phase 3 | ||||
|---|---|---|---|---|---|---|
| Item | CON | LCD | CON | LCD | CON | LCD |
|
| ||||||
| | 44.24 | 39.21 | 56.33 | 51.24 | 70.13 | 62.59 |
| | 16.00 | 30.00 | 17.00 | 31.00 | 20.50 | 34.50 |
| | 6.00 | – | 6.00 | – | 6.00 | – |
| | 4.00 | 3.00 | 2.00 | 2.00 | – | – |
| | 3.00 | 2.00 | 2.00 | – | – | – |
| | 4.00 | 3.00 | 1.50 | – | – | – |
| | – | – | – | 0.55 | – | – |
| | 20.00 | 20.00 | 12.00 | 12.00 | – | – |
| | 0.37 | 0.31 | 0.45 | 0.42 | 0.46 | 0.24 |
| | 0.17 | 0.16 | 0.17 | 0.17 | 0.14 | 0.08 |
| | 0.13 | 0.10 | 0.14 | 0.14 | 0.13 | 0.04 |
| | – | – | 0.04 | 0.04 | – | – |
| | – | – | – | – | 0.15 | 0.12 |
| | 0.70 | 0.82 | 0.98 | 1.06 | 1.11 | 1.05 |
| | 0.14 | 0.14 | 0.14 | 0.14 | 0.14 | 0.14 |
| | 0.03 | 0.03 | 0.03 | 0.03 | 0.03 | 0.03 |
| | 0.22 | 0.22 | 0.22 | 0.22 | 0.22 | 0.22 |
| | 1.00 | 1.00 | 1.00 | 1.00 | 0.60 | 0.60 |
| | – | – | – | – | 0.40 | 0.40 |
|
| 782 | 695 | 544 | 448 | 323 | 304 |
|
| ||||||
| | 91.63 | 91.48 | 90.24 | 90.12 | 88.79 | 88.75 |
| | 3,377 | 3,339 | 3,339 | 3,326 | 3,317 | 3,296 |
| | 23.28 | 24.05 | 20.82 | 21.22 | 19.60 | 21.99 |
| | 1.487 | 1.487 | 1.336 | 1.336 | 1.217 | 1.217 |
| | 0.816 | 0.816 | 0.735 | 0.735 | 0.676 | 0.676 |
| | 0.872 | 0.872 | 0.781 | 0.781 | 0.722 | 0.722 |
| | 0.251 | 0.266 | 0.215 | 0.223 | 0.202 | 0.238 |
| | 0.950 | 0.956 | 0.859 | 0.859 | 0.780 | 0.866 |
| | 0.680 | 0.680 | 0.630 | 0.630 | 0.530 | 0.530 |
| | 0.378 | 0.341 | 0.261 | 0.231 | 0.154 | 0.154 |
| | 0.60 | 0.73 | 0.70 | 0.83 | 0.85 | 0.96 |
| | 0.30 | 0.47 | 0.33 | 0.51 | 0.41 | 0.57 |
|
| ||||||
| | 89.37 | 89.29 | 88.08 | 87.88 | 87.30 | 87.16 |
| | 23.25 | 23.4 | 18.21 | 19.73 | 18.22 | 20.75 |
| | 2.82 | 2.64 | 3.15 | 3.11 | 3.00 | 2.89 |
| | 6.24 | 5.73 | 4.45 | 4.58 | 6.07 | 7.53 |
| | 2.14 | 2.33 | 2.08 | 2.37 | 3.30 | 3.76 |
| | 0.94 | 0.98 | 0.74 | 0.72 | 0.60 | 0.61 |
| | 0.60 | 0.59 | 0.44 | 0.44 | 0.37 | 0.40 |
| Diet: | CON | LCD | |
|---|---|---|---|
| β-mannanase, TMU/kg: | - | - | 800 |
|
| |||
| | 3,200 | 3,190 | 3,370 |
| | 3,220 | 3,170 | 3,390 |
| | 3,680 | 3,420 | 3,230 |
|
| |||
| | <100 | <100 | 1,040 |
| | <100 | <100 | 1,170 |
| | <100 | <100 | 1,310 |
| Gene | Primer sequence (5’ – 3’) | Accession number | Product size, bp |
|---|---|---|---|
|
| Forward: GGGCTGCGTTCATTCATCAG | 132 | |
| Reverse: CTGCAGAGGATGGATGGCAA | |||
|
| Forward: CGTGCAGGTGGTTCCTAACA | 326 | |
| Reverse: GGTTTGTCTCAACGGCAACC | |||
|
| Forward: AACACCGATCCAGTGAGCAG | 230 | |
| Reverse: AAATGGTCTCGCCCTCCTTG | |||
|
| Forward: GTGCCTCCCCTCTAGACTCA | 191 | |
| Reverse: ACGAACCAGGAAGCCAAGAG | |||
|
| Forward: CCCTGCCAAATAGACGACGA | 299 | |
| Reverse: TCGAGCGTCAGTTCCTTGAG | |||
|
| Forward: GCTGGAATGAAGCACGGAAC | 236 | |
| Reverse: GCAAGTTGCATGGCCTTCTC | |||
|
| Forward: GGCCATTCAAAGGAGCATGG | 199 | |
| Reverse: AAGCTCATCTCACCGGAATTT | |||
|
| Forward: TCGGAGTGAACGGATTTGGC | 20 | |
| Reverse: TGCCGTGGGTGGAATCATAC |
| Diet: | CON | LCD |
| |||
|---|---|---|---|---|---|---|
| β-mannanase, TMU/kg: | - | - | 800 | SEM | CON vs. LCD | LCD vs. LCD + β-mannanase |
|
| ||||||
|
| 33.72 | 43.67 | 48.32 | 7.76 | 0.168 | 0.502 |
|
| 1.36 | 1.70 | 1.76 | 0.23 | 0.244 | 0.854 |
|
| 0.56 | 0.68 | 0.67 | 0.08 | 0.231 | 0.938 |
|
| ||||||
|
| 58.67 | 48.50 | 46.33 | 4.75 | 0.156 | 0.752 |
|
| 2.18 | 2.04 | 1.85 | 0.16 | 0.565 | 0.415 |
|
| 0.80 | 0.77 | 0.68 | 0.04 | 0.683 | 0.136 |
| Diet: | CON | LCD |
| |||
|---|---|---|---|---|---|---|
| β-mannanase, TMU/kg: | - | - | 800 | SEM | CON vs. LCD | LCD vs. LCD + β-mannanase |
|
| ||||||
|
| 75.9 | 69.1 | 74.5 | 6.9 | 0.410 | 0.514 |
|
| 13.4 | 20.4 | 13.7 | 4.8 | 0.310 | 0.330 |
|
| 9.4 | 6.2 | 8.4 | 5.0 | 0.614 | 0.728 |
|
| 0.6 | 2.0 | 1.3 | 0.6 | 0.116 | 0.393 |
|
| 0.1 | 0.3 | 0.2 | 0.1 | 0.046 | 0.222 |
|
| 0.7 | 2.0 | 1.4 | 0.8 | 0.242 | 0.607 |
|
| ||||||
|
| 70.2 | 56.1 | 64.0 | 4.9 | 0.067 | 0.281 |
|
| 24.7 | 29.8 | 18.7 | 6.4 | 0.392 | 0.076 |
|
| 1.0 | 10.5 | 8.0 | 6.2 | 0.102 | 0.648 |
|
| 2.1 | 2.0 | 6.2 | 2.5 | 0.976 | 0.143 |
|
| 1.6 | 1.3 | 1.1 | 0.5 | 0.598 | 0.792 |
|
| 0.4 | 0.3 | 2.1 | 0.7 | 0.919 | 0.103 |
| Diet: | CON | LCD |
| |||
|---|---|---|---|---|---|---|
| β-mannanase, TMU/kg: | - | - | 800 | SEM | CON vs. LCD | LCD vs. LCD + β-mannanase |
|
| ||||||
|
| 44.56 | 46.75 | 50.00 | 7.18 | 0.826 | 0.745 |
|
| 11.07 | 18.55 | 10.89 | 4.71 | 0.267 | 0.257 |
|
| 9.34 | 5.50 | 7.93 | 5.01 | 0.543 | 0.699 |
|
| 2.29 | 4.55 | 6.77 | 1.56 | 0.310 | 0.319 |
|
| 1.24 | 3.77 | 7.29 | 2.40 | 0.455 | 0.303 |
|
| 0.52 | 0.32 | 0.69 | 0.37 | 0.656 | 0.410 |
|
| 1.54 | 6.93 | 5.02 | 2.74 | 0.154 | 0.597 |
|
| 2.74 | 2.85 | 1.46 | 1.05 | 0.912 | 0.186 |
|
| 1.36 | 1.38 | 1.69 | 0.55 | 0.977 | 0.681 |
|
| 0.34 | 0.68 | 0.57 | 0.27 | 0.387 | 0.773 |
|
| 21.30 | 0.10 | 1.04 | 10.46 | 0.118 | 0.941 |
|
| 0.35 | 1.43 | 0.64 | 0.47 | 0.122 | 0.245 |
|
| 2.25 | 1.30 | 2.32 | 0.60 | 0.248 | 0.214 |
|
| <0.01 | 0.02 | 0.08 | 0.02 | 0.531 | 0.027 |
|
| 0.02 | 0.13 | 0.15 | 0.06 | 0.252 | 0.831 |
|
| <0.01 | 0.02 | <0.01 | 0.01 | 0.094 | 0.049 |
|
| 0.15 | 0.63 | 0.20 | 0.18 | 0.034 | 0.052 |
|
| 0.09 | 0.30 | 0.17 | 0.08 | 0.050 | 0.204 |
|
| 0.16 | 0.38 | 0.32 | 0.13 | 0.229 | 0.766 |
|
| 1.28 | 4.42 | 3.60 | 1.26 | 0.088 | 0.631 |
|
| ||||||
|
| 24.44 | 27.72 | 29.51 | 8.10 | 0.755 | 0.864 |
|
| 22.05 | 25.43 | 17.01 | 5.56 | 0.557 | 0.158 |
|
| 0.24 | 8.73 | 6.98 | 6.07 | 0.156 | 0.760 |
|
| 7.50 | 6.57 | 7.75 | 3.02 | 0.747 | 0.682 |
|
| 3.78 | 2.77 | 6.00 | 2.19 | 0.637 | 0.149 |
|
| 7.07 | 2.71 | 7.70 | 3.51 | 0.372 | 0.309 |
|
| 2.34 | 2.49 | 1.34 | 1.21 | 0.909 | 0.369 |
|
| 3.80 | 2.46 | 2.98 | 1.10 | 0.317 | 0.696 |
|
| 6.23 | 3.30 | 2.71 | 1.91 | 0.197 | 0.788 |
|
| 8.23 | 3.45 | 0.61 | 2.71 | 0.215 | 0.452 |
|
| 1.64 | 0.72 | 0.67 | 0.45 | 0.141 | 0.946 |
|
| 1.51 | 0.94 | 4.97 | 2.03 | 0.818 | 0.121 |
|
| 1.95 | 3.36 | 1.01 | 0.61 | 0.034 | 0.002 |
|
| 2.65 | 1.77 | 1.74 | 0.72 | 0.404 | 0.974 |
|
| 0.20 | 0.17 | 0.36 | 0.20 | 0.925 | 0.428 |
|
| 0.31 | 0.47 | 0.32 | 0.29 | 0.684 | 0.706 |
|
| 0.33 | 0.86 | 1.15 | 0.70 | 0.537 | 0.733 |
|
| 1.60 | 1.27 | 1.05 | 0.54 | 0.595 | 0.724 |
|
| 0.44 | 0.54 | 0.43 | 0.30 | 0.743 | 0.721 |
|
| 3.69 | 4.28 | 5.72 | 1.66 | 0.784 | 0.508 |
| Diet: | CON | LCD |
| |||
|---|---|---|---|---|---|---|
| β-mannanase, TMU/kg: | - | - | 800 | SEM | CON vs. LCD | LCD vs. LCD + β-mannanase |
|
| ||||||
| | 44.56 | 46.75 | 49.99 | 7.17 | 0.826 | 0.746 |
| | 11.07 | 18.55 | 10.89 | 4.71 | 0.267 | 0.257 |
| | 9.34 | 5.50 | 7.93 | 5.01 | 0.543 | 0.698 |
| | 0.52 | 0.32 | 0.68 | 0.37 | 0.659 | 0.425 |
| | 1.54 | 6.93 | 5.02 | 2.74 | 0.154 | 0.597 |
| | 0.70 | 2.04 | 3.22 | 0.95 | 0.323 | 0.385 |
| | 0.34 | 0.68 | 0.56 | 0.27 | 0.386 | 0.761 |
| | 0.37 | 1.26 | 1.67 | 0.39 | 0.124 | 0.457 |
| | <0.01 | 0.02 | 0.08 | 0.02 | 0.532 | 0.027 |
| | 21.20 | 0.04 | 0.80 | 10.45 | 0.119 | 0.953 |
| | 0.40 | 1.39 | 2.71 | 0.68 | 0.306 | 0.184 |
| | 0.11 | 0.31 | 0.39 | 0.17 | 0.350 | 0.693 |
| | 1.12 | 1.20 | 0.86 | 0.62 | 0.872 | 0.504 |
| | 1.74 | 0.85 | 1.69 | 0.54 | 0.223 | 0.246 |
| | 0.11 | 0.49 | 0.38 | 0.16 | 0.110 | 0.645 |
| | 0.02 | 0.13 | 0.10 | 0.06 | 0.186 | 0.730 |
| | 0.21 | 0.89 | 0.22 | 0.33 | 0.159 | 0.161 |
| | <0.01 | 0.02 | <0.01 | 0.01 | 0.098 | 0.050 |
| | 0.84 | 0.74 | 0.14 | 0.37 | 0.774 | 0.111 |
| | 0.24 | 0.49 | 2.41 | 0.94 | 0.851 | 0.164 |
| | 0.15 | 0.63 | 0.20 | 0.18 | 0.033 | 0.052 |
| | 6.00 | 10.76 | 10.96 | 2.54 | 0.197 | 0.954 |
|
| ||||||
| | 24.44 | 27.72 | 29.51 | 8.10 | 0.755 | 0.864 |
| | 22.05 | 25.43 | 17.01 | 5.56 | 0.557 | 0.158 |
| | 0.24 | 8.73 | 6.98 | 6.07 | 0.156 | 0.760 |
| | 7.07 | 2.71 | 7.70 | 3.51 | 0.372 | 0.309 |
| | 2.33 | 2.49 | 1.34 | 1.21 | 0.902 | 0.368 |
| | 2.27 | 1.78 | 4.20 | 1.60 | 0.753 | 0.138 |
| | 8.20 | 3.44 | 0.57 | 2.71 | 0.215 | 0.446 |
| | 2.54 | 3.71 | 3.13 | 1.80 | 0.545 | 0.762 |
| | 2.65 | 1.77 | 1.74 | 0.72 | 0.404 | 0.974 |
| | 0.04 | <0.01 | <0.01 | 0.01 | 0.056 | 0.941 |
| | 1.96 | 1.32 | 1.67 | 1.01 | 0.576 | 0.756 |
| | 4.86 | 1.81 | 1.95 | 2.02 | 0.188 | 0.950 |
| | 1.82 | 1.33 | 0.97 | 0.64 | 0.511 | 0.627 |
| | 1.23 | 2.94 | 0.69 | 0.55 | 0.005 | 0.001 |
| | 0.99 | 0.60 | 2.16 | 1.00 | 0.705 | 0.142 |
| | 0.19 | 0.17 | 0.35 | 0.19 | 0.920 | 0.434 |
| | 0.47 | 0.30 | 2.75 | 1.15 | 0.918 | 0.159 |
| | 0.31 | 0.47 | 0.32 | 0.29 | 0.684 | 0.706 |
| | 1.32 | 0.77 | 1.22 | 0.45 | 0.378 | 0.469 |
| | 0.90 | 0.57 | 0.48 | 0.27 | 0.385 | 0.830 |
| | 0.33 | 0.86 | 1.15 | 0.70 | 0.537 | 0.733 |
| | 13.78 | 11.09 | 14.11 | 3.49 | 0.542 | 0.495 |
| Diet: | CON | LCD |
| |||
|---|---|---|---|---|---|---|
| β-mannanase, TMU/kg: | - | - | 800 | SEM | CON vs. LCD | LCD vs. LCD + β-mannanase |
|
| ||||||
| | 19.38 | 15.13 | 22.14 | 6.29 | 0.629 | 0.430 |
| | 8.19 | 5.50 | 3.20 | 4.23 | 0.600 | 0.652 |
| | 5.36 | 12.51 | 4.93 | 3.30 | 0.141 | 0.121 |
| | 0.02 | 1.15 | 0.13 | 0.79 | 0.304 | 0.350 |
| | 6.46 | 7.99 | 5.29 | 2.40 | 0.646 | 0.425 |
| | 8.55 | 8.95 | 7.97 | 3.06 | 0.916 | 0.793 |
| | 5.70 | 4.87 | 5.81 | 2.21 | 0.788 | 0.760 |
| | 0.34 | 0.04 | 0.54 | 0.29 | 0.425 | 0.199 |
| | 1.98 | 1.49 | 2.67 | 1.50 | 0.813 | 0.571 |
| | 3.36 | 1.54 | 1.95 | 2.04 | 0.526 | 0.884 |
| | 0.62 | 1.64 | 1.61 | 0.83 | 0.388 | 0.980 |
| | 21.20 | 0.04 | 0.80 | 10.45 | 0.119 | 0.953 |
| | <0.01 | 0.01 | 0.03 | 0.02 | 0.733 | 0.364 |
| | 1.10 | 1.19 | 0.85 | 0.61 | 0.864 | 0.513 |
| | 0.93 | <0.01 | 4.93 | 2.76 | 0.808 | 0.217 |
| | 0.01 | <0.01 | 0.01 | 0.01 | 0.152 | 0.385 |
| | 0.25 | 2.99 | 1.64 | 1.25 | 0.124 | 0.426 |
| | 0.21 | 4.50 | <0.01 | 2.74 | 0.248 | 0.228 |
| | 0.02 | 0.08 | 0.08 | 0.05 | 0.371 | 0.961 |
| | 1.55 | 0.61 | 1.31 | 0.52 | 0.161 | 0.286 |
| | <0.01 | 0.02 | <0.01 | 0.01 | 0.098 | 0.050 |
| | 0.06 | 0.34 | 0.20 | 0.16 | 0.209 | 0.517 |
| | 0.29 | 1.24 | 1.32 | 0.50 | 0.191 | 0.900 |
| | 0.20 | 0.81 | 0.21 | 0.29 | 0.150 | 0.153 |
| | 0.19 | 0.31 | 1.52 | 0.25 | 0.720 | 0.005 |
| | 0.43 | 0.35 | 1.96 | 0.96 | 0.946 | 0.227 |
| | 0.31 | 1.19 | 0.96 | 0.40 | 0.141 | 0.684 |
| | 0.24 | 0.29 | 2.21 | 0.89 | 0.967 | 0.142 |
| | 13.57 | 22.66 | 23.00 | 4.79 | 0.191 | 0.959 |
|
| ||||||
| | 10.11 | 16.26 | 12.98 | 4.49 | 0.306 | 0.579 |
| | 0.24 | 7.90 | 6.97 | 5.63 | 0.154 | 0.857 |
| | 10.41 | 10.30 | 7.42 | 2.62 | 0.978 | 0.451 |
| | 11.28 | 15.05 | 9.06 | 4.72 | 0.369 | 0.165 |
| | 4.12 | 4.38 | 5.22 | 1.92 | 0.919 | 0.743 |
| | 1.47 | 0.28 | 0.27 | 0.74 | 0.236 | 0.985 |
| | 0.28 | 0.05 | 0.51 | 0.13 | 0.234 | 0.026 |
| | 7.01 | 2.59 | 7.52 | 3.43 | 0.359 | 0.307 |
| | 2.84 | 2.63 | 6.44 | 1.89 | 0.939 | 0.170 |
| | 3.48 | 2.05 | 3.10 | 0.98 | 0.327 | 0.466 |
| | 0.09 | 0.03 | <0.01 | 0.05 | 0.356 | 0.649 |
| | 0.04 | <0.01 | <0.01 | 0.01 | 0.056 | 0.941 |
| | 2.42 | 1.51 | 1.59 | 0.71 | 0.382 | 0.939 |
| | 1.80 | 1.32 | 0.96 | 0.63 | 0.520 | 0.620 |
| | 0.00 | 0.84 | 0.01 | 0.48 | 0.244 | 0.248 |
| | 4.19 | 1.31 | 1.57 | 2.19 | 0.215 | 0.910 |
| | 0.56 | 0.75 | 0.16 | 0.45 | 0.736 | 0.297 |
| | 1.08 | 0.61 | 1.14 | 0.82 | 0.688 | 0.655 |
| | 0.15 | 0.14 | 0.22 | 0.13 | 0.932 | 0.601 |
| | 0.52 | 1.78 | 0.36 | 0.36 | 0.008 | 0.004 |
| | 0.29 | 0.32 | 0.16 | 0.20 | 0.931 | 0.563 |
| | 1.19 | 1.25 | 0.24 | 0.49 | 0.924 | 0.131 |
| | 0.92 | 0.48 | 0.61 | 0.32 | 0.331 | 0.767 |
| | 0.43 | 0.27 | 2.10 | 0.84 | 0.895 | 0.150 |
| | 0.99 | 0.71 | 1.17 | 0.64 | 0.696 | 0.521 |
| | 0.04 | 0.01 | <0.01 | 0.02 | 0.328 | 0.686 |
| | 0.25 | 0.32 | 0.14 | 0.11 | 0.458 | 0.085 |
| | 0.74 | 0.37 | 0.44 | 0.22 | 0.256 | 0.827 |
| | 33.07 | 26.45 | 29.64 | 6.53 | 0.462 | 0.720 |
| Diet: | CON | LCD |
| |||
|---|---|---|---|---|---|---|
| β-mannanase, TMU/kg: | - | - | 800 | SEM | CON vs. LCD | LCD vs. LCD + β-mannanase |
|
| ||||||
| | 1.74 | 0.93 | 0.72 | 0.41 | 0.205 | 0.721 |
| | 1.65 | 1.75 | 0.89 | 0.59 | 0.816 | 0.060 |
| | 0.75 | 1.12 | 0.64 | 0.22 | 0.227 | 0.126 |
| | 1.64 | 0.95 | 0.92 | 0.35 | 0.231 | 0.956 |
| | 1.57 | 0.98 | 0.81 | 0.36 | 0.110 | 0.632 |
| | 1.33 | 0.96 | 1.12 | 0.21 | 0.286 | 0.622 |
| | 1.65 | 4.05 | 4.31 | 1.27 | 0.254 | 0.909 |
|
| ||||||
| | 3.73 | 0.84 | 0.67 | 0.83 | 0.017 | 0.876 |
| | 0.70 | 0.63 | 1.06 | 0.22 | 0.817 | 0.189 |
| | 1.05 | 0.47 | 0.63 | 0.16 | 0.036 | 0.529 |
| | 1.83 | 0.85 | 1.07 | 0.29 | 0.039 | 0.579 |
| | 1.94 | 0.55 | 0.85 | 0.48 | 0.047 | 0.638 |
| | 0.84 | 0.94 | 1.18 | 0.22 | 0.756 | 0.441 |
| | 5.59 | 1.57 | 0.60 | 2.79 | 0.349 | 0.814 |
| Diet: | CON | LCD |
| |||
|---|---|---|---|---|---|---|
| β-mannanase, TMU/kg: | - | - | 800 | SEM | CON vs. LCD | LCD vs. LCD + β-mannanase |
|
| ||||||
|
| ||||||
| | 2.51 | 3.23 | 3.26 | 0.38 | 0.102 | 0.934 |
| | 1.78 | 2.02 | 2.32 | 0.46 | 0.598 | 0.490 |
| | 0.38 | 0.34 | 0.38 | 0.06 | 0.670 | 0.634 |
| | 5.55 | 4.67 | 6.34 | 1.57 | 0.655 | 0.380 |
| | 0.86 | 0.94 | 0.95 | 0.14 | 0.594 | 0.927 |
| | 3.79 | 3.61 | 4.18 | 0.62 | 0.833 | 0.509 |
| | 0.41 | 0.32 | 0.48 | 0.20 | 0.755 | 0.547 |
|
| ||||||
| | 3.33 | 4.25 | 3.58 | 0.62 | 0.317 | 0.461 |
| | 1.24 | 1.75 | 1.62 | 0.38 | 0.137 | 0.681 |
| | 0.23 | 0.40 | 0.32 | 0.07 | 0.073 | 0.376 |
| | 4.19 | 5.95 | 2.64 | 1.24 | 0.281 | 0.046 |
| | 0.85 | 0.84 | 0.83 | 0.19 | 0.919 | 0.901 |
| | 1.82 | 2.60 | 3.19 | 1.00 | 0.379 | 0.482 |
| | 0.24 | 0.19 | 0.23 | 0.06 | 0.437 | 0.517 |
| Diet: | CON | LCD |
| |||
|---|---|---|---|---|---|---|
| β-mannanase, TMU/kg: | - | - | 800 | SEM | CON vs. LCD | LCD vs. LCD + β-mannanase |
|
| ||||||
| | 560 | 498 | 501 | 52 | 0.189 | 0.950 |
| | 184 | 193 | 172 | 18 | 0.469 | 0.092 |
| | 3.07 | 2.60 | 2.95 | 0.22 | 0.140 | 0.272 |
| | 28.8 | 28.2 | 31.4 | 2.0 | 0.821 | 0.203 |
| | 73.5 | 75.3 | 78.2 | 4.6 | 0.793 | 0.667 |
|
| ||||||
| | 561 | 554 | 474 | 48 | 0.900 | 0.139 |
| | 165 | 188 | 172 | 13 | 0.200 | 0.332 |
| | 3.47 | 2.98 | 2.78 | 0.32 | 0.125 | 0.462 |
| | 34.4 | 38.3 | 40.1 | 3.2 | 0.260 | 0.571 |
| | 76.2 | 90.0 | 77.8 | 7.1 | 0.158 | 0.181 |
| Diet: | CON | LCD |
| |||
|---|---|---|---|---|---|---|
| β-mannanase, TMU/kg: | - | - | 800 | SEM | CON vs. LCD | LCD vs. LCD + β-mannanase |
|
| ||||||
| | 56.5 | 54.5 | 56.1 | 6.0 | 0.801 | 0.851 |
| | 55.1 | 55.9 | 56.4 | 5.9 | 0.911 | 0.950 |
| | 67.9 | 71.1 | 69.8 | 4.3 | 0.624 | 0.849 |
| | 71.3 | 42.0 | 58.4 | 5.3 | 0.002 | 0.021 |
| | 49.4 | 22.1 | 53.0 | 10.0 | 0.111 | 0.099 |
| | 36.8 | 16.2 | 36.4 | 11.5 | 0.266 | 0.243 |
|
| ||||||
| | 148.2 | 115.4 | 134.7 | 14.4 | 0.111 | 0.317 |
| | 111.3 | 103.2 | 114.3 | 11.8 | 0.633 | 0.518 |
| Diet: | CON | LCD |
| |||
|---|---|---|---|---|---|---|
| β-mannanase, TMU/kg: | - | - | 800 | SEM | CON vs. LCD | LCD vs. LCD + β-mannanase |
|
| 4.22 | 4.14 | 4.39 | 0.12 | 0.580 | 0.118 |
|
| 3.03 | 3.12 | 3.15 | 0.03 | 0.047 | 0.565 |
|
| 3.00 | 3.04 | 2.97 | 0.02 | 0.240 | 0.057 |
| Diet: | CON | LCD |
| |||
|---|---|---|---|---|---|---|
| β-mannanase, TMU/kg: | - | - | 800 | SEM | CON vs. LCD | LCD vs. LCD + β-mannanase |
|
| ||||||
| | 6.2 | 6.2 | 6.2 | 0.2 | 0.995 | 0.851 |
| | 7.7 | 7.1 | 7.6 | 0.2 | 0.022 | 0.038 |
| | 11.6 | 11.1 | 12.3 | 0.5 | 0.506 | 0.071 |
| | 27.7 | 27.3 | 29.5 | 1.4 | 0.872 | 0.280 |
|
| ||||||
| | 154 | 90 | 146 | 19 | 0.020 | 0.037 |
| | 385 | 407 | 467 | 29 | 0.605 | 0.141 |
| | 270 | 248 | 306 | 23 | 0.503 | 0.070 |
| | 733 | 735 | 783 | 39 | 0.968 | 0.412 |
| | 511 | 504 | 554 | 33 | 0.883 | 0.304 |
|
| ||||||
| | 184 | 130 | 191 | 16 | 0.022 | 0.008 |
| | 535 | 477 | 564 | 332 | 0.198 | 0.054 |
| | 359 | 303 | 377 | 22 | 0.082 | 0.021 |
| | 1,054 | 1,033 | 1,109 | 59 | 0.785 | 0.344 |
| | 721 | 683 | 765 | 42 | 0.506 | 0.163 |
|
| ||||||
| | 0.64 | 0.47 | 0.56 | 0.12 | 0.081 | 0.338 |
| | 0.71 | 0.86 | 0.83 | 0.03 | 0.001 | 0.406 |
| | 0.72 | 0.81 | 0.79 | 0.04 | 0.032 | 0.639 |
| | 0.71 | 0.73 | 0.72 | 0.02 | 0.246 | 0.557 |
| | 0.71 | 0.74 | 0.72 | 0.01 | 0.095 | 0.326 |
|
| ||||||
| | 1.11 | 1.24 | 1.17 | 0.19 | 0.486 | 0.702 |
| | 0.78 | 0.53 | 0.55 | 0.03 | <0.001 | 0.639 |
| | 0.84 | 0.63 | 0.65 | 0.04 | <0.001 | 0.575 |
| | 0.45 | 0.41 | 0.42 | 0.01 | 0.001 | 0.593 |
| | 0.55 | 0.46 | 0.49 | 0.01 | <0.001 | 0.069 |
- —North Carolina Agricultural Foundation10.13039/100009591
- —Hatch10.13039/501100024787
- —BASF Corporation10.13039/100007487
Peer Reviews
No public reviews on file for this paper yet. If you reviewed it on a platform where reviews are public (OpenReview, ICLR, NeurIPS, ICML), you can paste yours below so the community can read it here.
Videos
No videos yet. Explain this paper in a talk, walkthrough, or lecture? Add one.
Taxonomy
TopicsAnimal Nutrition and Physiology · Animal Behavior and Welfare Studies · Phytase and its Applications
Introduction
Nursery diets are primarily composed of highly palatable and digestible feedstuffs to help pigs adapt to solid diets (Skinner et al. 2014). These highly palatable and digestible feedstuffs, such as animal protein supplements and enzyme-treated soybean meal (SBM), are more costly than conventional SBM, which constitutes a high portion of pig diets (Hansen et al. 1993; Hong et al. 2004). As the major protein supplement used in pig diets, SBM provides a well-balanced and highly available amino acid profile (Deng and Kim 2024). However, a notable issue with the increased use of SBM is the presence of anti-nutritional compounds, including allergenic proteins, phytate, soluble non-starch polysaccharides (NSP), and raffinose-family oligosaccharides (Eeckhout and De Paepe 1994; Kim et al. 2003), which negatively influence the intestinal health and growth of nursery pigs (Kim et al. 2003; Yuan et al. 2017; Chen et al. 2020). Such detrimental effects are particularly relevant in the jejunum, a critical site for intestinal health and growth in pigs (Deng et al. 2023a).
Among the anti-nutritional compounds in SBM, phytate and β-mannan are particularly critical to the intestinal health and growth of pigs. High levels of dietary SBM increase dietary phytate content (Woyengo et al. 2009), as SBM contains 1.0% to 1.5% phytate. Phytate binds to essential nutrients such as phosphorus (P), calcium (Ca), and amino acids (Eeckhout and De Paepe 1994), thereby reducing their availability and negatively affecting the intestinal health and growth of pigs. High phytase supplementation reduces the need for inorganic Ca and P supplements in diets, contributing to reduced feed costs. Thus, high phytase supplementation is necessary to break down phytate in high SBM-based diets (Veum et al. 2006; Laird et al. 2018).
Beta-mannan remains a critical challenge in high SBM-based diets. Beta-mannan, including β-galactomannan, reduces ileal digestibility of nutrients of pigs not only by increasing digesta viscosity but also by forming a physical barrier that both limits the access of digestive enzymes to nutrients in the diet (Baker et al. 2024a; Jang et al. 2024). Beta-mannan has structural similarity to the outer cell wall of pathogenic bacteria (Kiarie et al. 2022) and is identified by mannose receptors on enterocytes (Peng et al. 1991; Ross 2002), thereby triggering host immune responses (Arsenault et al. 2017) and exerting negative impacts on intestinal immunity (Hopwood et al. 2002; Chen et al. 2020; Baker et al. 2024a). These effects are particularly problematic in low-cost formulated diets (LCD), as the high inclusion of SBM, which contains 1.0% to 2.0% β-mannan, increases dietary β-mannan content (Hsiao et al. 2006).
Beta-mannanase hydrolyzes β-mannan in diets, reducing digesta viscosity and converting it into manno-oligosaccharides (MOS) in the small intestine. MOS help reduce Gram-negative bacteria and promote fiber-degrading bacteria (Stahlhut et al. 2009), leading to increased production of short-chain fatty acids, particularly butyrate, which has immune modulating effects (Segain et al. 2000). Increased MOS through β-mannanase could exhibit beneficial effects on the intestinal microbiota, attenuate unnecessary immune activation, and enhance intestinal health and growth of pigs (Genova et al. 2023a; Jang et al. 2024). In addition, supplementation with 600 to 800 TMU/kg of β-mannanase improved ileal digestibility of nutrients and energy and growth in pigs (Vangroenweghe et al. 2021; Genova et al. 2023b; Baker et al. 2024a) and chickens (Barekatain et al. 2024), indicating that β-mannanase is sufficient to degrade dietary β-mannan (0.46% to 0.62%). However, the potential mechanisms of β-mannanase related to host-microbiota interactions and mucosal health warrant further investigation. Based on these considerations, this study tested the hypothesis that LCD, which contains high levels of β-mannan, negatively influence the mucosa-associated microbiota, intestinal health, and growth of nursery pigs. The inclusion of 800 TMU/kg of β-mannanase in LCD with high phytase was expected to mitigate these negative impacts by hydrolyzing β-mannan, thereby enhancing intestinal health, nutrient digestibility, and pig growth, and also reducing feed cost compared with control diets (CON). To test this hypothesis, the objective of this study was to investigate the impacts of LCD with high phytase inclusion on the intestinal health and growth performance of nursery pigs and the roles of β-mannanase in mitigating these impacts.
Materials and methods
The protocol of this experiment (22–438) was reviewed and approved by North Carolina State University Animal Care and Use Committee (Raleigh, NC).
Animals, experimental design, and experimental diets
A total of 36 pigs (18 barrows and 18 gilts), weaned at 21 d of age with an initial body weight (BW) of 6.2 ± 0.2 kg, were assigned to three dietary treatments in a randomized complete block design, with initial BW (light, medium, and heavy) and sex (barrows and gilts) as blocking factors. Each treatment had 12 replicates (six pens with barrows and six pens with gilts). Pigs were individually housed in pens (1.50 m × 0.74 m) and had free access to diets and water throughout the experimental period. The LCD contained 14% more SBM than the CON (Table 1). The inclusion rate of SBM in the CON was 16.0%, 17.0%, and 20.5% in phases 1, 2, and 3, respectively. All feedstuffs used in this study originated from the same batch from the North Carolina State University Feed Mill Education Unit (Raleigh, NC). Three dietary treatments were: 1) CON, 2) LCD, and 3) LCD with 800 TMU/kg of β-mannanase (LCD + β-mannanase). The β-mannanase (Natupulse TS, BASF Corporation, NJ, USA; 8,000 TMU/g) was supplemented to the LCD at the expense of corn at an inclusion rate of 0.01%, resulting in 800 TMU/kg. The production organism of the β-mannanase used in this study was Thermothelomyces thermophilus DSM 33149. All diets, regardless of dietary treatment, were supplemented with 3,000 FTU/kg of phytase. The source organisms of the bacterial hybrid 6-phytase used in this study were Hafnia spp., Yersinia spp., and Buttiauxella spp., and the production organism was Aspergillus niger. The phytase (Natuphos E, BASF Corporation, NJ, USA; 10,000 FTU/g) was supplemented to the CON and LCD at the expense of corn to ensure that all final diets contained 3,000 FTU/kg. Experimental diets were formulated to meet or exceed the nutrient requirements suggested by NRC (2012), except for metabolizable energy, standardized ileal digestible (SID) Lys, Met, Thr, and Trp, total Ca, and apparent total tract digestible (ATTD) P in the 3 phases. The nutrient composition of the diets was lower than the nutrient requirements suggested by NRC (2012), with reductions in metabolizable energy (63 kcal/kg), SID Lys (140 mg/kg), SID Met (42 mg/kg), SID Thr (84 mg/kg), total Ca (1,700 mg/kg), and ATTD P (1,360 mg/kg), accounting for phytase effects (Cowieson et al. 2017). All experimental diets were provided in mash form. No antibiotics were included in the diets as a growth promoter. Pigs were fed for 42 d in 3 phases: phase 1 (d 0 to 10), phase 2 (d 10 to 20), and phase 3 (d 20 to 42). Activities of phytase and β-mannanase in diets were measured, and the analyzed enzyme activities are shown in Table 2. One FTU is defined as the activity that releases 1 µmol of inorganic phosphate from 5.0 mM sodium phytate per minute at pH 5.5 and 37 °C (Engelen et al. 2001). One TMU is defined as the activity that releases 1 µmol of mannose-reducing sugars from 1.0% locust bean gum in 200 mM sodium phosphate per minute at pH 6.0 and 50 °C (Jang et al. 2024). Titanium dioxide (TiO_2_), was included at 0.40% in the phase 3 diets as an indigestible marker to determine the apparent ileal digestibility (AID) of nutrients and energy.
Sample and data collection
Blood samples were collected at 09:00 h without prior fasting. On d 15 and 37, blood samples were obtained from the jugular vein of all pigs using a 20-gauge needle and collected into a 10 mL vacutainer tube containing ethylenediaminetetraacetic acid (EDTA). Immediately after collection, the tubes were placed on ice and kept in a 5 °C refrigerator until processing. Plasma samples were obtained after centrifugation (1,500 × g at 4 °C for 15 min) on the day of collection and stored at –80 °C until analysis. On each of d 20 and 42, 18 pigs (n = 6 per treatment on each day) were euthanized by the penetration of a captive bolt followed by exsanguination. The pigs euthanized on d 20 were randomly selected within the same block based on initial BW within sex. After euthanasia, jejunal mucosa and jejunal tissues were collected on d 20 and 42, and ileal digesta was additionally collected on d 42. Jejunal tissues were obtained from 3 to 4 m after the pyloric valve of the stomach of pigs (Deng et al. 2023a). The jejunal tissues (20 cm) were flushed with 0.9% saline solution to remove digesta, and the flushed tissues were collected. From this segment, the first 15 cm was used to collect jejunal mucosa by scraping the mucosal layer using a glass microscope slide, and the remaining 5 cm was fixed in 10% buffered formaldehyde for Ki-67 staining and histological evaluation (Deng et al. 2023a; Choi et al. 2024a). The jejunal mucosa samples were collected into 2 mL tubes and were immediately snap-frozen in liquid nitrogen and stored to the freezer at −80 °C for further processing and analysis, including DNA extraction, immune responses, and oxidative damage products. Jejunal mucosa was collected to determine concentrations of tumor necrosis factor-alpha (TNF-α), interleukin-6 (IL-6), interleukin-8 (IL-8), immunoglobulin A (IgA), and immunoglobulin G (IgG) as indicators of immune response status, and protein carbonyl and malondialdehyde (MDA) as oxidative damage products. Jejunal tissue samples were also used to measure the relative expression of pattern recognition receptors, including toll-like receptor 2 (TLR2), toll-like receptor 4 (TLR4), nucleotide-binding oligomerization domain protein 1 (NOD1), nucleotide-binding oligomerization domain protein 2 (NOD2), cluster of differentiation 14 (CD14), nuclear factor kappa-light-chain-enhancer of activated B cells (NF-κB), interferon-gamma (IFN-γ), and glyceraldehyde 3-phosphate dehydrogenase (GAPDH). Ileal digesta was collected from 50 cm anterior to the ileocecal junction in a 50 mL container and stored at −20 °C for further processing and analysis to determine the AID of nutrients and energy.
Microbial diversity and relative abundance of mucosa-associated microbiota in the jejunum
The jejunal mucosa samples (100 mg) were sent to Zymo Research Corporation (Irvine, CA, USA) to determine microbial diversity and relative abundance (RA) of mucosa-associated microbiota in the jejunum (Duarte et al. 2024; Gormley et al. 2024). Jejunal mucosa samples were used for DNA extraction for 16S rRNA sequencing using the ZymoBIOMICS-96 MagBead DNA kit (Zymo Research). The extracted DNA samples were prepared for targeted sequencing with the Quick-16S Primer Set V3-V4 (Zymo Research) and NGS Library Preparation Kit for the microbial analysis. These primers were custom-designed by Zymo Research to provide the best coverage of the 16S gene. The final PCR products were quantified with qPCR fluorescence readings and pooled together based on equal molarity. The final pooled library was cleaned up with the Select-a-Size DNA Clean & Concentrator (Zymo Research), then quantified with TapeStation (Agilent Technologies, Santa Clara, CA, USA) and Qubit (Thermo Fisher Scientific, Waltham, WA, USA). For sequencing, the final library was sequenced on the Illumina NextSeq 2000 (Illumina, San Diego, CA, USA) with a P1 (cat 20075294) reagent kit (600 cycles). The sequencing was performed with a 30% Phix spike-in using the Phix Control kit V3. Unique amplicon sequence variants (ASV) were inferred from raw reads using the DADA2 pipeline (Callahan et al. 2016). Chimeric sequences were also removed using the DADA2 pipeline. The depth of sequencing coverage was > 20,000 × per sample. Taxonomy was assigned using the Greengenes and SILVA databases as references. Alpha diversity (Chao 1, Shannon, and Simpson indices) and beta diversity (Bray-Curtis distance) were evaluated with MicrobiomeAnalyst (QC, CA; Choi et al. 2025). The ASV data were transformed to RA for further statistical analysis, and ASV data with less than 0.50% abundance within each level were combined as “others.” To explore potential associations between jejunal mucosa-associated microbiota and immune responses, oxidative damage products, intestinal morphology, and growth performance, Spearman correlation results are summarized in Supplementary Tables S1 and S2.
RNA extraction and relative expression of pattern recognition receptors in the jejunum
The RNA was extracted from jejunal tissue as described by Jang et al. (2023). Frozen jejunal tissue (50 to 100 mg) was mixed in a 1 mL tube with pre-cooled Trizol reagent (#15-596-026, Invitrogen, Waltham, MA, USA), and the samples were processed at 4.5 m/s for 30 s, two times, using a Bead Mill 24 homogenizer (#15-340-163, Thermo Fisher Scientific Inc.), following previous studies (Duarte and Kim 2024; Gormley et al. 2024). Homogenized samples were centrifuged at 12,000 × g for 10 min at 4 °C to get supernatants. Then, 200 µL of chloroform (#146543, Thermo Fisher Scientific Inc.) was mixed with the supernatant in a new tube and incubated at room temperature for 10 min. After incubation, the mixed samples were centrifuged to get the aqueous phase and mixed with 200 µL of isopropanol (#B0518327, Acros Organics, Geel, NJ, USA). After resting on ice for 10 min, the mixed samples were centrifuged to get the sediment and then mixed with 75% ethanol. The mixed samples were centrifuged to remove the supernatants and then mixed with 40 µL DEPC water. The RevertAid First Strand cDNA Synthesis kit (#01299151, Thermo Fisher Scientific Inc.) was used to revert the extracted RNA into cDNA. All procedures followed the manufacturer’s instructions. The CFX Connect Real-Time PCR Detection System (BioRad, Hercules, CA, USA) and Maxima SYBR Green/ROX qPCR Master Mix (#01292815, Thermo Fisher Scientific Inc.) was used for quantitative RT-PCR. The primers used for pattern recognition receptors in the jejunum are listed in Table 3 and were synthesized by Millipore Sigma (Burlington, MA, USA). Delta-delta Ct values were calculated to determine the relative expression of each target gene.
Immune responses and oxidative damage products in the jejunum
Jejunal mucosa samples (0.5 g) were weighed and ground using a homogenizer (Tissuemiser, Thermo Fisher Scientific Inc., Rockford, IL, USA) on ice in 1 mL phosphate-buffered saline for 30 s. The homogenate was centrifuged at 14,000 × g at 4 °C for 30 min to obtain the supernatant, which was used to determine the contents of total protein, IgA, IgG, TNF-α, IL-8, IL-6, protein carbonyl, and MDA. The supernatant was pipetted off and kept at −80 °C. The total protein content was determined using the Pierce BCA Protein Assay kit (#23225, Thermo Fisher Scientific Inc.) and was used to calculate the concentrations of IgA, IgG, TNF-α, IL-8, IL-6, protein carbonyl, and MDA per milligram of protein in the jejunal mucosa sample. The mucosa samples were diluted 1:32 with distilled water to analyze total protein content. The contents of IgA and IgG were analyzed using ELISA kits for pig IgA (E101-102, Bethyl Laboratories, Inc., Montgomery, TX, USA) and pig IgG (E101-104, Bethyl Laboratories, Inc.), respectively. The mucosa samples were diluted 1:1,000 and 1:1,600 with PBS to analyze IgA and IgG, respectively. The contents of MDA and protein carbonyl were measured using commercial assay kits (Cell Biolabs, Inc., San Diego, CA, USA) following the manufacturer’s protocols. The contents of TNF-α, IL-8, and IL-6 in the jejunal mucosa were measured using the porcine ELISA kits (R&D Systems, Minneapolis, MN, USA) following Deng et al. (2023a).
Intestinal morphometry and crypt cell proliferation in the jejunum
After 48 h in 10% buffered formaldehyde solution, two sections of the jejunum per pig were transversely cut, placed into a cassette in 70% ethanol, and sent to the University of North Carolina Histology Laboratory (UNC School of Medicine, Chapel Hill, NC, USA) for dehydration, embedment, and Ki-67^+^ immunohistochemistry staining for morphometric evaluation and to evaluate cell proliferation in the crypt following previous studies (Baker et al. 2024a; Duarte et al. 2024). Pictures of villi and crypts in 40 × magnification were taken to measure villus height (VH) and crypt depth (CD), using an Infinity 2-2 digital CCD camera attached to an Olympus CX31 microscope (Lumenera Corporation, Ottawa, Canada) for intestinal morphometry. The VH to CD ratio (VH:CD) was also determined. Pictures of crypts in 100 × magnification were taken for Ki-67 positive cell measurement. The ImageJS software was used to calculate the percentage of dyed Ki-67 positive cells in the total cells in the crypt. The number of Ki-67 positive cells (count) in the jejunal crypt and their proportion relative to the total crypt cells (%) were quantified and calculated, respectively, as indicators of enterocyte proliferation (Duarte et al. 2024; Gormley et al. 2024). All analyses of the morphometry were executed by the same person, and the average of 15 measurements per sample was calculated and reported as one number per sample.
Chemical analyses
Frozen ileal digesta were freeze-dried, and both experimental diets and dried ileal digesta were finely ground. Samples were then dried in the forced-air drying oven at 135 °C for 2 h to determine dry matter (DM; method 930.15). Ether extract (EE) was analyzed using anhydrous diethyl ether (method 920.39) according to AOAC (2005). Nitrogen content in diets and the ileal digesta was measured using a TruSpec N Nitrogen Determinator (LECO Corp., St. Joseph, MI, USA) to determine crude protein (CP; 6.25 × nitrogen). Experimental diets and the ileal digesta were analyzed for gross energy (GE) using bomb calorimetry (Parr 1261, Parr Instrument Co., Moline, IL, USA), detecting energy released during the complete combustion of a sample. The diets and ileal digesta were analyzed for neutral detergent fiber (NDF; method 2002.04) and acid detergent fiber (ADF; method 973.18) as described in (AOAC 2005), using an ANKOM 200 Fiber Analyzer (ANKOM Technology Corp., Macedon, NY, USA).
AID of nutrients and energy and myoinositol contents in the plasma
The TiO_2_ contents in the diet and ileal digesta were determined (Myers et al. 2004; Chen et al. 2017). Briefly, samples were digested in Kjeldahl digestion tubes with a catalyst and 13 mL of concentrated sulfuric acid at 420 °C for 2 h. After cooling for 30 min, 10 mL of 30% hydrogen peroxide was added to each tube, and the final volume was adjusted to 100 mL with distilled water. The digested solution was transferred to a microplate, and TiO_2_ content was measured at 410 nm using spectrophotometry. The AID of GE was calculated using the following equation:
where TiO_2diet_ and TiO_2digesta_ are the TiO_2_ contents in the diet and ileal digesta, respectively (%; DM basis); and GE_digesta_ and GE_diet_ are the gross energy contents in the ileal digesta and diet, respectively (kcal/kg; DM basis). The AID of nutrients (DM, CP, EE, NDF, and ADF) were also calculated using the same equation. Nutrient contents (DM basis) were expressed as %. The myoinositol contents in plasma were analyzed using a myoinositol assay kit (#K-INOSOL, Megazyme, Bray, County Wicklow, Ireland) according to the manufacturer’s instructions.
Fecal score and growth performance
Fecal score of each pen was recorded based on a 1 to 5 scale (1: firm stool, 2: normal firm stool, 3: moderately loose stool, 4: loose and watery stool, and 5: very watery stool) by visual observation of fresh feces from d 3 at 2-d intervals (Guo et al. 2015; Duarte et al. 2019) as pigs did not defecate until d 3. The fecal scores were expressed as mean values.
The BW of pigs and feed disappearance were measured on d 10, 20, and 42 to determine average daily gain (ADG), average daily feed intake (ADFI), and gain-to-feed ratio (G: F) for growth performance of nursery pigs.
Economic analysis
The feed cost and price of feedstuffs were recorded in Raleigh, NC during April 2024. Feed cost per BW gain (; feed intake, kg × feed cost, $/kg) divided by the BW gain (kg) during each phase as previously described by Soleimani et al. (2021).
Statistical analyses
Experimental data were analyzed using the MIXED procedure in SAS (SAS Inst., Cary, NC, USA). The statistical model included dietary treatment as a fixed effect and initial BW and sex as random effects. The experimental unit was a pig that was fed and housed individually. To determine the statistical significance of the expected mean difference of 15% at *P *< 0.05, using coefficient of variation at 7.5% based on previous studies conducted using pigs with similar genetic background and research environment (Duarte et al. 2019; Deng et al. 2023a) and the power of test (1—beta) at 95% the power analysis indicated 80%, and the minimum number of replications for each treatment was 6 (Aaron and Hays 2004). One observation of a pig fed the CON was removed from the data set for the final analysis, as the observation deviated by more than 1.5 times the interquartile range from the treatment median value of growth performance, showing feed refusal. The least squares mean of each treatment was calculated. Differences between least squares means were determined by the preplanned contrasts, which were made between CON vs. LCD and LCD vs. LCD + β-mannanase. Alpha and beta diversity were evaluated using the website program MicrobiomeAnalyst (QC, CA), to identify differences between the treatment groups. The analysis of similarities (ANOSIM) was performed to evaluate the beta diversity of jejunal mucosa-associated microbiota (Duarte et al. 2024; Choi et al. 2025). The data were visualized using principal coordinate analysis (PCoA) based on Bray-Curtis distance. The statistical significance and tendency were declared at *P *< 0.05 and 0.05 ≤ *P *< 0.10, respectively.
Results
Microbial diversity and relative abundance of mucosa-associated microbiota in the jejunum
There were no differences in alpha diversity, including Chao 1, Shannon, and Simpson indices (Table 4), and beta diversity in jejunal mucosa-associated microbiota on d 20 and 42 (Figure 1).
Principal component analysis (PCoA) plot in the jejunal mucosa-associated microbiota at the genus level of nursery pigs fed a control diet (CON) or low-cost formulated diets (LCD) containing 3,000 FTU/kg of phytase, with 0 or 800 TMU/kg of β-mannanase (LCD + β-mannanase). The X-axis and Y-axis represent the principal component axes, with the percentages indicating the proportion of variation explained by each component. Points of different colors correspond to samples from different treatments, and the closer two points are, the more similar their species composition. (A) In phase 2 (d 20), the Bray-curtis distance analysis showed no difference between pigs fed CON and LCD (P = 0.382), between LCD and LCD + β-mannanase (P = 0.391), or between CON and LCD + β-mannanase (P = 0.455). (B) In phase 3 (d 42), the Bray-Curtis distance analysis showed no difference between pigs fed CON and LCD (P = 0.490), between LCD and LCD + β-mannanase (P = 0.591), or between CON and LCD + β-mannanase (P = 0.553). Experimental unit was a pen, and the number of observations was 6 per treatment, except for the CON containing 3,000 FTU/kg, which have 5 observations each in phase 2.
On d 20, the LCD increased (*P *< 0.05) the RA of Euryarchaeota compared to the CON (Table 5). On d 42, the LCD tended to decrease (*P *= 0.067) the RA of Firmicutes compared to the CON. The LCD + β-mannanase tended to decrease (*P *= 0.076) the RA of Actinobacteria compared to LCD.
On d 20, the LCD increased (*P *< 0.05) the RA of Christensenellaceae and Methanobacteriaceae and tended to increase (*P *= 0.094) the RA of Xanthomonadaceae compared to the CON (Table 6). The LCD + β-mannanase decreased (*P *< 0.05) the RA of Xanthomonadaceae compared to the LCD. On d 42, the LCD increased (*P *< 0.05) the RA of Coriobacteriaceae compared to the CON. The LCD + β-mannanase decreased (*P *< 0.05) the RA of Coriobacteriaceae compared to the LCD.
On d 20, the LCD increased (*P *< 0.05) the RA of Christensenellaceae and tended to increase (*P *= 0.098) the RA of Stenotrophomonas compared to the CON (Table 7). The LCD + β-mannanase increased (*P *< 0.05) the RA of Clostridium and tended to decrease the RA of Stenotrophomonas (*P *= 0.050) and Christensenellaceae (*P *= 0.052) compared to the LCD. On d 42, the LCD increased (*P *< 0.05) the RA of Olsenella and tended to decrease (*P *= 0.056) the RA of Romboutsia compared to the CON. The LCD + β-mannanase decreased (*P *< 0.05) the RA of Olsenella compared to the LCD.
On d 20, the LCD tended to increase (*P *= 0.098) the RA of Stenotrophomonas maltophilia compared to the CON (Table 8). The LCD + β-mannanase tended to decrease (*P *= 0.050) the RA of Stenotrophomonas maltophilia and increased (*P *< 0.05) the RA of Blautia wexlerae compared to the LCD. On d 42, the LCD increased (*P *< 0.05) the RA of Olsenella profusa and tended to decrease (*P *= 0.056) the RA of Stenotrophomonas maltophilia compared to the CON. The LCD + β-mannanase decreased (*P *< 0.05) the RA of Olsenella profusa compared to the LCD.
Relative expression of pattern recognition receptors in the jejunum
On d 20, the LCD + β-mannanase tended to decrease (*P *= 0.060) the relative expression of TLR4 in the jejunum compared to the LCD (Table 9). However, the relative expressions of TLR2, NOD1, NOD2, CD14, NF-κB, and IFN-γ were not affected by the treatments.
On d 42, the LCD decreased (*P *< 0.05) the relative expression of TLR2, NOD1, NOD2, and CD14 in the jejunum compared to the CON. However, the relative expressions of TLR4, NF-κB, and IFN-γ were not affected by the treatments.
Immune response and oxidative damage products in the jejunum
On d 20, immune response and oxidative damage products, including IgA, IgG, IL-8, IL-6, TNF-α, PC, and MDA, were not affected by the treatments (Table 10). On d 42, the LCD tended to increase (*P *= 0.073) IL-8 in the jejunum compared to the CON. The LCD + β-mannanase decreased (*P *< 0.05) IL-6 in the jejunum compared to the LCD. However, jejunal IgA, IgG, TNF-α, PC, and MDA were not affected by the treatments.
Intestinal morphometry and crypt cell proliferation in the jejunum
On d 20, the LCD did not affect intestinal morphometry and cell proliferation in the jejunum compared to the CON (Table 11). The LCD + β-mannanase tended to decrease (*P *= 0.092) crypt depth in the jejunum compared to the LCD. On d 42, however, intestinal morphometry and cell proliferation in the jejunum were not affected by the treatments.
Apparent ileal digestibility of nutrients and energy and plasma myoinositol
On d 42, the LCD decreased (*P *< 0.05) the AID of EE compared to the CON (Table 12). The LCD + β-mannanase increased (*P *< 0.05) the AID of EE and tended to increase (*P *= 0.099) the AID of NDF compared to the LCD. However, the AID of DM, GE, CP, and ADF were not affected by the treatments. On d 20 and 42, plasma myoinositol was not affected by the treatments.
Fecal score, growth performance, and economic analysis
The LCD increased (*P *< 0.05) the fecal score during phase 2 compared to the CON (Table 13). The LCD + β-mannanase tended to decrease (*P *= 0.057) fecal score during phase 3 compared to the LCD. However, fecal score during phase 1 was not affected by the treatments.
The LCD decreased (*P *< 0.05) BW on d 10 compared to the CON (Table 14). The LCD + β-mannanase increased (*P *< 0.05) BW on d 10 compared to the LCD. The LCD decreased (*P *< 0.05) ADG and ADFI during phase 1 compared to the CON. The LCD + β-mannanase increased (*P *< 0.05) ADG and ADFI during phase 1 and increased (*P *< 0.05) ADFI during phase 2 compared to the LCD. The LCD increased (*P *< 0.05) G: F during phase 2 compared to the CON. However, growth performance during phase 3 and the overall period was not affected by the treatments. The LCD decreased (*P *< 0.01) feed cost per kg BW gain compared to the CON in phase 2 and 3. However, feed cost per kg BW gain during phase 1 was not affected by the treatments.
Discussion
SBM is widely used in pig diets because of its high protein content and economic advantages (Deng and Kim 2024). However, SBM also contains several anti-nutritional compounds, including phytate (Ravindran et al. 1994), soluble NSP (Knudsen 1997), and allergenic proteins (Taliercio and Kim 2013), which can negatively affect the intestinal health and growth of nursery pigs (Baker et al. 2024a). Phytate binds essential nutrients, such as minerals and amino acids, and reduces the efficiency of endogenous digestive enzymes and nutrient digestibility (Caldwell 1992; Eeckhout and De Paepe 1994; Choi et al. 2024b). Diets with high phytate levels require a high dose of phytase to ensure sufficient degradation (Moran et al. 2017). In this study, the LCD contained 14% more conventional SBM than the CON, which increased the dietary phytate content by approximately 0.11% to 0.13% (0.60% to 0.85% in the CON vs. 0.73% to 0.96% in the LCD across phases 1 to 3). Accordingly, a high dose of phytase (3,000 FTU/kg) was supplemented to the experimental diets to enhance phytate hydrolysis and improve Ca and P availability (Rojas and Stein 2012; Lu et al. 2019). Nevertheless, a high dose of phytase does not remove other anti-nutritional compounds in SBM, such as allergenic proteins and soluble NSP, including raffinose-family oligosaccharides and β-mannan.
Previous studies have reported that nursery pigs develop tolerance to allergenic proteins within 2 wk after weaning (Barratt et al. 1978; Li et al. 1991) and that the negative, diarrhea-inducing impacts of raffinose-family oligosaccharides decrease as the intestinal microbiota matures (Krause et al. 1994). Beta-mannan activates pattern-recognition receptors in enterocytes due to its structural similarity to pathogenic bacteria, triggering unnecessary immune responses (Arsenault et al. 2017), and can increase digesta viscosity, reducing nutrient digestibility (Jang et al. 2020; Baker et al. 2024a). Therefore, this study evaluated the hypothesis that LCD containing high levels of β-mannan negatively affects the mucosa-associated microbiota, intestinal health, and growth of nursery pigs compared to the CON. In this study, the LCD contained 0.17% more β-mannan than the CON (0.30% to 0.41% vs. 0.47% to 0.57% in phases 1 to 3), indicating that the impact of β-mannan would be more evident in pigs fed the LCD (Kim et al. 2017). However, supplementation of β-mannanase in the LCD with high phytase was expected to reduce these negative impacts by hydrolyzing β-mannan, thereby improving intestinal health, nutrient digestibility, pig growth, and reducing feed cost per BW gain.
To accurately quantify β-mannan and β-mannanase intake and clearly evaluate their effects on intestinal microbiota, intestinal health, and growth performance, pigs were individually housed, which is consistent with previous studies (Moita et al. 2022; Choi et al. 2024a), although group housing would reflect commercial conditions. Because the accurate evaluation of the effects of LCD and LCD + β-mannanase on intestinal health and growth performance requires precise control of feed intake and reduced variability in intestinal microbiota and immune responses, individual housing was used in this study.
In this study, the LCD increased jejunal IL-8 concentrations during phase 3, which is likely due to the high β-mannan content of the diet. Previous studies showed that increased β-mannan content in diets stimulates pro-inflammatory cytokines, such as TNF-α and IL-8, in the jejunum of pigs (Jang et al. 2024), likely through activation of C-type lectin receptors, including the mannose receptor (Embgenbroich et al. 2021). The branched structure of β-mannan enables multiple mannose residues to bind simultaneously to several carbohydrate recognition domains on the mannose receptor, thereby enhancing overall binding affinity (Taylor and Drickamer 1993; Fernández et al. 2005; Arsenault et al. 2017). This activation of the mannose receptor increases IL-8 production (Tachado et al. 2007). The IL-8 increase observed in this study is consistent with the previous studies (Tachado et al. 2007; Jang et al. 2024), which may negatively affect the growth of nursery pigs. However, during the early nursery phase (phases 1 to 2), no clear differences in intestinal immune responses were detected among dietary treatments. This may be because weaning-induced stress had already elevated the basal level of jejunal immune activation, making it difficult to observe dietary impacts during phases 1 to 2 (Skinner et al. 2014; Deng et al. 2023b).
An increase in dietary soluble NSP, including β-mannan, also increases jejunal digesta viscosity due to its water-holding capacity (Hopwood et al. 2002; Chen et al. 2020), thereby negatively affecting nutrient digestion, including EE, in nursery pigs (Hung et al. 2022; Moita et al. 2022; Baker et al. 2024b), which is consistent with the results of this study. A possible explanation is that viscous soluble NSP can entrap EE and limit the access of bile acids and lipases, reducing their efficiency to digest EE (Duarte et al. 2019; Choi et al. 2024a). In this study, the LCD showed negative impacts on growth performance during the early nursery phase (phases 1 and 2), whereas growth performance was not affected by diet during the later nursery phase (phase 3). Replacing animal protein supplements with SBM does not reduce the growth performance of nursery pigs during the later nursery phase (Moran et al. 2017), likely due to the adaptation to allergenic proteins in SBM (Barratt et al. 1978; Li et al. 1991). Pigs fed high-SBM diets did show reduced growth rate during the early nursery phase compared with pigs fed SBM-free diets; however, this difference in growth rate disappeared after 14 d (Li et al. 1991). These findings suggest that increased dietary sensitivity during the early nursery phase, when the intestinal mucosa and immune system are immature, may explain why the LCD caused a stronger reduction in growth performance during phases 1 and 2 in this study. Despite its negative impacts on intestinal health and growth of nursery pigs, the LCD reduced feed cost per BW gain compared to the CON, largely due to reduced use of animal protein supplements and processed SBM (Baker et al. 2024a). In addition, G: F in the LCD was greater in phase 2 compared to the CON, which may be associated with increased intestinal mass and the digesta water-holding capacity driven by NSP in the LCD, which could lead to increased BW gain in pigs (Nyachoti et al. 2000; Hong et al. 2021).
Collectively, the results of this study indicate that the negative impacts of the LCD on growth performance were pronounced in phase 1, when the immature intestine and strong immune responses after weaning made pigs highly sensitive to SBM-derived anti-nutritional compounds such as allergenic proteins, oligosaccharides, and β-mannan. As pigs developed tolerance, differences in intestinal health indices had a reduced effect on growth performance in phase 3. However, the LCD increased jejunal IL-8 content and reduced AID of EE in phase 3, indicating that the high β-mannan content in the LCD negatively affected intestinal health and nutrient digestibility.
In this study, the LCD + β-mannanase reduced IL-6 content in the jejunum of nursery pigs during phase 3 compared to the LCD. A possible reason is that β-mannanase may reduce the activation of the mannose receptor by breaking down β-mannan (Taylor and Drickamer 1993). Hydrolysis decreases the branched structure of β-mannan, which lowers the binding affinity of MOS to the mannose receptor, showing more than a 5-fold difference in an in vitro trial (Kéry et al. 1992). Additionally, MOS produced from β-mannan hydrolysis have been shown to downregulate the relative expression of IL-6 and TNF-α and decrease intestinal permeability in pigs (Ibuki et al. 2014).
Beta-mannanase hydrolyzes β-1,4-mannosidic bonds in β-galactomannan and β-mannan in diets, converting them into smaller molecules, such as MOS (Moreira and Filho 2008; Tiwari et al. 2018). These effects of β-mannanase are expected to positively modulate the mucosa-associated microbiota affected by high SBM in LCD (Baker et al. 2024a). Mucosa-associated microbiota was measured in this study because they interact more directly with epithelial cells through pattern recognition receptors (Duarte and Kim 2024; Gormley et al. 2024). Thus, these positive microbial changes in the intestine may have reduced the relative expression of TLR4 observed in the current study. Toll-like receptor 4 is a key pattern recognition receptor involved in the innate immune response, including the production of pro-inflammatory cytokines, and is capable of detecting lipopolysaccharides associated with Gram-negative bacteria (Moreira and Zamboni 2012). Additionally, the interconnectivity between changes in intestinal microbiota and inflammatory response through β-mannanase supplementation in diets has been demonstrated. Zhang et al. (2024) reported that β-mannanase supplementation in high-SBM diets increased the RA of fiber-degrading bacteria, including Prevotella and Lactobacillus, in the ileal digesta and decreased IL-6 and TNF-α contents in the ileum of chickens compared to high-SBM diets. Additionally, MOS can bind to the type 1 fimbrial adhesion of Gram-negative bacteria, such as Escherichia coli (Stahlhut et al. 2009), and may inhibit the colonization of Gram-negative bacteria on epithelial cells, allowing for an increase in the RA of fiber-degrading bacteria, such as Ruminococcaceae and Clostridiales, in the jejunum of pigs (Baker et al. 2024a). However, the change in jejunal RA of Clostridiales with β-mannanase supplementation remained low in this study, suggesting that these changes may reflect minor shifts or serve as ecological indicators of the intestinal microbiota rather than being major contributors to host-microbiota interactions (Saladrigas-García et al. 2021).
A previous study also reported that supplementing 0.30% MOS in diets increased the RA of fiber-degrading bacteria such as Lactobacillus in the ileal digesta of pigs, along with increased acetate and butyrate content (Yu et al. 2021). Increased butyrate production following β-mannanase supplementation has been reported in chickens (Zhang et al. 2024) and pigs (Tiwari et al. 2018), and it could help explain the reduction in IL-6 and TNF-α by regulating T cells (Chen and Vitetta 2020). Thus, these findings and the results of this study suggest that β-mannanase in LCD, by increasing MOS, can beneficially alter intestinal microbial composition, thereby reducing pro-inflammatory cytokine, including IL-6, and potentially enhancing intestinal health and reducing diarrhea in nursery pigs.
In addition to the effects on jejunal IL-6, supplementing β-mannanase in LCD improved the ileal digestibility of NDF and EE in this study. A possible reason for this improvement may be that β-mannanase breaks down β-mannan in diets, releasing nutrients encapsulated by NSP (Gomez-Osorio et al. 2021). Additionally, by reducing digesta viscosity with β-mannanase, β-mannan decreases its interactions with other compounds, such as proteins and EE (Koshiyama 1966; Kimura et al. 1997), thereby enhancing nutrient digestion (Mok et al. 2013; Jang et al. 2020; Chen et al. 2025), reducing diarrhea, and improving the growth performance of nursery pigs. Although β-mannanase improved the ileal digestibility of EE and NDF, it did not influence the digestibility of energy or crude protein. This may be due to the high proportion of energy-yielding components and crude protein in the diets, which could limit the potential for additional improvements in digestibility by β-mannanase (Kim et al. 2017). Overall, the results of this study indicate that β-mannanase supplementation in high-SBM diets can mitigate the negative impacts on jejunal immune response, nutrient digestibility, and growth performance of nursery pigs, reducing feed cost per BW gain in pig production. Therefore, supplementing β-mannanase in LCD provides economic and performance benefits in pig production.
Conclusion
Increasing the inclusion of SBM by 14% increased the concentration of β-mannan in the LCD with high phytase, which negatively affected intestinal health by increasing jejunal IL-8 contents and decreasing the ileal digestibility of EE, although it reduced the feed cost per unit of BW gain. In contrast, supplementing β-mannanase in the LCD mitigated these negative impacts by reducing jejunal IL-6 contents and increasing the ileal digestibility of NDF and EE. Additionally, β-mannanase in the LCD mitigated the reduction in growth performance caused by the LCD during the early nursery phase (phases 1 and 2), maintaining a feed cost per unit of BW gain similar to that of the LCD. Collectively, the LCD negatively affected intestinal health and growth performance despite reduced feed costs, whereas β-mannanase supplementation effectively improved these outcomes and maintained economic efficiency.
Supplementary Material
skag038_Supplementary_Data
The reference list from the paper itself. Each links out to its DOI / PubMed record.
- 1Aaron DK , Hays VW. 2004. How many pigs? Statistical power considerations in swine nutrition experiments. J Anim Sci. 82:E 245-E 254. 10.2527/2004.8213_suppl E 245x 15471805 · doi ↗ · pubmed ↗
- 2AOAC. 2005. Official methods of analysis of AOAC International. 18th ed. AOAC International.
- 3Arsenault RJ , Lee JT, Latham R, Carter B, Kogut MH. 2017. Changes in immune and metabolic gut response in broilers fed β-mannanase in β-mannan-containing diets. Poult Sci. 96:4307–4316. 10.3382/ps/pex 24629053819 · doi ↗ · pubmed ↗
- 4Baker JT , Deng Z, Sokale A, Frederick B, Kim SW. 2024 a. Nutritional and functional roles of β-mannanase on intestinal health and growth of newly weaned pigs fed two different types of feeds. J Anim Sci. 102:skae 206. 10.1093/jas/skae 20639044687 PMC 11306790 · doi ↗ · pubmed ↗
- 5Baker JT , Duarte ME, Kim SW. 2024 b. Effects of dietary xylanase supplementation on growth performance, intestinal health, and immune response of nursery pigs fed diets with reduced metabolizable energy. J Anim Sci. 102:skae 026. 10.1093/jas/skae 02638280204 PMC 10889732 · doi ↗ · pubmed ↗
- 6Barekatain R , Hall L, Chrystal PV, Fickler A. 2024. Nutrient utilisation and growth performance of broiler chickens fed standard or moderately reduced dietary protein diets with and without β-mannanase supplementation. Anim Nutr. 19:131–138. 10.1016/j.aninu.2024.05.00839635419 PMC 11615931 · doi ↗ · pubmed ↗
- 7Barratt ME , Strachan PJ, Porter P. 1978. Antibody mechanisms implicated in digestive disturbances following ingestion of soya protein in calves and piglets. Clin Exp Immunol. 31:305–312.565686 PMC 1541224 · pubmed ↗
- 8Caldwell RA. 1992. Effect of calcium and phytic acid on the activation of trypsinogen and the stability of trypsin. J Agric Food Chem. 40:43–46.