Emissions and leachate profile of MSW disposal sites of metropolitan cities of Pakistan using LandGEM model
Bibi Ilmas, Sofia Khalid, M. Ijaz, Imtiaz Hussain

TL;DR
This study estimates methane emissions and leachate from unmanaged landfills in Lahore and Rawalpindi, Pakistan, highlighting the need for improved waste management.
Contribution
The study provides a detailed emissions and leachate profile using the LandGEM model for MSW sites in two major Pakistani cities.
Findings
Lahore’s SWD systems emitted 133,446 Gg, equivalent to 108 Mt CO₂-eq over 50 years.
LD2 and MB1 in Lahore were the top methane emitters, with 1643 Gg and 1383.9 Gg CH₄ respectively.
Rawalpindi’s SWD systems emitted 958 Gg (7.8 Mt CO₂-eq) with a similar emissions profile to Lahore.
Abstract
The rapid increase in municipal solid waste (MSW) generation across urban centers in Pakistan, combined with insufficient waste management infrastructure, presents a significant environmental and public health challenge. This study assesses methane emissions and leachate generation from major MSW dumpsites in Rawalpindi and Lahore, two of Punjab province’s largest cities. Emissions were estimated and projected over a 50-year active timespan using the U.S. EPA LandGEM model following IPCC 2006 guidelines. Cumulative emissions from Lahore’s solid waste disposal (SWD) systems were calculated at approximately 133,446 Gg, equivalent to 108 Mt CO₂-eq, with contributions comprising 26% methane, 73% carbon dioxide (CO₂), and 0.2% non-methane organic compounds (NMOCs). In contrast, Rawalpindi’s SWD systems generated 958 Gg (or 7.8 Mt CO₂-eq) over their operational life, exhibiting a similar…
Genes, proteins, chemicals, diseases, species, mutations and cell lines named across the full text — each resolved to its canonical identifier and authoritative record.
Click any figure to enlarge with its caption.
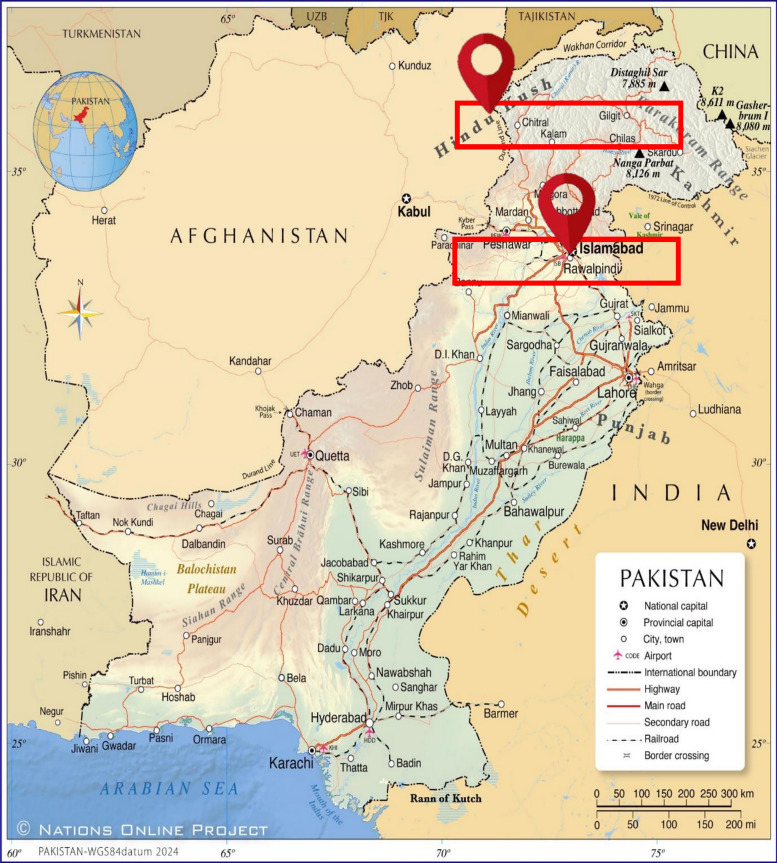 Fig. 1
Peer Reviews
No public reviews on file for this paper yet. If you reviewed it on a platform where reviews are public (OpenReview, ICLR, NeurIPS, ICML), you can paste yours below so the community can read it here.
Videos
No videos yet. Explain this paper in a talk, walkthrough, or lecture? Add one.
Taxonomy
TopicsMunicipal Solid Waste Management · Landfill Environmental Impact Studies · Healthcare and Environmental Waste Management
Introduction
Global warming and climate change, primarily driven by the accumulation of greenhouse gases (GHGs) such as carbon dioxide (CO₂) and methane (CH₄), remain among the most urgent environmental crises of our time. These gases disrupt ecological stability, impact human health, and intensify the frequency and severity of extreme weather events worldwide [46]. The waste sector is a notable contributor to global greenhouse gas (GHG) emissions. Landfill gases (LFGs) are a significant by-product of the anaerobic decomposition of organic components in municipal solid waste (MSW), along with hazardous leachate in landfills and open dumpsites [43, 50].
LFGs are primarily composed of methane (CH₄) and carbon dioxide (CO₂), along with trace amounts of non-methane organic compounds (NMOCs) and volatile organic compounds (VOCs) (IPCC [63]). Methane, a potent greenhouse gas with a global warming potential 25 times that of CO₂ over a 100-year timeframe, is particularly concerning due to its role in accelerating climate change [16]. The generation of landfill gas typically begins within months of waste deposition and can continue for decades, depending on the composition, moisture content, temperature, and management practices of the landfill (U.S. [32]).In developing countries, including Pakistan, the impact is more pronounced because of inadequate waste collection, lack of segregation at source, and the prevalence of unmanaged disposal methods, which result in higher rates of uncontrolled methane emissions [21, 60].
Leachate composition and volume are affected by various factors, including waste characteristics, moisture levels, climatic conditions, and the compaction and degradation processes in dumpsites [44]. In South Asian countries like Pakistan, poorly managed dumpsites often lead to leachate accumulation without appropriate containment or treatment, threatening soil, surface water, and groundwater quality [13]. The lack of bottom liners, leachate collection systems, and impermeable covers facilitates contaminant migration into adjacent ecosystems, resulting in long-term environmental degradation and public health risks [12, 48, 64]. Implementing engineered landfill designs, leachate collection and treatment systems, and systematic site monitoring is crucial to mitigate these environmental impacts [66].
The quantity and rate of LFG production are commonly estimated using models such as the IPCC’s First Order Decay (FOD) method or the U.S. EPA’s LandGEM model, which require parameters like the methane generation potential (Lo) and methane generation rate constant (k) (IPCC [63]; U.S. [32]). Effective quantification and management of landfill gases are essential not only for climate change mitigation but also for capturing methane as a renewable energy source, thereby aligning waste management with circular economy principles [31].
In Pakistan, MSW management is characterized by systemic challenges, including a lack of segregation at source, informal waste collection, limited recycling infrastructure, and reliance on open dumping or unmanaged landfills. These issues not only pose significant public health risks but also result in elevated and poorly documented methane emissions. In Pakistan, the waste sector contributes about 3% to the national GHG inventory, with landfill methane emissions accounting for nearly 73% of the sector’s total emissions [36]. These emissions are expected to increase significantly due to rapid urbanization, projected to grow at an annual rate of 3.65% (ADB [62]), and rising per capita waste generation. Despite its relatively small share of total emissions, the waste sector presents a substantial opportunity for low-cost mitigation through improved landfill management, composting, recycling, and methane capture technologies [65]. Studies such as those by [14], Zuberi et al. [61], and Korai et al. [29] have attempted to model GHG emissions using basic first-order decay (FOD) models or tools like the U.S. EPA’s LandGEM. However, these efforts have largely been limited to specific cities with inconsistent input parameters and a lack of integration with Pakistan-specific waste characteristics. Furthermore, Pakistan continues to rely on Tier 1 methodologies under the 2006 IPCC Guidelines, using default emission factors and without incorporating localized waste composition, climatic conditions, or landfill management practices. This results in substantial uncertainties in national GHG inventories. In contrast, countries with advanced waste systems have transitioned to Tier 2 or Tier 3 approaches with site-specific emission factors and robust data collection frameworks, leading to more accurate estimations and targeted mitigation strategies.
Despite these findings, a critical research gap exists in the form of updated, region-specific emission baselines for solid waste disposal sites using locally calibrated models. Current estimates are not only fragmented but also inadequate for informing policy-level decisions aligned with Pakistan’s Nationally Determined Contributions (NDCs) under the Paris Agreement.
Therefore, this study aims to develop a robust, localized baseline of methane emissions from selected MSW disposal sites in Pakistan using improved modeling approaches and accurate field-based parameters. This will provide a more realistic representation of the sector’s contribution to national GHG inventories and support evidence-based mitigation policies.
Present study
The objective of this study is to quantify greenhouse gas (GHG) emissions and leachate estimations from municipal solid waste (MSW) disposal sites in two major cities of Punjab, Pakistan: Rawalpindi and Lahore (Fig 1). Utilizing the LandGem mathematical model version 3.02, this research endeavours to provide a comprehensive emissions profile for these metropolitan cities and to propose strategies for mitigating these emissions. Punjab is Pakistan’s most populous province, with an estimated population of 110 million and a growth rate of 2.17% (Pakistan Bureau of Statistics [40]).
HYPERLINK "sps:id::fig1||locator::gr1||MediaObject::0" Pakistan map showing studied sites of Rawalpindi & Lahore
The emissions data gathered from the studied cities can serve as a valuable benchmark for evaluating waste sector emissions in other regions of Pakistan. This assessment included on-site evaluations of dumpsites and aimed to inform policy development while enhancing sustainable waste management practices. Ultimately, this research seeks to bolster Pakistan’s efforts to combat climate change and provide critical data for local governments and environmental agencies to mitigate the environmental impact of urban waste and strengthen the resilience of cities.
Materials and methods
Present solid waste management infrastructure
An assessment of the existing infrastructure for municipal solid waste management has been carried out through visits to various relevant departments. These include the Punjab Environmental Protection Agency (EPA) offices in Lahore and Rawalpindi, the Cantonment boards (CBs) of both cities, such as Walton Cantonment Board, Lahore Cantonment Board (LCB) of Lahore, and CCB (Chaklala Cantonment Board), RCB (Rawalpindi Cantonment Board) of Rawalpindi, the Rawalpindi Waste Management Company (RWMC), and the Lahore Waste Management Company (LWMC).
Rawalpindi situation
Rawalpindi generates approximately 0.61 to 0.28 kilograms of municipal solid waste per capita daily, totaling an estimated 1200 to 1300 tons [4, 24, 27]. Approximately 70 to 80 percent of this waste is collected, while the remainder is managed by informal sectors, incinerated, or left uncollected. Open dumping constitutes over 80 percent of the waste management strategy. The Rawalpindi Waste Management Company (RWMC), established in 2014, oversees waste collection and disposal at the Losar Landfill via a transfer station on Murree Road, but does not include waste recovery or treatment processes. The Rawalpindi Cantonment Board (RCB) and Chaklala Cantonment Board (CCB) manage waste within their jurisdictions, disposing of it at temporary dumpsites located at a distance from the city center. These sites are leased for defined periods and subsequently levelled and repurposed for construction. This practice poses significant risks to residents, including the potential for methane-induced explosions and fires, with both cantonments currently utilizing rented land at the ‘Chakri’ site for disposal activities.
Lahore situation
Lahore generates approximately 6,000–6500 tons of waste daily, with a per capita rate averaging 0.61 kilograms per day [20]. The city is divided into nine towns, with Ravi Town as the largest contributor at 607 tons per day, followed by Samanabad and Allama Iqbal Towns at 593 and 591 tons, respectively. The Lahore Waste Management Company (LWMC) manages waste disposal at the Lakhodair Sanitary Landfill (27% of municipal solid waste) and the Lakhodair dumping site (73%). The decommissioned Mahmood Booti site still poses challenges, such as odors and environmental contamination. Around 25% of residential societies in Lahore are managed by housing administrations serviced by the LWMC. Informal recycling by sanitation workers is common, with mixed waste often disposed of openly. “Lahore Compost” is estimated to recycle 700 to 1,000 tons of waste daily, along with an unknown amount being recycled illicitly by scavengers who may burn waste to recover materials, contributing to environmental pollution.
Methodology for emissions profiling
The emissions from various disposal sites in the study areas were analysed using the First Order Decay (FOD) method preferred by the Intergovernmental Panel on Climate Change (IPCC). LandGEM Model version 3.1(January 2025) was used, which is based on a first-order decomposition rate equation (Eq. 1) for quantifying emissions from the decomposition of landfilled waste in municipal solid waste (MSW) landfills.
\documentclass[12pt]{minimal} \usepackage{amsmath} \usepackage{wasysym} \usepackage{amsfonts} \usepackage{amssymb} \usepackage{amsbsy} \usepackage{mathrsfs} \usepackage{upgreek} \setlength{\oddsidemargin}{-69pt} \begin{document}$$\begin{aligned}{G}_{CH4}= & {\sum }_{x=S}^{T-1}{W}_{x}\times MCF\times DOC\times \\& {DOC}_{f}\times F\times \frac{16}{12}\times \left({e}^{-k(T-x-1)}-{e}^{-k(T-x)}\right) \end{aligned}$$\end{document}whereas
G_CH4_ = Modeled methane generation rate in reporting year T (metric tons CH_4_)
x = Year in which waste was disposed
W_x_ = Quantity of waste disposed in the landfill in year x (metric tons)
DOC = Degradable organic carbon (Mg C/Mg waste)
T = Reporting year for which emissions are calculated
S = Start year of calculation
MCF = Methane correction factor (fraction)
DOC_f_ = Fraction of DOC dissimilated (fraction)
F = Fraction by volume of CH4 in landfill gas
k = Rate constant (yr^−1^)
Model Input Parameters are established in Table 1.Table 1. Model input parametersParameterUnitInput valueReference/justificationk = Rate constant year^−1^Fraction0.091. Warm, arid to semi-arid climatic conditions, High biodegradability, and poor landfill practices [60]2. Similar regional studies (India, Bangladesh, Indonesia): Often use k = 0.06 to 0.1 yr⁻^1^ for open dumpsites with high food waste content [7, 45]Potential Methane Generation Capacity, L_o_m^3^/Mg70Ahmed et al. ([3]2021)(site-component conservative)NMOC Concentrationppmv as hexane600U.S. EPA LandGEM DefaultWx = Quantity of waste disposed in the landfill in year x(Mg)346,750 Mg/yr (Rawalpindi)2,372,500 Mg/yr(Lahore)Site waste records from relevant authoritiesDOC = Degradable organic carbon(g C/g waste)Inventory Bulk waste—0.17Pakistan-specific studies (e.g., UNEP [68], Pakistan [22, 32, 49])MCF = Methane correction factor(fraction)0.8Unmanaged, deep > 5 munmanaged shallow siteIPCC ([63], 2019) defaults; Pakistan landfill studies [22, 49]DOC_f_ = Fraction of DOC dissimilated(fraction)0.5[22, 49]F = Fraction by volume of CH_4_ in landfill gas(fraction)0.51. U.S. EPA LandGEM [32] – default CH₄ content: 50%(0.5)2. Zuberi & Ali [60] – modelled 50% CH₄ content in Pakistan dumpsites3. Batool & Nawaz [13] – CH₄ content estimated ~ 47–50% in Lahore MSW
Leachate modelling and sensitivity analysis
Leachate generation is calculated for a recent year 2024, using the method adopted by [23] and [37].
\documentclass[12pt]{minimal} \usepackage{amsmath} \usepackage{wasysym} \usepackage{amsfonts} \usepackage{amssymb} \usepackage{amsbsy} \usepackage{mathrsfs} \usepackage{upgreek} \setlength{\oddsidemargin}{-69pt} \begin{document}$$V \, = \, 0.15 \, \times \, R \, \times \, A$$\end{document}where
V = volume of leachate discharge in a year (m3/year)
R = annual rainfall (mm)
A = surface area of the landfill (m2)
R and A values are site-specific. Annual rainfall was taken from the Pakistan Meteorological Department (PMD). The method employs a coefficient of 0.15 to encompass all landfill losses without considering multiple parameters. The total leachate quantity is typically more than 75% of precipitation during active and closed phases. The peak leachate rate is influenced by peak precipitation and waste height. If peak precipitation aligns with minimal waste height, the peak leachate rate is directly proportional to the precipitation rate. However, if peak precipitation occurs when the waste height is substantial, there is a delayed effect, resulting in a peak leachate rate lower than the peak precipitation rate.
Sensitivity analysis
To evaluate the influence of operational factors on leachate generation, a scenario-based sensitivity analysis was performed. The analysis considered two parameters—seasonal waste cover (fraction of rainfall prevented from infiltration) and waste compaction (reduction of percolation due to density increase).
The baseline leachate volumes were derived from monthly rainfall and measured leachate data for each dumpsite. The model was modified under combinations of four cover effectiveness levels (0%, 25%, 50%, 75%) and four compaction factors (1.00, 0.85, 0.70, 0.50) using the expression:
\documentclass[12pt]{minimal} \usepackage{amsmath} \usepackage{wasysym} \usepackage{amsfonts} \usepackage{amssymb} \usepackage{amsbsy} \usepackage{mathrsfs} \usepackage{upgreek} \setlength{\oddsidemargin}{-69pt} \begin{document}$${\mathrm{Q}}_{\mathrm{L},\mathrm{scenario}}={\mathrm{Q}}_{\mathrm{L},\mathrm{baseline}}\times (1-{\mathrm{E}}_{\mathrm{cover}})\times {\mathrm{F}}_{\mathrm{compaction}}$$\end{document}This approach, though simplified, enables quantitative comparison of how management practices (covering and compaction) affect annual leachate generation.
Results and discussions
Potential emissions sites
This study assesses three municipal final solid waste disposal sites of Lahore and one of Rawalpindi (Figs. 2). Detailed information about these sites is provided in Table 2.Fig. 2. Studied dumpsite location of Rawalpindi & LahoreTable 2Attributes of identified solid waste disposal sitesIDsRawalpindiLahoreLD1MB1LD2LF3SWDsLosar dumpsiteMehmood booti DumpsiteLakhodair dumpsiteLakhodair sanitary landfill (Lot I and II)Location33°25′13.4"N,73°11′01.2"E31˚36′39.90" N74˚23′08.57" E31˚37′36.62" N74˚25′07.64" E31˚37′36.62" N74˚25′07.64" EStarted200319972016April, 2016Closure/Expected closure2025201620302027Managing authorityRWMCCDGLLWMCLWMCDisposal site area30 hectares(300,000 m^2^)16 hectares(160,000 m^2^)53 hectares(530,000 m^2^)20 hectares(200,000 m^2^)Waste capacityNot determined25,00,000 tNot determined1,500,000 tDaily receival (TPD)900–10004000(closed now)40002500Socioeconomic status of service areasUrban + ruralUrban + rural areasUrbanUrbanWaste on-site managementSpreading and compaction and soil layeringDumpingSpreading and compaction and soil layeringWaste burial in landfill cellsLFG collection systemNilNilNilGas vents are installed to capture after closure of cellsAnnual precipitation(mm)≈53.02≈24.76≈24.76≈24.76Climate type(Köppen & Geiger)Non-Arid/wet climateSemi-Arid/Moderate climateSemi-Arid/moderate climateSemi- Arid/moderate climateMean annual temperature (°C)22323232
Emissions profiles of SWDs
Rawalpindi SWD emissions
Table 4 in Annexure illustrates the longitudinal trends in waste deposition and subsequent emissions from the Losar dumpsite between 2003 and 2052. During this period, the site received progressively increasing quantities of municipal solid waste (MSW), culminating in a total waste-in-place of 5.89 million megagrams (Mg) by 2025. Total gas emissions rose steadily to a peak of 43.81 Gg/year in 2025, accompanied by maximum methane and carbon dioxide outputs of 11.7 Gg/year and 32.1 Gg/year, respectively.
The period from 2016–2030 is identified as the most favourable timeframe for the effective capture of methane and landfill gas at this site (Fig. 3). The environmental footprints of this site are 7.6 Mt-CO_2_ eq for its whole lifespan (Table 3). Landfill gas (LFG) production exhibited a corresponding trend. Post-closure, a predictable decline in gas generation occurred, following a first-order decay function, which is consistent with IPCC modelling frameworks and empirical studies [53, 63]. Notably, waste input might cease in 2026 as per the plan, after which the landfill will transition into a closed state. But still, no plan for methane capturing or WtE program is reported.Fig. 3. Landfill waste accumulation and emission trends at losar dumpsite (L1)Table 3. Summary of 50 years’ emissions profile of Rawalpindi and Lahore SWDsSitesTotal Emissions (Gg))Methane (Gg) → CO₂-eqCO₂ (Gg)NMOC (Gg)Total Gg CO₂-eqMt-CO_2_ eqLD1958.5255.97 → 7167.1702.31.77869.47.9MB15181.71383.9 → 38,747.237978.942,544.842.5LD261521643 → 46,00445081150,510.050.5LF32011.1537 → 15,03614743.4616,51016.5
Even after the cessation of waste acceptance, Losar is projected to emit residual methane for several decades. By 2052, methane generation is expected to decline to 1.03 Gg/year, approximately 9% of the peak value. Such prolonged emission tails have been observed at other landfills worldwide and reflect the slow degradation of recalcitrant organics under anaerobic conditions [11, 58].
Methane generation is directly proportional to the rate at which biodegradable substrates are metabolized by microbial communities under anaerobic conditions. The diverse waste fractions accepted at Losar, particularly food residues, contribute essential nutrients (e.g., carbohydrates, proteins, and lipids), enhancing microbial activity [24, 52, 54]. Rawalpindi’s typical diet, rich in wheat, barley, rice, pulses, and fats, supplies ample organic carbon, fostering methanogenesis. However, the heterogeneous composition of unsegregated waste, which includes plastics, rubber, metals, textiles, and inert materials, hinders complete biodegradation. These non-biodegradable fractions can dilute the effective biodegradability of the overall waste stream, potentially reducing methane yield [25, 47]. This duality in waste composition likely influenced the shape and intensity of the methane emission curve observed at Losar.
This sustained emission profile underscores the necessity for long-term post-closure monitoring and gas capture infrastructure. International guidelines recommend continued gas extraction until emissions fall below defined regulatory thresholds (e.g., US EPA NMOC limits), often requiring systems to remain operational for 20–30 years post-closure (US [67]). Furthermore, incorporating engineered biocovers or biofilters could enhance methane oxidation and reduce atmospheric release (Huber-Humer et al., 2008).
Lahore SWDs emissions
The emissions from the solid waste dumping sites (SWDs) in Lahore city are depicted in Figs. 4, 5, and 6. These figures show significant variability in total lifetime emissions, emission trajectories, and peak emission periods across different sites. Each of these factors has critical implications for strategies aimed at mitigating greenhouse gas (GHG) emissions. Additionally, Tables 5, 6, and 7 in the Annexure illustrate the model-computed longitudinal trends in waste deposition and the subsequent emissions from the key SWDs in Lahore, covering a period from the initial waste received through the following 50 years.Fig. 4. Landfill waste accumulation and emission trends at mehmood booti dumpsite (MB1)Fig. 5. Landfill waste accumulation and emission trends at lakhodair dumpsite (LD2)Fig. 6. Landfill waste accumulation and emission trends at lakhodair landfill (LF3)
Mehmood Booti (MB1) (Fig. 4), despite being a closed site, exhibits a substantial legacy emission burden. It reached its peak methane emission of 65.83 Gg in 2017, shortly after closure. The peak aligns with the typical lag in maximum methane generation following the accumulation of biodegradable organic matter. Though emissions have gradually declined since then, MB1 continues to release more than 1 Gg/year of methane up to the mid-2040s. The environmental footprints of this site for the whole lifespan are 42.5 Mt-CO_2_ eq. (Table 3). 2006–2025 were recorded as significant years for methane capture. This prolonged emission tail presents a legacy climate risk, highlighting the importance of post-closure gas management, such as biocover systems or passive venting infrastructure.
Lakhodair Dumpsite (LD2) (Fig. 5), accounts for the highest cumulative methane emissions, releasing approximately 1,545 Gg of CH₄ over its operational and post-closure lifespan. The environmental footprints of this site for the whole lifespan are 50.5 Mt-CO_2_ eq. (Table 3). This surpasses both MB1 and LF3 due to its extended period of fresh municipal solid waste (MSW) intake (~ 4,000 tons/day) and the absence of engineered landfill gas (LFG) capture systems. Emission modeling shows a continual increase in methane output, culminating in a peak value of 78.25 Gg in 2036—the highest annual CH₄ emission recorded across all sites. 2024–2045 were recorded as significant years for methane capture. This projection establishes LD2 as the most critical site requiring immediate intervention through methane capture technologies before the 2030s.
Lakhodair Landfill (LF3), the first sanitary landfill in Pakistan, recorded a peak methane (CH₄) emission of 31.30 Gg during significant years for methane capture. Over its entire lifespan, the environmental footprint of this site amounts to 16.5 Mt of CO₂ equivalent. The Lahore Waste Management Company (LWMC) has implemented gas vents and capturing infrastructure to capture methane gas effectively. Currently, only two cells are operational, which limits the waste reception capacity and subsequently restricts the potential for methane generation.
Cumulative emissions from Lahore’s solid waste disposal (SWD) systems were calculated at approximately 133,446 Gg, equivalent to 108 Mt CO₂-eq, with contributions comprising 26% methane, 73% carbon dioxide (CO₂), and 0.2% non-methane organic compounds (NMOCs). In contrast, Rawalpindi’s SWD systems generated 958 Gg (or 7.9 Mt CO₂-eq) over their operational life, exhibiting a similar emissions profile. Two unmanaged Lahore sites—LD2 (1643 Gg CH₄) and MB1 (1383.9 Gg CH₄)—emerged as the most significant methane emitters across both cities. The temporal patterns highlight the unique emission risk profiles. For the LD2 profile, there is a rising methane curve with a peak expected in 2036, indicating an urgent need for methane capture infrastructure. The MB1 profile shows a post-peak decline followed by a long emission tail, suggesting the necessity for legacy emission monitoring and mitigation strategies. Meanwhile, the LF3 profile exhibits an early peak that gradually declines, accompanied by higher emissions of non-methane organic compounds (NMOC), which raises concerns about urban health implications [35]. Cumulatively, Lahore’s total methane emissions surpass those of Rawalpindi, reflecting the city’s larger population, higher waste generation rates, and lifestyle-related waste patterns. Past studies, such as by Munir et al. [39], have reported CO₂ and CH₄ emissions totaling over 50 million kg in Ravi Town alone, aligning with the current study’s estimates and confirming the magnitude of the problem.
The data call for an integrated waste management approach encompassing methane mitigation, NMOC reduction, and long-term emission monitoring for urban environmental sustainability.
The absence of environmental buffers, proper zoning, and engineered barriers in cities like Lahore results in land-use conflicts, odor nuisance, vector-borne diseases, and the devaluation of surrounding property [30]. Moreover, large-scale emissions contribute to atmospheric photochemical reactions, increasing the burden of ground-level ozone (O₃) and smog, further endangering respiratory health, particularly in children and the elderly (WHO [68]).
The environmental implications of these findings are substantial. Lahore, already ranked highest in global air pollution indices, faces compounded challenges from landfill-based emissions. NMOCs have direct consequences for public health, contributing to ozone formation and respiratory disorders [9]. Addressing these emissions necessitates the adoption of advanced landfill management strategies. Based on literature; Methane capture and utilization technologies, optimized landfill covers, and engineered biogas recovery systems [51], waste minimization through enhanced segregation, recycling, and composting could substantially reduce organic load and subsequent methane generation (Thomson et al., 2022) could be adopted for both cities. Proven technologies such as Vertical and horizontal gas extraction wells, Gas flaring units, and Biogas-to-electricity plants have been successfully implemented in countries with similar waste streams and climatic conditions (e.g., India, Brazil). For example, India’s Ghazipur and Bhalswa sites are now equipped with gas capture systems that mitigate over 50 Gg CH₄/year, which parallels the emissions estimated in this study (Kaushal & Sharma 2016).
Comparing emissions across regions remains complex due to heterogeneity in waste composition, climate, and landfill management. The limited availability of emission studies from open dumpsites in developing countries underscores the need for more empirical research to support evidence-based waste policy formulation (IPCC [26]b; Kaza et al., 2018). The scale and intensity of emissions, particularly at Lakhodair Dumpsite (LD2), suggest strong feasibility for landfill gas recovery and utilization systems. Lahore’s waste profile—high in organic fraction also makes it a strong candidate for anaerobic digestion (AD) and waste-to-energy (WTE) projects.MSW in Rawalpindi and Lahore could generate 49 MW and 341 MW of electricity daily, respectively, if supported by suitable policies and technologies [24]. AD technology could be deployed at transfer stations or decentralized waste processing centers to pre-treat organics, reducing landfill loading and methane generation.
Both cities’ data represent a major untapped opportunity for climate mitigation, renewable energy production, and improved urban environmental health. By translating emissions data into targeted interventions—both technological and regulatory—the city can move toward a low-carbon waste management future while addressing critical public health vulnerabilities.
Results: leachate generation and sensitivity analysis
Leachate generation
Leachate generation exhibited a strong positive correlation with rainfall patterns across the study period (Figs. 7 & 8). Rainfall displayed marked monthly variability, peaking at 408 mm in July, consistent with regional monsoon dynamics reported by Mahmood et al. (2019) and Khan et al. (2022). The monsoon months (July–September) received 320–408 mm of rainfall, whereas the dry season (November–February) recorded only 10–45 mm. This seasonal variability directly influenced leachate volumes, with maximum generation reaching 18.36 million m^3^ in July and minimum levels of 0.45 million m^3^ in November, confirming rainfall as the dominant driver of leachate formation, as also observed by Aziz et al. (2020). The relationship between rainfall and leachate generation reflects a multiplier effect (Chen et al., 2022), wherein infiltration through waste layers amplifies the rainfall input due to waste porosity, inadequate cover, and hydraulic connectivity. The resulting leachate is a complex effluent containing ammonia, heavy metals, volatile organics, and pathogens, posing substantial risks to groundwater and soil quality ([19], [28]). Alao [8] reported comparable contamination trends in Nigerian dumpsites, where safe groundwater was only available below 23 m, indicating extensive leachate percolation. Such findings underscore the urgent need for seasonal leachate management strategies, including optimized cover application, treatment capacity adjustments, and real-time monitoring during high rainfall periods ([57], [55]).Fig. 7. Leachate generation potential of SWDs of RawalpindiFig. 8Leachate generation potential of SWDs of Lahore
The sustained high leachate concentrations observed in the present study highlight potential contamination risks for underlying aquifers and adjacent soils, emphasizing the necessity of integrated landfill design and operational control to mitigate long-term environmental degradation.
Sensitivity analysis
The sensitivity analysis (Fig. 9) demonstrated that both surface cover efficiency and waste compaction substantially influence leachate generation. Increasing cover application to 50% combined with a compaction factor of 0.70 reduced total leachate output by 35–45% relative to baseline conditions. The tornado-style plot illustrates that dumpsites R1 and LD2 exhibited the highest sensitivity, with changes exceeding 40%, indicating that site-specific operational improvements could yield significant reductions in leachate flux.Fig. 9. Sensitivity analysis of leachate generation from all studied sites
These results align with previous landfill hydrology studies that highlight the dominant role of operational parameters in controlling moisture infiltration [17, 28, 42]. Enhanced daily or seasonal cover and higher compaction densities effectively limit infiltration and percolation, thereby lowering both the quantity and pollutant load of generated leachate [18], [1]. Al-Yaqout and Hamoda [6] and Lou and Nair [34] similarly observed that intermediate cover systems can reduce infiltration by up to 60–70% per cent, particularly in tropical environments.
While the simplified multiplicative model used here does not capture all hydrological complexities—such as evapotranspiration dynamics or preferential flow pathways—it provides a first-order quantitative estimate of leachate response to operational modifications. Comparable parametric approaches have been effectively employed by Beaven [15] and Abushammala et al. [2] to assess settlement and leachate variability under different landfill management regimes.
Future studies should integrate process-based hydrological models such as SWAT, HYDRUS, or HELP to simulate unsaturated flow and moisture redistribution in greater detail [33, 59]. Nonetheless, the current analysis demonstrates that operational optimization—through increased compaction and improved cover efficiency—can substantially mitigate leachate generation, supporting the broader consensus that effective management practices are as critical as engineered controls in achieving sustainable landfill performance.
The seasonal magnitudes and pollutant loads reported here are consistent with findings from comparable South Asian sites. Field studies from Lahore indicate pronounced monsoon peaks in leachate volume and high organic and inorganic pollutant concentrations [10], and detailed leachate characterizations from Dhaka landfills (Matuail, Amin Bazar) report similar seasonal spikes in BOD, COD, NH₄⁺ and heavy metals during monsoon months [5, 41]. Studies from India and Sri Lanka likewise document strong monsoon-driven increases in leachate flux and groundwater impacts [38, 56], while national methane inventories and city-scale studies for Pakistan and India provide congruent orders of magnitude for CH₄ emissions from unmanaged disposal sites [49], LandGEM applications). Collectively, these South Asian studies validate the direction and approximate magnitude of our emission and leachate outputs and support the recommendation for seasonal scaling of leachate treatment and intensified monitoring during peak rainfall.
Conclusions & recommendations
Landfill sites in Lahore and Rawalpindi are major sources of gas emissions, releasing a total of 13,344 Gg (109 Mt-CO_2_ Equ.) and 958.5 Gg (7.8 Mt-CO_2_ Equ.) respectively, over their 50-year operational lifespan. The lack of scientifically sound treatment methods contributes to increased greenhouse gas (GHG) emissions from dumpsites and landfills, which generate significant leachate that poses a threat to groundwater and soil. The growing population, urbanization, and changing lifestyles further exacerbate future waste quality and emissions. This research establishes a quantitative baseline for capturing landfill gas (LFG) to support waste-to-energy (WtE) initiatives, providing a strategy to reduce emissions and combat climate change.
Future studies should focus on the long-term effects of climate change on leachate generation, real-time monitoring systems, and predictive models to better understand and manage these complex interactions. Key enabling actions include:
- Public–private investment schemes for WtE facilities (as piloted in Karachi)
- Regulatory approvals and feed-in tariffs for electricity from biogas under NEPRA’s renewable energy policy
- Pilot-scale deployment of CALMIM or IPCC Tier II hybrid systems for better methane prediction and recovery design
LandGem model limitations and way forward
The U.S. EPA’s Landfill Gas Emission Model (LandGEM v3.1) was applied to estimate methane and NMOC emissions. However, its assumptions—such as a single first-order decay process, fully anaerobic conditions, and default parameter values (k and L₀)—may not accurately represent the characteristics of unmanaged open dumps in Pakistan. These sites exhibit heterogeneous waste composition, partial aeration, moisture pulses from monsoon events, and an absence of gas collection systems. Consequently, LandGEM may overestimate emissions under default anaerobic conditions or underestimate them when localized wet zones and surface hotspots dominate gas release. To address this, locally derived waste composition data and sensitivity analyses for k and L₀ were incorporated, and field verification using flux chamber and gas well sampling is recommended.
The reference list from the paper itself. Each links out to its DOI / PubMed record.
- 1Abdallah, M., Shanableh, A., Shabib, A., & Adghim, M. (2018). Financial feasibility of waste to energy strategies in the United Arab Emirates. Waste Management, 82, 207-219. 5.10.1016/j.wasman.2018.10.02930509583 · doi ↗ · pubmed ↗
- 2Batool, S. A., Chaudhry, N., & Majeed, K. (2008). Economic potential of recycling business in Lahore, Pakistan. Waste management, 28(2), 294-298. 6.10.1016/j.wasman.2006.12.00717475469 · doi ↗ · pubmed ↗
- 3El-Fadel, M., Bou-Zeid, E., Chahine, W., & Alayli, B. J. W. M. (2002). Temporal variation of leachate quality from pre-sorted and baled municipal solid waste with high organic and moisture content. Waste management, 22(3), 269-282. 2.10.1016/s 0956-053x(01)00040-x 11952174 · doi ↗ · pubmed ↗
- 4IPCC 2006 a. 2006 IPCC guidelines for national greenhouse gas inventories: volume 5 – waste. Intergovernmental Panel on Climate Change. 2006. Retrieved from https://www.ipcc-nggip.iges.or.jp/public/2006 gl/vol 5.html
- 5US EPA. Overview of greenhouse gases: Methane emissions. United States Environmental Protection Agency. 2013. https://www.epa.gov/ghgemissions/overview-greenhouse-gases#methane
- 6World Health Organization (WHO). Ambient air pollution: A global assessment of exposure and burden of disease. 2016. https://www.who.int/publications/i/item/9789241511353