Comparison of non-contrast CT, CT perfusion, and CT angiography for predicting delayed cerebral ischemia after aneurysmal subarachnoid hemorrhage
Xin Yao, Haifeng Cheng, Chen Yang, Xiaojun Hao, Xintong Zhao, Xinggen Fang, Yunfeng Zhou, Chao Zhang

TL;DR
Non-contrast CT scans at admission are better than other imaging methods for predicting delayed cerebral ischemia in aneurysmal subarachnoid hemorrhage patients.
Contribution
This study compares the predictive accuracy of non-contrast CT, CT perfusion, and CT angiography for delayed cerebral ischemia in aneurysmal subarachnoid hemorrhage patients.
Findings
The NCCT model had the highest predictive accuracy (AUC: 0.837) compared to CTP and CTA models.
All three models showed good calibration and reliable internal validation results.
In poor-grade aSAH patients, NCCT and CTP models had similar predictive abilities.
Abstract
Non-contrast CT (NCCT), CT perfusion (CTP), and CT angiography (CTA) are recommended for predicting delayed cerebral ischemia (DCI) after aneurysmal subarachnoid hemorrhage (aSAH). However, not all patients can undergo all three examinations on admission. We aimed to compare the predictive abilities of NCCT, CTP, and CTA for DCI. This retrospective study enrolled consecutive aSAH patients admitted to our center between November 2015 and September 2023. NCCT, CTP, and CTA models were constructed using logistic regression analyses adjusted for confounders. The model performances were assessed by discrimination and calibration. Internal validation was conducted using bootstrapping. The predictive abilities were further evaluated in subgroup analyses. A total of 950 patients (median [IQR] age: 59 [51–68] years; 651 women) were enrolled, of whom 246 (25.9%) developed DCI. The NCCT model…
Genes, proteins, chemicals, diseases, species, mutations and cell lines named across the full text — each resolved to its canonical identifier and authoritative record.
Click any figure to enlarge with its caption.
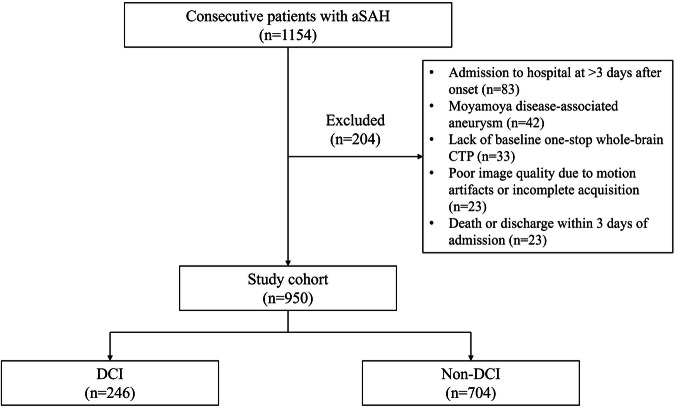 Figure 1
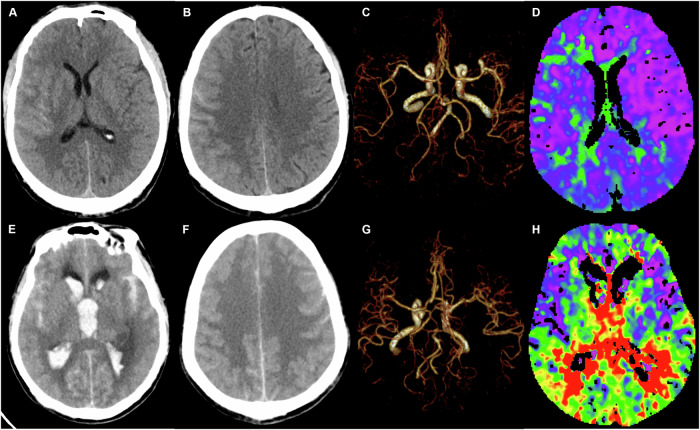 Figure 2
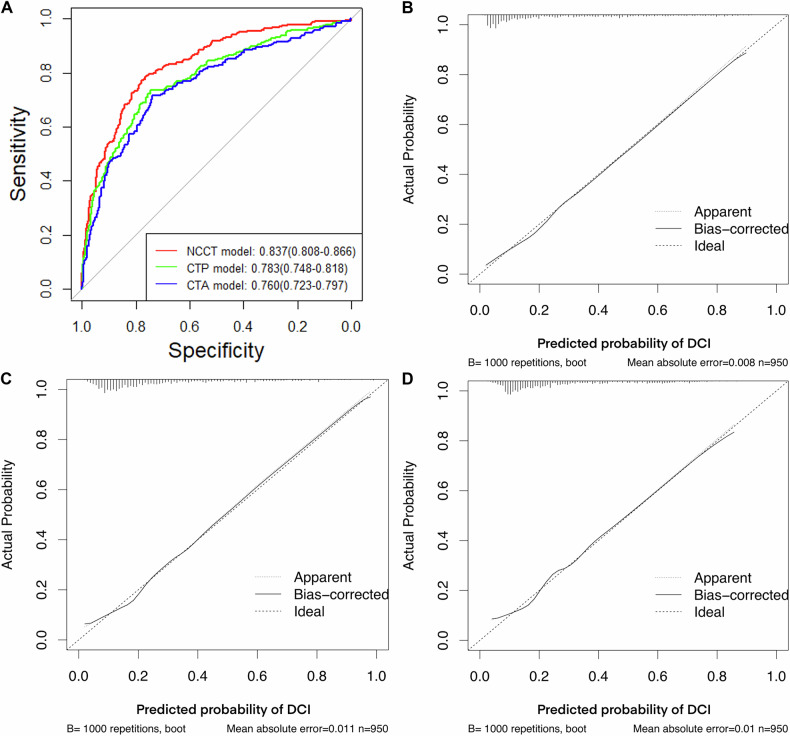 Figure 3
 Figure 4
- —Natural Science Research Project in Anhui Universities
- —Beijing Medical Award Foundation - Ruiying Scientific Research Fund Sponsored Project
- —Yijishan Hospital of Wannan Medical College
Peer Reviews
No public reviews on file for this paper yet. If you reviewed it on a platform where reviews are public (OpenReview, ICLR, NeurIPS, ICML), you can paste yours below so the community can read it here.
Videos
No videos yet. Explain this paper in a talk, walkthrough, or lecture? Add one.
Taxonomy
TopicsIntracranial Aneurysms: Treatment and Complications · Cerebrovascular and Carotid Artery Diseases · Acute Ischemic Stroke Management
Introduction
Delayed cerebral ischemia (DCI) occurs in 20%–30% of aneurysmal subarachnoid hemorrhage (aSAH) patients [1] and is a major, potentially modifiable contributor to late disability and mortality [2, 3]. Timely and precise prediction of DCI is the first step in guiding personalized treatment [1, 3]. In clinical practice, the assessment of aSAH severity is initially based on neurological examinations [4]. However, the proportion of poor-grade aSAH survivors has increased in recent years [5], and the clinical changes in these patients may be difficult to detect and have limited prognostic value [1, 3]. Therefore, more effective predictive indicators are needed to identify high-risk patients for developing DCI.
Through studies on the multifactorial mechanism of DCI, several risk factors based on multimodal imaging modalities have been identified. The initial amount of hemorrhage [6–8], the presence of acute hydrocephalus [9], and the severity of early brain edema [10] can be qualitatively and semi-quantitatively assessed using non-contrast CT (NCCT). Aneurysm morphology and cerebral vasospasm (CVS) can be determined using CT angiography (CTA) [11, 12]. These modalities are quick to perform and provide images that are easy to interpret. In recent years, research on CT perfusion (CTP) has rapidly expanded. CTP can detect early cerebral microcirculatory dysfunction after aSAH and may serve as a predictive tool for DCI development [13].
For patients with ischemic stroke, several studies have indicated that NCCT, CTP, and CTA exhibit comparable predictive values [14, 15]. In patients with aSAH, the diagnostic value of CTP for DCI is superior to that of NCCT and CTA during clinical deterioration [16]. However, though the guideline recommends the use of NCCT, CTP, and CTA for the prediction of DCI [3], not all patients are able to undergo all three imaging modalities upon emergency admission. Moreover, it remains unclear whether the predictive performances of the three modalities are comparable. In the present study, we constructed NCCT, CTA, and CTP models and compared the abilities of the three models to predict DCI in aSAH patients.
Materials and methods
Study population
This retrospective observational study was approved by the institutional review board of our institution, and the requirement for patient consent was waived. Using our prospective database for aSAH, we retrospectively reviewed all consecutive patients who had confirmed aSAH on NCCT and digital subtraction angiography within 3 days after onset and were admitted to our single stroke center between November 2015 and September 2023. The inclusion criteria were as follows: (a) age > 18 years; and (b) aneurysm treated with coiling or clipping. The exclusion criteria were as follows: (a) admission to hospital at > 3 days after onset; (b) moyamoya disease-associated aneurysm; (c) lack of baseline one-stop whole-brain CTP (including NCCT, CTP, and CTA); (d) poor image quality due to motion artifacts or incomplete acquisition; and (e) death or discharge within 3 days of admission. A flowchart of the patient selection is shown in Fig. 1.Fig. 1. Flowchart of patient selection. aSAH indicates aneurysmal subarachnoid hemorrhage; CTP, CT perfusion; and DCI, delayed cerebral ischemia
Data collection
Baseline hospitalization data were collected from the aSAH database. The demographic characteristics included age, sex, and hypertension. The clinical severity of aSAH on admission was evaluated using the World Federation of Neurological Surgeons (WFNS) grading scale and dichotomized into good-grade (WFNS 1–3) or poor-grade (WFNS 4–5) aSAH, as previously reported [4].
Based on recent research regarding imaging predictors for DCI, the following imaging data were collected: modified Fisher Score (mFS) [6], intraventricular hemorrhage (IVH) [7], intracranial hematoma [8], acute hydrocephalus [9], and Subarachnoid Hemorrhage Early Brain Edema Score (SEBES) [10] were evaluated on NCCT; ruptured aneurysm size and location [11] and CVS [12] were determined on CTA; and cerebral blood flow (CBF), cerebral blood volume (CBV), mean transit time (MTT), time to delay (TTD), time to start (TTS), and transit time to the center of the impulse response function (TMax) were obtained on CTP. The one-stop whole-brain CTP protocol and CTP post-processing method were described previously [17]. The NCCT, CTA, and CTP data were separately assessed by three neuroradiologists who were blinded to the results of the other two imaging examinations and clinical information. Any differences in their assessments were resolved through consensus. Two representative cases are shown in Fig. 2.Fig. 2. One-stop whole-brain CT perfusion images of patients with and without delayed cerebral ischemia (DCI). A 53-year-old male with evidence of DCI. A,** B** Non-contrast computed tomography (NCCT) demonstrated a modified Fisher Score (mFS) of 1 and a Subarachnoid Hemorrhage Early Brain Edema Score (SEBES) of 1, with no signs of intraventricular hemorrhage (IVH), intracranial hematoma, or acute hydrocephalus. C Computed tomography angiography (CTA) confirmed the presence of a right middle cerebral artery aneurysm. D TMax perfusion imaging revealed comparatively lower perfusion in the right cerebral hemisphere relative to the left. A 62-year-old male patient presented with DCI. E,** F** NCCT revealed an mFS of 4 and an SEBES of 4, along with the presence of IVH and acute hydrocephalus. G CTA identified a left posterior communicating artery aneurysm. H TMax perfusion imaging further demonstrated decreased perfusion across both cerebral hemispheres diffusely
Definition of DCI
The presence of DCI was assessed using the 2010 Multidisciplinary Research Group definition [18], which encompasses (a) onset of focal neurological impairment or decrease of ≥ 2 points on the Glasgow Coma Scale, lasting for at least 1 hour, not immediately caused by an apparent post-aneurysm occlusion and not attributed to other conditions; and (b) presence of a cerebral infarction on CT or MRI within 6 weeks post-onset that was absent on imaging examinations between 24 and 48 hours post-aneurysm occlusion and was not linked to endovascular treatment. Hypodensities on CT resulting from a ventricular catheter or an intraparenchymal hematoma were not considered cerebral infarctions from DCI.
Statistical analysis
Statistical analyses were conducted using SPSS version 25.0 (IBM Corporation) and R version 3.4.2 (R Foundation for Statistical Computing). Significance was defined as a two-tailed value of p < 0.05. Since all continuous variables had non-normal distributions, they were described as the median and interquartile range, and were compared using the Mann–Whitney U-test. All categorical variables were expressed as frequency and percentage, and were compared using the Pearson chi-square test. Imaging variables with values of p < 0.1 in the univariate analyses were entered into the logistic regression analysis with a forward stepwise selection. The NCCT, CTA, and CTP models were then constructed with adjustment for known prognostic variables (age, hypertension, WFNS, and treatment modality) based on the SAHIT multinational cohort study [19]. The predictive abilities of the three models were assessed by discrimination and calibration. Model discrimination was evaluated by receiver operating characteristic (ROC) curve and area under the curve (AUC) analysis. An AUC of 0.70–0.79 was considered good discrimination, and an AUC of 0.80–0.89 was considered excellent discrimination. The Delong test was used to compare the AUC values. Model calibration was evaluated by the Hosmer–Lemeshow test and visualized by calibration plots, with a value of p > 0.05 considered to indicate good calibration. Internal validation was conducted using the bootstrap method to correct for overestimation and obtain the optimism-adjusted AUC [20]. The predictive abilities were further evaluated by subgroup analyses in good-grade and poor-grade aSAH patients.
Results
Patient characteristics
Of the 1154 consecutive patients in the aSAH database, 950 were finally included in the analysis. The median age was 59 years (IQR: 51–68 years), and 651 (68.5%) were women. On admission, 697 patients (73.4%) were identified as good-grade aSAH, and 253 patients (26.6%) were identified as poor-grade aSAH. Regarding treatment, 905 patients (95.3%) underwent coil embolization, and 45 patients (4.7%) underwent microsurgical clipping. DCI developed in 246 patients (25.9%). The patients with DCI were older (65 years [56–73 years] vs. 56 years [51–66 years]; p < 0.001) and more likely to have hypertension (54.5% vs. 41.3%; p < 0.001) and higher WFNS (54.1% vs. 17.0%; p < 0.001) than the patients without DCI (Table 1).Table 1. Univariate analysis of variables between the non-DCI and DCI groupsCharacteristicNon-DCI (n = 704)DCI (n = 246)pDemographic and clinical data Age, years, median (IQR)56 (51, 66)65 (56, 73)< 0.001 Sex, woman, n (%)471 (66.9)180 (73.2)0.068 Hypertension, n (%)291 (41.3)134 (54.5)< 0.001 WFNS, n (%)< 0.001 Poor-grade (4–5)120 (17.0)133 (54.1) Good-grade (1–3)584 (83.0)113 (45.9)NCCT data mFS, n (%)< 0.001 High (3–4)321 (45.6)198 (80.5) Low (0–2)383 (54.4)48 (19.5) SEBES, n (%) High (3–4)68 (9.7)68 (27.6)< 0.001 Low (0–2)636 (90.3)178 (72.4) Intracranial hematoma, n (%)85 (12.1)101 (41.1)< 0.001 IVH, n (%)473 (67.2)222 (90.2)< 0.001 Acute hydrocephalus, n (%)194 (27.6)174 (70.7)< 0.001CTP data CBF, ml/100 g/min, median (IQR)65.63 (60.38, 71.34)60.84 (55.11, 67.04)0.003 CBV, ml/100 g, median (IQR)4.00 (3.77, 4.32)3.88 (3.66, 4.24)< 0.001 MTT, s, median (IQR)4.19 (3.84, 4.68)4.52 (4.07, 5.21)< 0.001 TTS, s, median (IQR)0.43 (0.26, 0.67)0.73 (0.44, 1.05)< 0.001 TTD, s, median (IQR)4.03 (3.51, 4.63)4.82 (4.07, 5.62)< 0.001 TMax, s, median (IQR)1.96 (1.57, 2.36)2.48 (1.97, 3.11)< 0.001CTA data Anterior circulation, n (%)642 (91.2)220 (89.4)0.412 Aneurysm size, mm, median (IQR)4.5 (3.5, 6.2)5.1 (3.9, 7.2)< 0.001 CVS, n (%)573 (81.4%)197 (80.1%)0.652Treatment method0.027 Coiling, n (%)677 (96.2%)228 (92.7%) Clipping, n (%)27 (3.8%)18 (7.3%)CBF cerebral blood flow, CBV cerebral blood volume, CTA CT angiography, CTP CT perfusion, CVS cerebral vasospasm, DCI delayed cerebral ischemia, IVH intraventricular hemorrhage, mFS modified Fisher Score, MTT mean transit time, NCCT non-contrast CT, SEBES Subarachnoid Hemorrhage Early Brain Edema Score, TMax transit time to the center of the impulse response function, TTD time to delay, WFNS World Federation of Neurosurgery Scale
Univariate analyses of imaging variables associated with DCI
DCI was more frequent in patients with IVH (90.2% vs. 67.2%; p < 0.001), intracranial hematoma (41.1% vs. 12.1%; p < 0.001), and acute hydrocephalus (70.7% vs. 27.6%; p < 0.001), and in patients with larger aneurysm size (5.1 mm [3.9–7.2 mm] vs. 4.5 mm [3.5–6.2 mm]; p < 0.001), higher mFS (80.5% vs. 45.6%; p < 0.001), higher SEBES (80.5% vs. 45.6%; p < 0.001), longer MTT (4.52 s [4.07–5.21 s] vs. 4.19 s [3.84–4.68 s]; p < 0.001), longer TTS (0.73 s [0.44–1.05 s] vs. 0.43 s [0.26–0.67 s]; p < 0.001), longer TTD (4.82 s [4.07–5.62 s] vs. 4.03 s [3.51–4.63 s]; p < 0.001), longer TMax (2.48 s [1.97–3.11 s] vs. 1.96 s [1.57–2.36 s]; p < 0.001), lower CBF (60.84 mL/100 g/min [55.11–67.04 mL/100 g/min] vs. 65.63 mL/100 g/min [60.38–71.34 mL/100 g/min]; p = 0.003), and lower CBV (3.88 mL/100 g [3.66–4.24 mL/100 g] vs. 65.63 mL/100 g [60.38–71.34 mL/100 g]; p = 0.001) (Table 1).
Predictive abilities of the NCCT, CTA, and CTP models
Based on the multivariate analysis (Table 2), three logistic regression models were constructed. The discrimination ability was excellent for the NCCT model (AUC: 0.837; 95% CI: 0.808–0.866; p < 0.001) and good for the CTP (AUC: 0.783; 95% CI: 0.748–0.818; p < 0.001) and CTA (AUC: 0.760; 95% CI: 0.723–0.797; p < 0.001) models. The AUC of the NCCT model was significantly higher than that of the CTP (p < 0.001) and CTA (p < 0.001) models, while the AUC of the CTP model was significantly higher than that of the CTA model (p < 0.05). The calibration ability was good for all three models (p = 0.835 for the NCCT model, p = 0.377 for the CTP model, p = 0.096 for the CTA model). The ROC curves and calibration plots for the models are shown in Fig. 3.Fig. 3. Evaluation of model discrimination and calibration. Receiver operating characteristic curves (A) and calibration curves (B–D) are presented for the non-contrast CT, CT perfusion, and CT angiography models, respectivelyTable 2NCCT, CTP, and CTA modelsCharacteristicBeta coefficientOR95% CIpSensitivitySpecificityNCCT model0.7720.778 Age0.0401.0411.023–1.059< 0.001 WFNS0.8112.2491.526–3.316< 0.001 mFS0.6741.9631.281–3.0080.002 IVH0.5211.6831.009–2.8070.046 Intracranial hematoma0.7212.0571.307–3.2380.002 SEBES0.8532.3471.410–3.9050.001 Acute hydrocephalus1.3283.7752.604–5.472< 0.001CTP model0.7360.746 Age0.0481.0491.033–1.065< 0.001 Sex−0.4430.6420.440–0.9360.021 WFNS1.3243.7602.632–5.373< 0.001 TMax0.5991.8201.470–2.253< 0.001CTA model0.7150.739 Age0.0501.0511.035–1.067< 0.001 WFNS1.6885.4063.881–7.530< 0.001 Size0.0591.0611.007–1.1180.027AUC area under the curve, CTA CT angiography, CTP CT perfusion, IVH intraventricular hemorrhage, mFS modified Fisher Score, NCCT non-contrast CT, SEBES Subarachnoid Hemorrhage Early Brain Edema Score, TMax transit time to the center of the impulse response function, WFNS World Federation of Neurosurgery Scale
Regarding internal validation, the discrimination ability was excellent for the NCCT model (optimism-adjusted AUC: 0.840; 95% CI: 0.811–0.870) and good for the CTP (optimism-adjusted AUC: 0.785; 95% CI: 0.748–0.820) and CTA (optimism-adjusted AUC: 0.761; 95% CI: 0.724–0.799) models.
Subgroup analyses
In the good-grade aSAH group, the predictive ability of the NCCT model (AUC: 0.802; 95% CI: 0.757–0.847) was superior to that of the CTP model (AUC: 0.712; 95% CI: 0.659–0.766) (p = 0.001). Notably, no significant differences in the CTA variables were observed between the DCI and non-DCI groups among the good-grade aSAH patients. Therefore, a CTA model was not constructed.
In the poor-grade aSAH group, the predictive ability of the NCCT model (AUC: 0.763; 95% CI: 0.704–0.821) was similar to that of the CTP model (AUC: 0.735; 95% CI: 0.674–0.796) (p = 0.399). Both of these models had superior predictive ability compared with that of the CTA model (AUC: 0.667; 95% CI: 0.601–0.734) (NCCT vs. CTA: p = 0.003; CTP vs. CTA: p = 0.009).
Discussion
Previous studies have demonstrated that several imaging risk factors based on NCCT, CTA, and CTP are predictive of DCI after aSAH [6–13]. However, there is limited knowledge about whether these three imaging modalities have comparable predictive abilities. In this study, NCCT, CTA, and CTP models were constructed for the prediction of DCI, and the predictive abilities of these models were compared. The results showed that the NCCT model, involving easily obtainable variables on admission (age, WFNS, mFS, IVH, intracranial hematoma, SEBES, and acute hydrocephalus), had the best predictive ability for both the entire cohort and the good-grade aSAH group. Meanwhile, there was no difference in predictive ability between the NCCT and CTP models for the poor-grade aSAH group.
NCCT is more cost-effective and readily available than advanced imaging modalities, and provides multiple radiological scales associated with DCI. Two predictive models have been developed by combining clinical and NCCT variables, namely the EDCI score (WFNS, mFS, SEBES, and IVH) [21] and the Practical Risk Chart (WFNS, mFS, Hijdra, and age) [22], with both models demonstrating good discrimination ability. The NCCT model created in this study supports the previous two models, thus increasing confidence in the use of NCCT in clinical practice. More importantly, the prediction ability of the NCCT model (AUC: 0.802; 95% CI: 0.757–0.847) was significantly improved compared with that of the EDCI score (AUC: 0.785; 95% CI: 0.752–0.815) and the Practical Risk Chart (AUC: 0.63; 95% CI: 0.57–0.69). These findings confirm that the NCCT model is accurate and useful for identifying aSAH patients at high risk for developing DCI based on clinical and radiographic data on admission. Although some previous studies compared the predictive values of individual NCCT-based radiological scales [23, 24], a single radiological scale is inevitably one-sided, whereas the NCCT model integrates clinical and imaging data to circumvent this limitation. Thus, the NCCT model can enable better risk stratification and management.
CTP is useful for assessing the early cerebral hemodynamic status after aneurysm rupture [13]. Although some small, single-center studies have proposed optimal cutoff values for different perfusion parameters to predict DCI [17, 25–28], the results were heterogeneous and have not been validated in large external cohorts. Meanwhile, the lack of standardized scanning and post-processing protocols may lead to significant differences in CTP results [29]. It is also worth noting that CTP results are vulnerable to motion artifacts [14], especially in aSAH patients, who are often restless and find it difficult to cooperate with long scanning procedures. Despite this, our subgroup analyses showed that the predictive ability of the CTP model was similar to that of the NCCT model in the high-grade aSAH group. A possible explanation for this finding may be the complexity of the pathophysiology in DCI, because the microcirculatory dysfunction may be more pronounced in poor-grade aSAH patients, and the NCCT model cannot adequately reflect these changes [13, 16]. Another possible explanation is that poor-grade aSAH patients with a decreased level of consciousness may have more accurate CTP results due to the absence of significant motion artifacts.
CTA provides the characteristics of a ruptured aneurysm and can detect CVS. However, it is difficult to detect a distal vasospasm caused by a microthrombus [13, 30]. We found that CVS on admission had no significant correlation with DCI in either the univariate or multivariate analyses. These findings confirm previous data showing that DCI often occurs in patients without CVS [30]. Therefore, our finding that the predictive ability of the CTA model was significantly lower than that of the NCCT and CTP models was not unexpected. The present findings also highlight the predictive value of CTP for the detection of ischemic tissues remote from the site of CVS [13].
This study has some limitations. First, it was a single-center retrospective observational study, and although it had a relatively large sample size, potential selection bias was inevitable. Second, the lack of external validation may limit the applicability of the findings. Third, considering the clinical applicability, we included only the most representative mFS in the NCCT model, rather than several hemorrhage volume scores, such as the BNI, Hijdra, and Claassen scales.
Conclusions
Overall, the NCCT model showed excellent performance in predicting DCI at admission and had better predictive ability than the CTP and CTA models. Notably, the predictive ability of the NCCT and CTP models was comparable in patients with poor-grade aSAH. Our results suggest that NCCT may serve as a surrogate marker for DCI when advanced imaging is unavailable or not feasible. Validation in prospective studies is needed to confirm the clinical utility of our findings in practice.